. 2018 May;91(1085):20170318.
doi: 10.1259/bjr.20170318. Epub 2018 Feb 16.

Evaluation of periprostatic neurovascular fibers before and after radical prostatectomy by means of 1.5 T MRI diffusion tensor imaging

Affiliations

Evaluation of periprostatic neurovascular fibers before and after radical prostatectomy by means of 1.5 T MRI diffusion tensor imaging

Valerio Di Paola et al. Br J Radiol. 2018 May.

Abstract

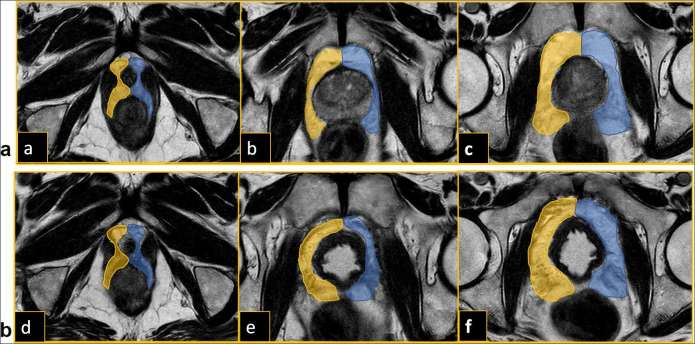
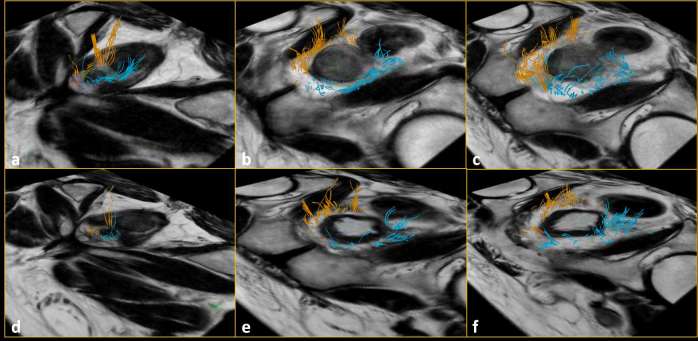
Objective: To evaluate if diffusion tensor imaging (DTI) is able to detect changes of periprostatic neurovascular fibers (PNFs) before and after radical prostatectomy (RP), and if these changes are related to post-surgical urinary incontinence and erectile dysfunction.

Methods: 22 patients (mean age 62.6 years) with biopsy-proven prostate cancer underwent 1.5 T DTI before and after RP. The number, fractional anisotropy (FA) values and length of PNFs before and after RP were compared using Student's t-test. Each patient filled out two questionnaires before and after RP, one for the evaluation of urinary continence (ICIQ-SF) and one for the evaluation of erectile function (IIEF-5). The ratios of the number, FA values and length of PNFs before and after RP (DTI B-A RATIOs) and the ratios between the scores obtained before and after RP for both ICIQ-SF and IIEF-2 (ICIQ-SF B-A RATIOs and IIEF-2 B-A RATIOs) were calculated to perform the Kendall's τ-test between them.

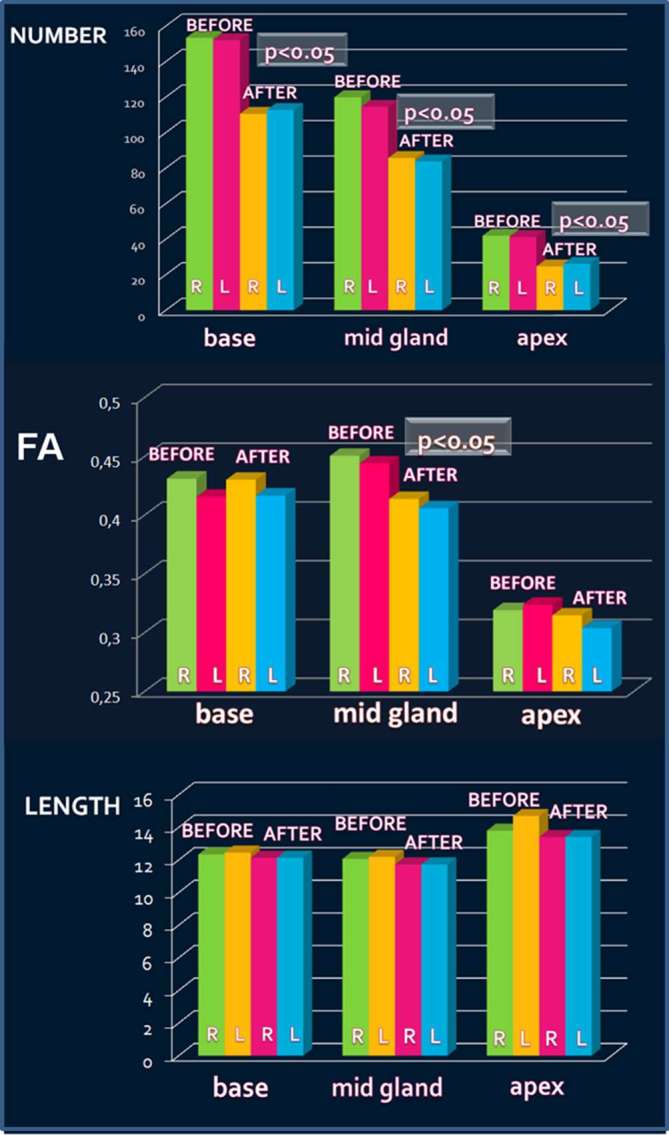
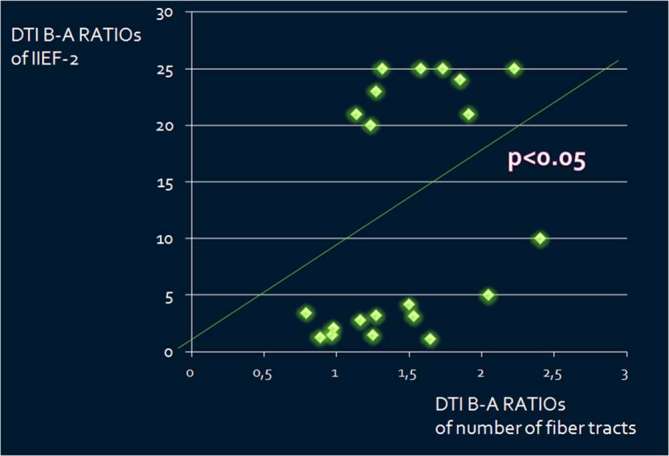
Results: There was a statistically significant decrease of the number of PNFs after RP at base, midgland, and apex (p < 0.01) and of FA values at midgland (p < 0.05), with positive statistically significant correlation between the DTI B-A RATIOs of the number of PNFs and IIEF-2 B-A RATIOs (p < 0.05, ρ = 0.47).

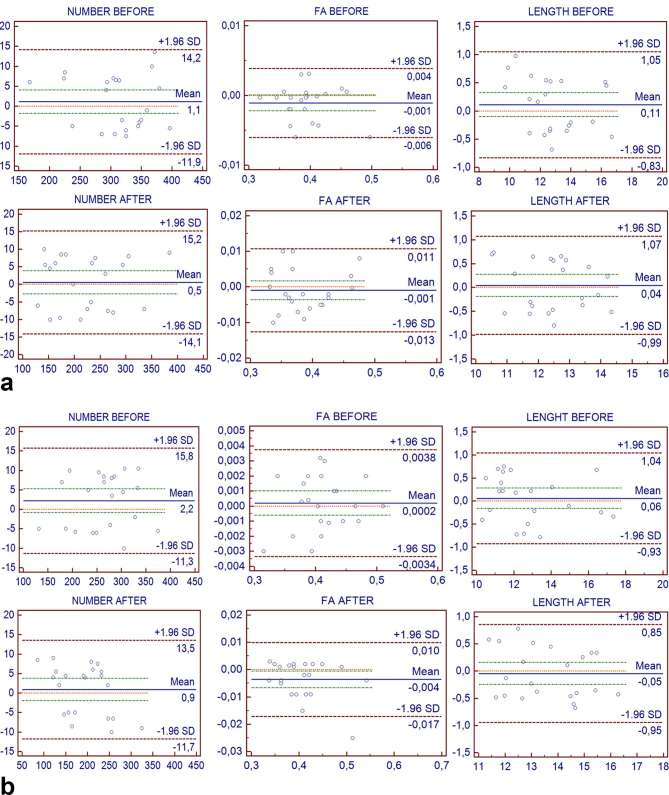
Conclusion: DTI was able to detect that the decrease of the number of the PNFs after RP was statistically related to the post-surgical erectile dysfunction (p < 0.05). Advances in knowledge: This work demonstrates that: (1) 1.5 T MRI DTI is able to detect the decrease of the number and of the FA of PNFs after prostatectomy; (2) the decrease of the number of PNFs after prostatectomy is related with the post-surgical erectile dysfunction; (3) 1.5 T MRI DTI has demonstrated to be a reproducible technique in detecting the changes of the PNFs induced by RP, with high interobserver agreement.


Figures

Figure 1.
Figure 1.
(a) Placing of ROIs on the fused T2-DTI images in the periprostatic fat tissue at base (a), mid gland (b) and apex (c) before radical prostatectomy. (b) Placing of ROIs on the fused T2-DTI images in the periprostatic fat tissue at base (d), mid gland (e) and apex (f) after radical prostatectomy. ROIs, regions of interest.
Figure 2.
Figure 2.
Number of fiber tracts at base (a), midgland (b) and apex (c) before radical prostatectomy: they were significantly lower (p < 0.01) after radical prostatectomy at base (d), at mid gland (e) and at apex (f).
Figure 3.
Figure 3.
Decrease of the number of fiber tracts after radical prostatectomy (RP) at base, mid gland, and apex on right (R) and left (L) side. FA values after RP at mid gland on right and left side. RP, radical prostatectomy; R, right; L, left
Figure 4.
Figure 4.
Correlation between the DTI B-A RATIOs of the number of fiber tracts and IIEF-2 B-A RATIOs (p < 0.05, τ = 0.35). B-A RATIOs = ratio before/after radical prostatectomy. DTI, diffusion tensor imaging.
Figure 5.
Figure 5.
(a) Bland–Altman plots (with 95% confidence interval) of the two repeated DTI measurements of Observer 1 for the number, the FA values and the length of the fiber tracts before and after radical prostatectomy. x-axis = mean of first and second measurement of Observer 1. y-axis = differences between first and second measurement of Observer 1. (b) Bland–Altman plots (with 95% confidence interval) of the two repeated DTI measurements of Observer 2 for the number, the FA values and the length of the fiber tracts before and after radical prostatectomy. x-axis = mean of first measurement and second measurement of Observer 2. y-axis = differences between first and second measurement of Observer 2. DTI, diffusion tensor imaging; FA, fractional anisotropy.

References

    1. Claus FG, Hricak H, Hattery RR. Pretreatment evaluation of prostate cancer: role of MR imaging and 1H MR spectroscopy. Radiographics 2004; 24(Suppl 1): S167–S180. doi: 10.1148/24si045516 - DOI - PubMed
    1. Kitajima K, Takahashi S, Ueno Y, Miyake H, Fujisawa M, Sugimura K. Visualization of periprostatic nerve fibers before and after radical prostatectomy using diffusion tensor magnetic resonance imaging with tractography. Clin Imaging 2014; 38: 302–6. doi: 10.1016/j.clinimag.2014.01.009 - DOI - PubMed
    1. Menon M, Shrivastava A, Kaul S, Badani KK, Fumo M, Bhandari M, et al. . Vattikuti Institute prostatectomy: contemporary technique and analysis of results. Eur Urol 2007; 51: 648–58. doi: 10.1016/j.eururo.2006.10.055 - DOI - PubMed
    1. Takenaka A, Leung RA, Fujisawa M, Tewari AK. Anatomy of autonomic nerve component in the male pelvis: the new concept from a perspective for robotic nerve sparing radical prostatectomy. World J Urol 2006; 24: 136–43. doi: 10.1007/s00345-006-0102-2 - DOI - PubMed
    1. Chabert CC, Merrilees DA, Neill MG, Eden CG. Curtain dissection of the lateral prostatic fascia and potency after laparoscopic radical prostatectomy: a veil of mystery. BJU Int 2008; 101: 1285–8. doi: 10.1111/j.1464-410X.2008.07595.x - DOI - PubMed