. 2018 Oct;20(10):1196-1205.
doi: 10.1038/gim.2017.241. Epub 2018 Feb 1.

Clinical whole-genome sequencing from routine formalin-fixed, paraffin-embedded specimens: pilot study for the 100,000 Genomes Project

Affiliations

Clinical whole-genome sequencing from routine formalin-fixed, paraffin-embedded specimens: pilot study for the 100,000 Genomes Project

Pauline Robbe et al. Genet Med. 2018 Oct.

Abstract

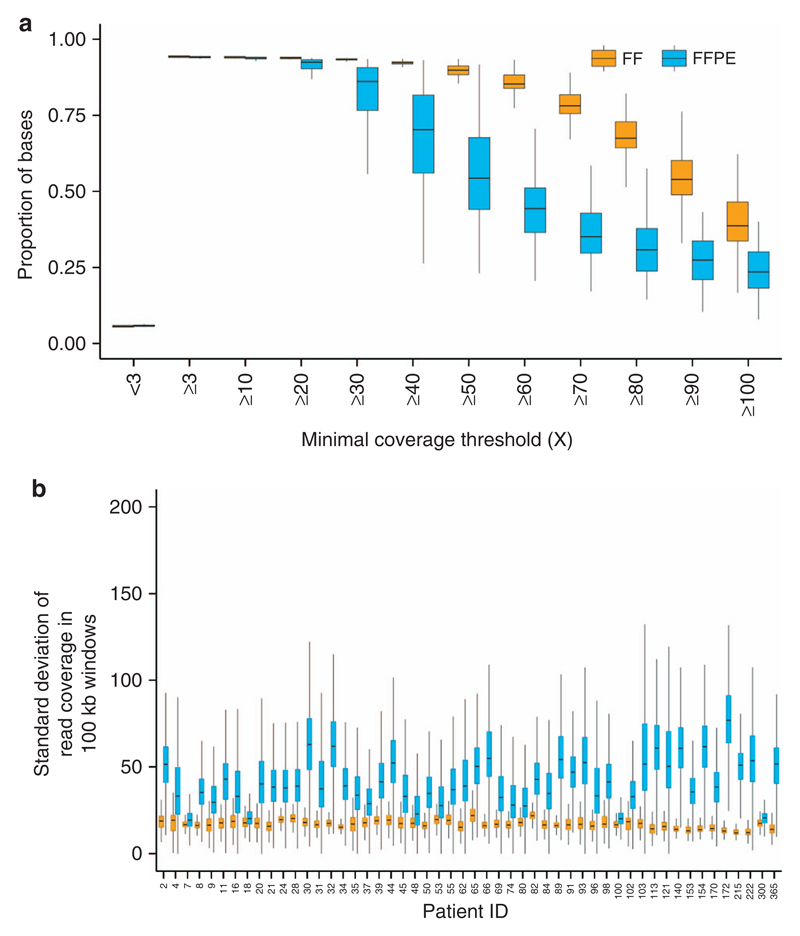
Purpose: Fresh-frozen (FF) tissue is the optimal source of DNA for whole-genome sequencing (WGS) of cancer patients. However, it is not always available, limiting the widespread application of WGS in clinical practice. We explored the viability of using formalin-fixed, paraffin-embedded (FFPE) tissues, available routinely for cancer patients, as a source of DNA for clinical WGS.

Methods: We conducted a prospective study using DNAs from matched FF, FFPE, and peripheral blood germ-line specimens collected from 52 cancer patients (156 samples) following routine diagnostic protocols. We compared somatic variants detected in FFPE and matching FF samples.

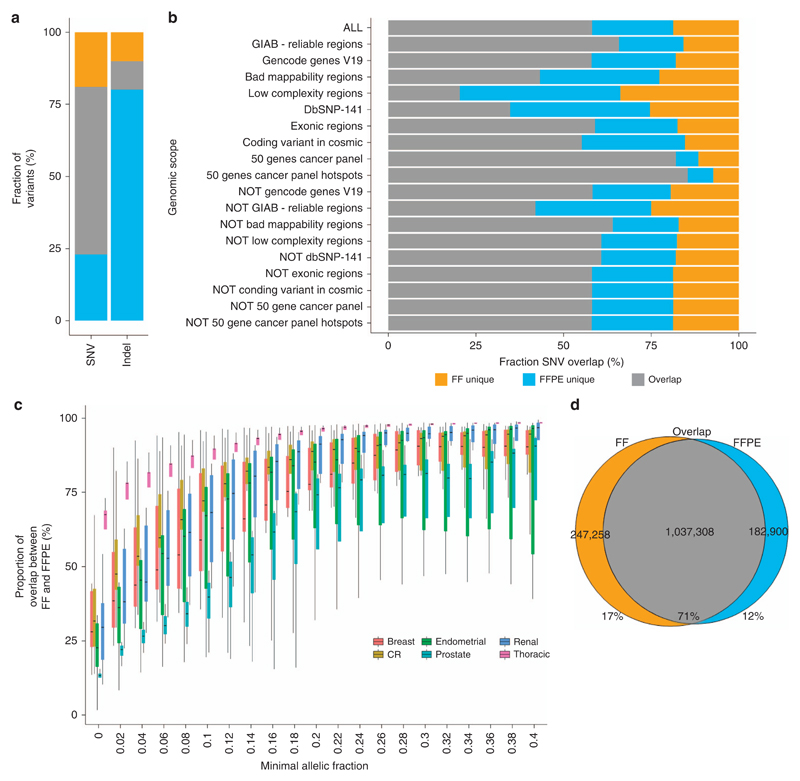
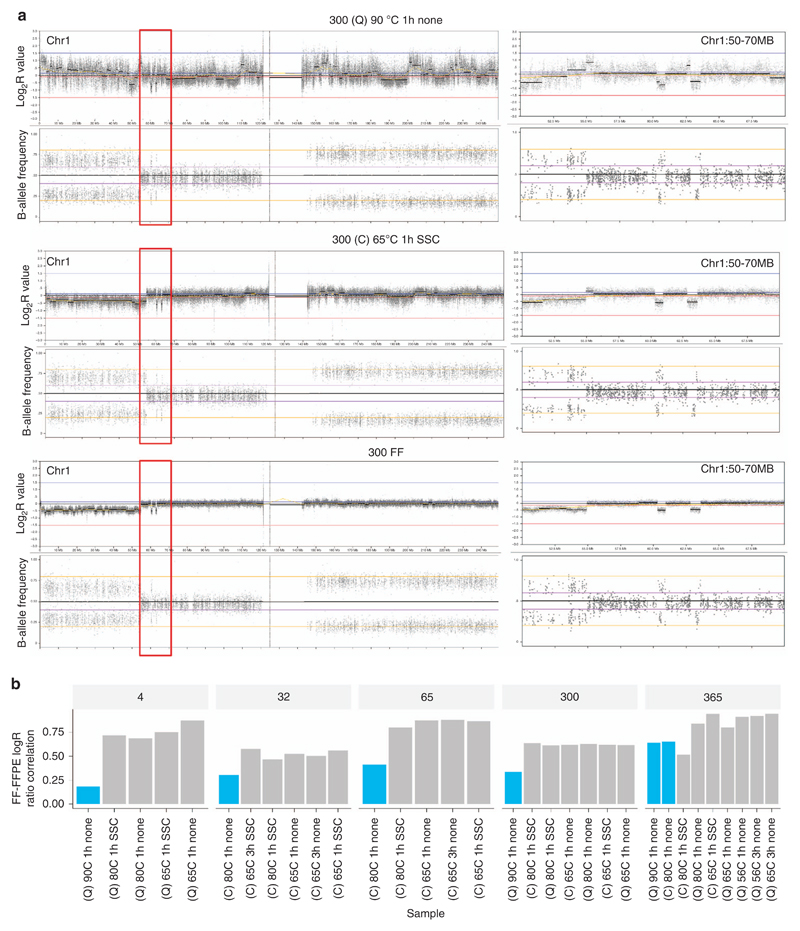
Results: We found the single-nucleotide variant agreement reached 71% across the genome and somatic copy-number alterations (CNAs) detection from FFPE samples was suboptimal (0.44 median correlation with FF) due to nonuniform coverage. CNA detection was improved significantly with lower reverse crosslinking temperature in FFPE DNA extraction (80 °C or 65 °C depending on the methods). Our final data showed somatic variant detection from FFPE for clinical decision making is possible. We detected 98% of clinically actionable variants (including 30/31 CNAs).

Conclusion: We present the first prospective WGS study of cancer patients using FFPE specimens collected in a routine clinical environment proving WGS can be applied in the clinic.

Keywords: clinical variant reporting; copy-number alteration; formalin-fixed, paraffin-embedded (FFPE); somatic variants; whole-genome sequencing.


Conflict of interest statement

Disclosure

J.B., M.H., M.T.R., Z.K., and D.R.B. are employees of Illumina, a public company that develops and markets systems for genetic analysis. The other authors declare no conflict of interest.

Figures

Figure 1
Figure 1. Sequencing depth statistics.
(a) Distribution of sequencing depth for different minimum coverage thresholds for 52 FF and 52 matching FFPE samples. The sequencing coverage aim for tumor samples was 70 ×. (b) Distribution of standard deviations of sequencing coverage in 100-kb genomic windows for FF and matching FFPE samples. Higher values denote poor coverage uniformity, which directly impacts variant detection. FF, fresh-frozen sample; FFPE, formalin-fixed, paraffin-embedded sample.
Figure 2
Figure 2. Somatic SNVs and small insertions and deletions detection and their respective overlap between FF and FFPE samples.
(a) Agreement between FF and FFPE samples of somatic SNVs and indels represented in percent. The three sections represent the FF-unique, FFPE-unique, and FF–FFPE overlap variants. (b) Overlap between FF and FFPE samples of somatic SNVs in different scopes of the genome showing the fraction of variant unique in FF, unique in FFPE, and in both FF and FFPE (the different regions are detailed in Supplementary Table S8). (c) Evolution of the proportion of SNVs in common in FF and FFPE samples when variants with low allelic fractions are filtered from the data set for each tissue type: renal (N = 14), CR (N = 12), prostate (N = 4), breast (N = 10), endometrial (N = 7), and thoracic (N = 5). (d) Agreement in SNVs between FF and FFPE samples. The following variants were considered for this plot: variants in reliable regions (Genome in a Bottle regions) where the depth needed to be at least 70 × at the position of the variant for both FF and FFPE samples and the allelic fraction needed to be at least 0.067 in one of the two samples (see Supplementary Figures S12 and S19 for details). CR, colorectal; FF, fresh-frozen sample; FFPE, formalin-fixed, paraffin-embedded sample; GIAB, Genome in a Bottle; SNV, single-nucleotide variant.
Figure 3
Figure 3. Somatic CNA detection.
(a) Detection illustrated by a representative example of the chromosome view in Nexus Copy Number showing CNAs across chromosome 6 for case 039 in the FF sample and FFPE sample. Log2 ratio (LogR) shows increase in intensity for genome amplifications and decrease in intensity for deletions, and the corresponding B-allele frequency plots show variation of the median signal for loss of heterozygosity. For each of the two samples, the top panel represents the Log2 ratio and the bottom panel shows the B-allele frequency. (b) Distribution of Spearman correlation coefficient of FF Log2R and FFPE Log2R showing the agreement between FF and FFPE. A high correlation coefficient represents a high agreement between FF and FFPE samples to differentiate change in copy-number intensity signal. B-allele freq, B-allele frequency; CNA, copy-number alteration; CR, colorectal; FF, fresh-frozen sample; FFPE: formalin-fixed, paraffin-embedded sample; Log2R, Log2 ratio.
Figure 4
Figure 4. CNA detection improvement using different DNA extraction conditions from the same FFPE sample.
(a) CNA detection improvement visualization for case 300. The left panels show the Log2R values and B-allele frequencies plotted for chromosome 1; the right panels show a zoomed-in view of the region in the red box (chr1:50000000–70000000) presenting two small deletions on chromosome 1. (b) Distribution of Spearman correlation coefficient of FF Log2R and FFPE Log2R. The experimental conditions are described in the following order: DNA extraction kit/reverse crosslinks temperature/reverse crosslinks incubation time/addition of buffer. Blue bars denote FFPE samples prepared according to the manufacturer’s instructions, gray bars represent FFPE samples prepared by optimizing the reverse crosslinking step. 300 (QC) 90 °C 1 h none is the FFPE sample from case 300 extracted with Qiagen kit (de-crosslinking conditions 90 °C for 1 h without any additional buffer); 300 (C) 65 °C 1 h SSC is the FFPE sample from case 300 extracted with Covaris kit (de-crosslinking conditions 65 °C for 1 h with additional SSC buffer); and 300 FF is the FF sample from case 300. C, Covaris kit; CNA, copy-number alteration; FF, fresh-frozen sample; FFPE, formalin-fixed, paraffin-embedded sample; Q, Qiagen kit; SSC, saline sodium citrate.

References

    1. Muir P, Li S, Lou S, et al. The real cost of sequencing: scaling computation to keep pace with data generation. Genome Biol. 2016;17:53. - PMC - PubMed
    1. Taylor C, Martin C, Lise S, et al. Factors influencing success of clinical genome sequencing across a broad spectrum of disorders. Nat Genet. 2015;47:717. - PMC - PubMed
    1. Travis WD, Brambilla E, Noguchi M, et al. International Association for the Study of Lung Cancer/American Thoracic Society/European Respiratory Society International Multidisciplinary Classification of Lung Adenocarcinoma. J Thorac Oncol. 2011;6:244–285. - PMC - PubMed
    1. Pang AWC, Macdonald JR, Yuen RKC, Hayes VM, Scherer SW. Performance of high-throughput sequencing for the discovery of genetic variation across the complete size spectrum. G3 (Bethesda) 2014;4:63–65. - PMC - PubMed
    1. Cottrell CE, Al-Kateb H, Bredemeyer AJ, et al. Validation of a next-generation sequencing assay for clinical molecular oncology. J Mol Diagn. 2014;16:89–105. - PMC - PubMed

Publication types