

Intermittent hypoxia causes histological kidney damage and increases growth factor expression in a mouse model of obstructive sleep apnea
- PMID: 29389945
- PMCID: PMC5794148
- DOI: 10.1371/journal.pone.0192084
Intermittent hypoxia causes histological kidney damage and increases growth factor expression in a mouse model of obstructive sleep apnea
Abstract
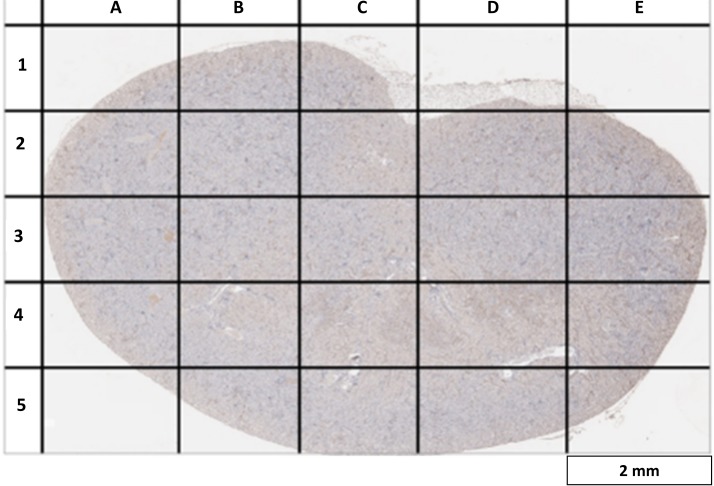
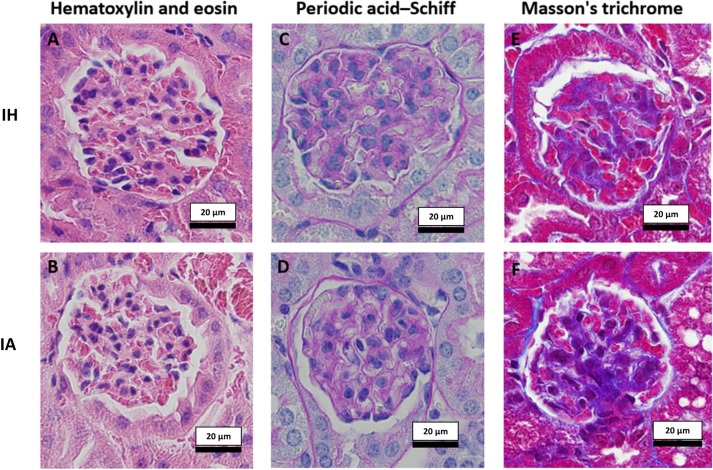
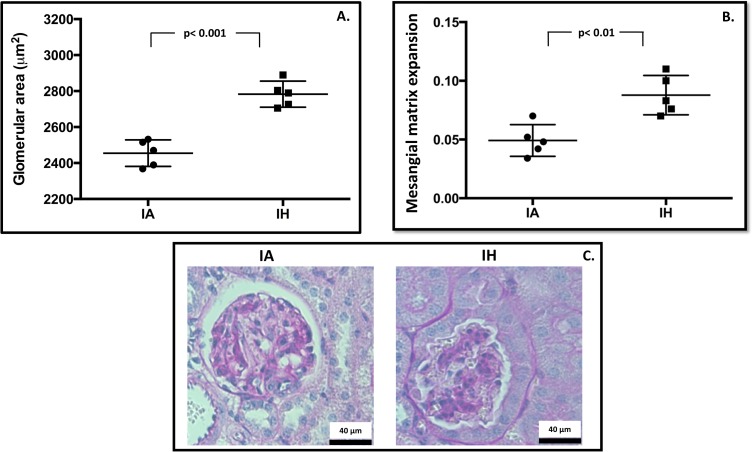
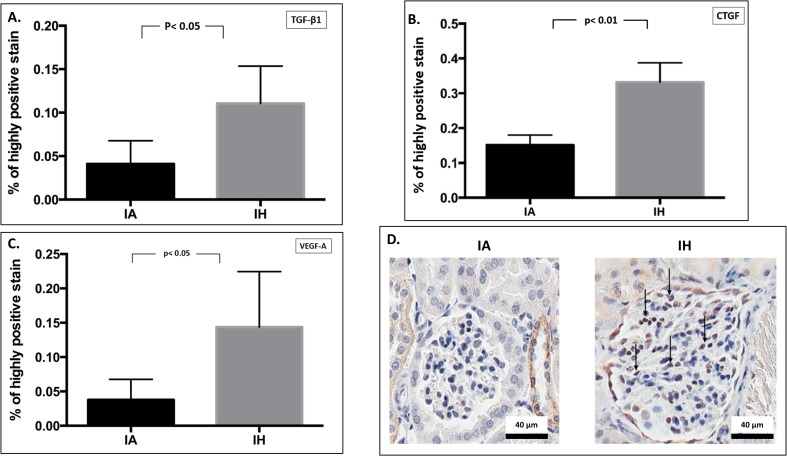
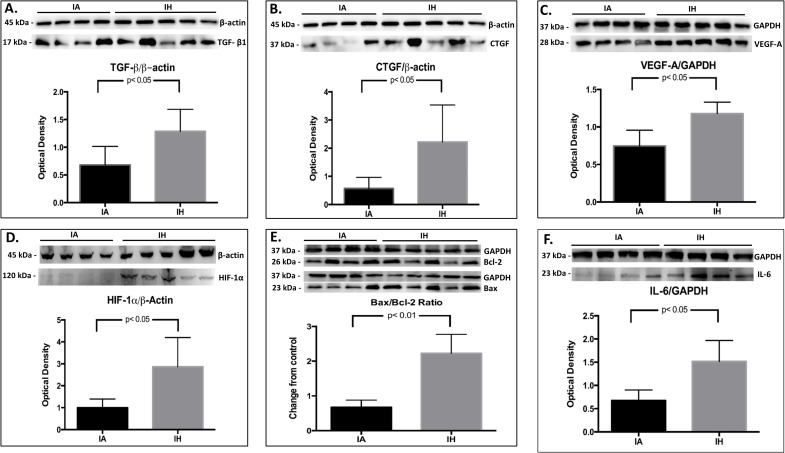
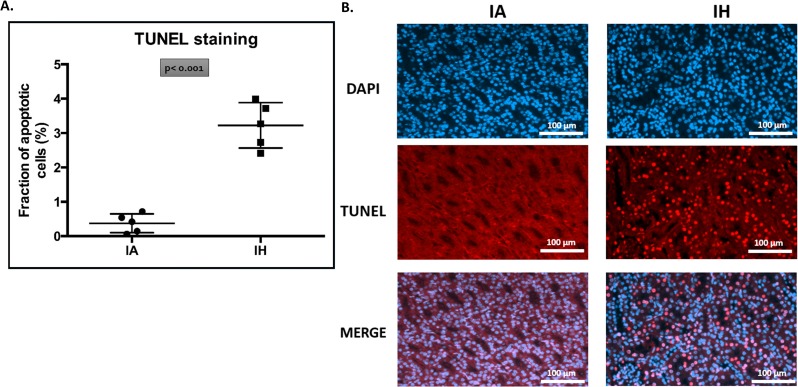
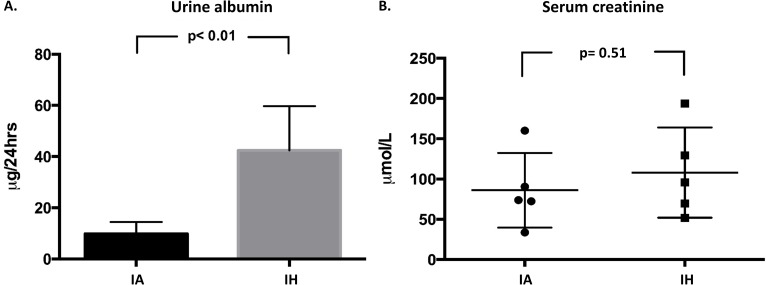
Epidemiological studies demonstrate an association between obstructive sleep apnea (OSA) and accelerated loss of kidney function. It is unclear whether the decline in function is due to OSA per se or to other confounding factors such as obesity. In addition, the structural kidney abnormalities associated with OSA are unclear. The objective of this study was to determine whether intermittent hypoxia (IH), a key pathological feature of OSA, induces renal histopathological damage using a mouse model. Ten 8-week old wild-type male CB57BL/6 mice were randomly assigned to receive either IH or intermittent air (IA) for 60 days. After euthanasia, one kidney per animal was paraformaldehyde-fixed and then sectioned for histopathological and immunohistochemical analysis. Measurements of glomerular hypertrophy and mesangial matrix expansion were made in periodic acid-Schiff stained kidney sections, while glomerular transforming growth factor-β1 (TGF-β1), connective tissue growth factor (CTGF) and vascular endothelial growth factor-A (VEGF-A) proteins were semi-quantified by immunohistochemistry. The antigen-antibody reaction was detected by 3,3'-diaminobenzidine chromogen where the color intensity semi-quantified glomerular protein expression. To enhance the accuracy of protein semi-quantification, the percentage of only highly-positive staining was used for analysis. Levels of TGF-β, CTGF and VEGF-A proteins in the kidney cortex were further quantified by western blotting. Cellular apoptosis was also investigated by measuring cortical antiapoptotic B-cell lymphoma 2 (Bcl-2) and apoptotic Bcl-2-associated X (Bax) proteins by western blotting. Further investigation of cellular apoptosis was carried out by fluorometric terminal deoxynucleotidyl transferase (TdT) dUTP Nick-End Labeling (TUNEL) staining. Finally, the levels of serum creatinine and 24-hour urinary albumin were measured as a general index of renal function. Our results indicate that mice exposed to IH have an increased glomerular area (by 1.13 fold, p< 0.001) and expansion of mesangial matrix (by 1.8 fold, p< 0.01). Moreover, the glomerular expressions of TGF-β1, CTGF and VEGF-A proteins were 2.7, 2.2 and 3.8-fold higher in mice exposed to IH (p< 0.05 for all). Furthermore, western blotting protein analysis demonstrates that IH-exposed mice express higher levels of TGF-β1, CTGF and VEGF-A proteins by 1.9, 4.0 and 1.6-fold (p< 0.05 for all) respectively. Renal cellular apoptosis was greater in the IH group as shown by an increased cortical Bax/Bcl-2 protein ratio (p< 0.01) and higher fluorometric TUNEL staining (p< 0.001). Finally, 24-hr urinary albumin levels were higher in mice exposed to IH (43.4 μg vs 9.7 μg, p< 0.01), while there were no differences in serum creatinine levels between the two groups. We conclude that IH causes kidney injury that is accompanied by glomerular hypertrophy, mesangial matrix expansion, increased expression of glomerular growth factors and an increased cellular apoptosis.
Conflict of interest statement
Figures
Similar articles
-
Chronic intermittent hypoxia induces lung growth in adult mice.Am J Physiol Lung Cell Mol Physiol. 2011 Feb;300(2):L266-73. doi: 10.1152/ajplung.00239.2010. Epub 2010 Dec 3. Am J Physiol Lung Cell Mol Physiol. 2011. PMID: 21131398 Free PMC article.
-
Intermittent hypoxia promotes melanoma lung metastasis via oxidative stress and inflammation responses in a mouse model of obstructive sleep apnea.Respir Res. 2018 Feb 12;19(1):28. doi: 10.1186/s12931-018-0727-x. Respir Res. 2018. PMID: 29433520 Free PMC article.
-
Chronic intermittent hypoxia increases β cell mass and activates the mammalian target of rapamycin/hypoxia inducible factor 1/vascular endothelial growth factor A pathway in mice pancreatic islet.Chin Med J (Engl). 2013 Jun;126(12):2368-73. Chin Med J (Engl). 2013. PMID: 23786956
-
Metabolic consequences of intermittent hypoxia: relevance to obstructive sleep apnea.Best Pract Res Clin Endocrinol Metab. 2010 Oct;24(5):843-51. doi: 10.1016/j.beem.2010.08.011. Best Pract Res Clin Endocrinol Metab. 2010. PMID: 21112030 Free PMC article. Review.
-
Impact of obstructive sleep apnoea and intermittent hypoxia on cardiovascular and cerebrovascular regulation.Exp Physiol. 2017 Jul 1;102(7):743-763. doi: 10.1113/EP086051. Epub 2017 Jun 27. Exp Physiol. 2017. PMID: 28439921 Review.
Cited by
-
Association between Obstructive Sleep Apnea and Chronic Kidney Disease According to Sex, Long Working Hours: The Korean National Health and Nutrition Examination Survey (2019-2020).Life (Basel). 2023 Jul 26;13(8):1625. doi: 10.3390/life13081625. Life (Basel). 2023. PMID: 37629482 Free PMC article.
-
Multi-Omics Analysis of Circulating Exosomes in Adherent Long-Term Treated OSA Patients.Int J Mol Sci. 2023 Nov 8;24(22):16074. doi: 10.3390/ijms242216074. Int J Mol Sci. 2023. PMID: 38003263 Free PMC article.
-
Effect of CPAP therapy on kidney function in patients with obstructive sleep apnoea and chronic kidney disease: a protocol for a randomised controlled clinical trial.BMJ Open. 2019 Mar 23;9(3):e024632. doi: 10.1136/bmjopen-2018-024632. BMJ Open. 2019. PMID: 30904853 Free PMC article.
-
Obstructive Sleep Apnea and Circulating Biomarkers of Oxidative Stress: A Cross-Sectional Study.Antioxidants (Basel). 2020 Jun 2;9(6):476. doi: 10.3390/antiox9060476. Antioxidants (Basel). 2020. PMID: 32498324 Free PMC article.
-
Cardiovascular Disease in Obstructive Sleep Apnea: Putative Contributions of Mineralocorticoid Receptors.Int J Mol Sci. 2023 Jan 23;24(3):2245. doi: 10.3390/ijms24032245. Int J Mol Sci. 2023. PMID: 36768567 Free PMC article. Review.
References
-
- Young T, Evans L, Finn L, Palta M. Estimation of the clinically diagnosed proportion of sleep apnea syndrome in middle-aged men and women. Sleep. 1997. September;20(9):705–6. - PubMed
-
- Calvin AD, Albuquerque FN, Lopez-Jimenez F, Somers VK. Obstructive sleep apnea, inflammation, and the metabolic syndrome. Metab Syndr Relat Disord. 2009. August;7(4):271–8. doi: 10.1089/met.2008.0093 - DOI - PMC - PubMed
-
- Abuyassin B, Sharma K, Ayas NT, Laher I. Obstructive sleep apnea and kidney disease: A potential bidirectional relationship? J Clin Sleep Med. 2015. August 15;11(8):915–24. doi: 10.5664/jcsm.4946 - DOI - PMC - PubMed
-
- Wang X, Ouyang Y, Wang Z, Zhao G, Liu L, Bi Y. Obstructive sleep apnea and risk of cardiovascular disease and all-cause mortality: a meta-analysis of prospective cohort studies. Int J Cardiol. 2013. November 5;169(3):207–14. doi: 10.1016/j.ijcard.2013.08.088 - DOI - PubMed
-
- Rajan P, Greenberg H. Obstructive sleep apnea as a risk factor for type 2 diabetes mellitus. Nat Sci Sleep. 2015. October 5; 7:113–25. doi: 10.2147/NSS.S90835 - DOI - PMC - PubMed
Publication types
MeSH terms
Substances
LinkOut - more resources
Full Text Sources
Other Literature Sources
Research Materials
Miscellaneous
