. 2018 Feb 1;13(2):e0192250.
doi: 10.1371/journal.pone.0192250. eCollection 2018.

The Candida albicans stress response gene Stomatin-Like Protein 3 is implicated in ROS-induced apoptotic-like death of yeast phase cells

Affiliations

The Candida albicans stress response gene Stomatin-Like Protein 3 is implicated in ROS-induced apoptotic-like death of yeast phase cells

Karen A Conrad et al. PLoS One. .

Abstract

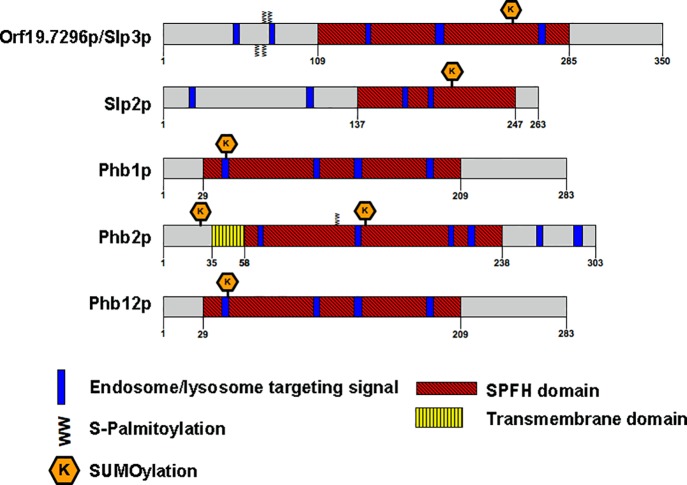
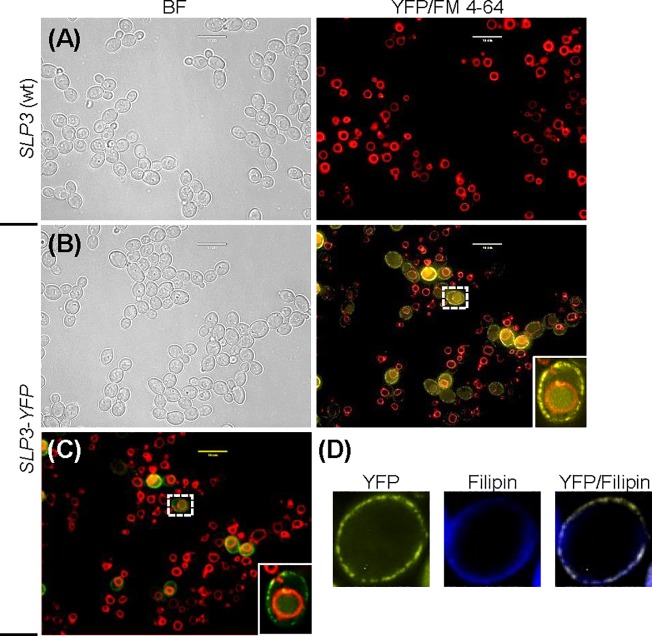
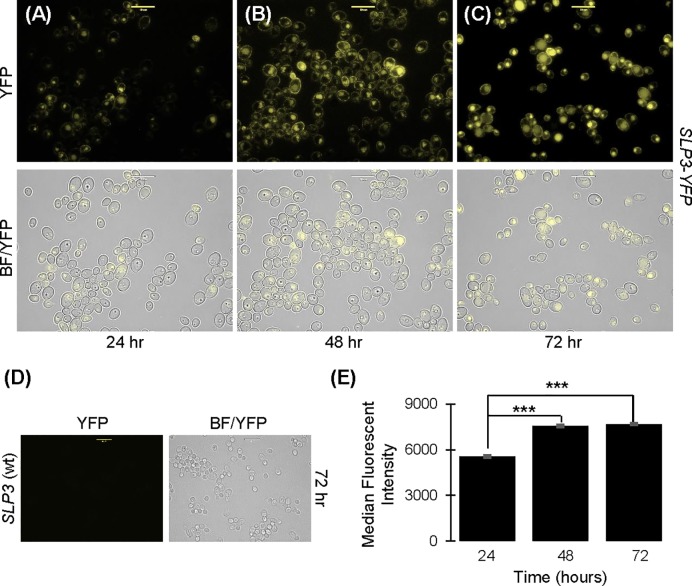
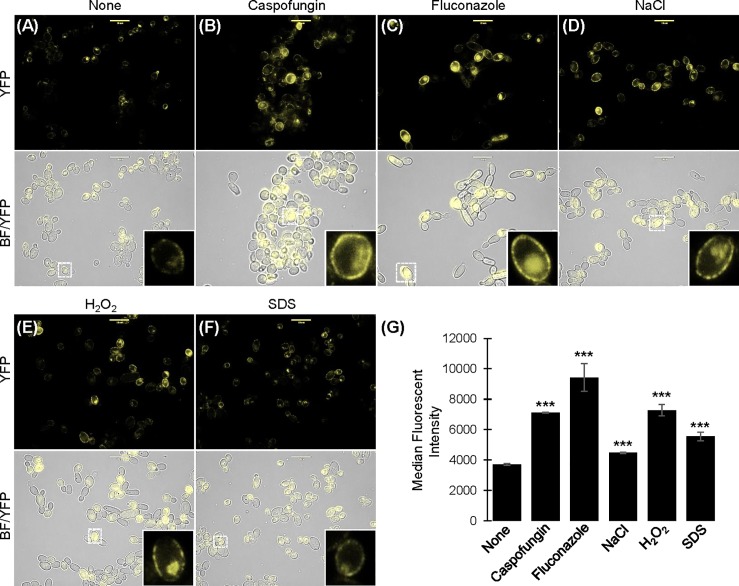
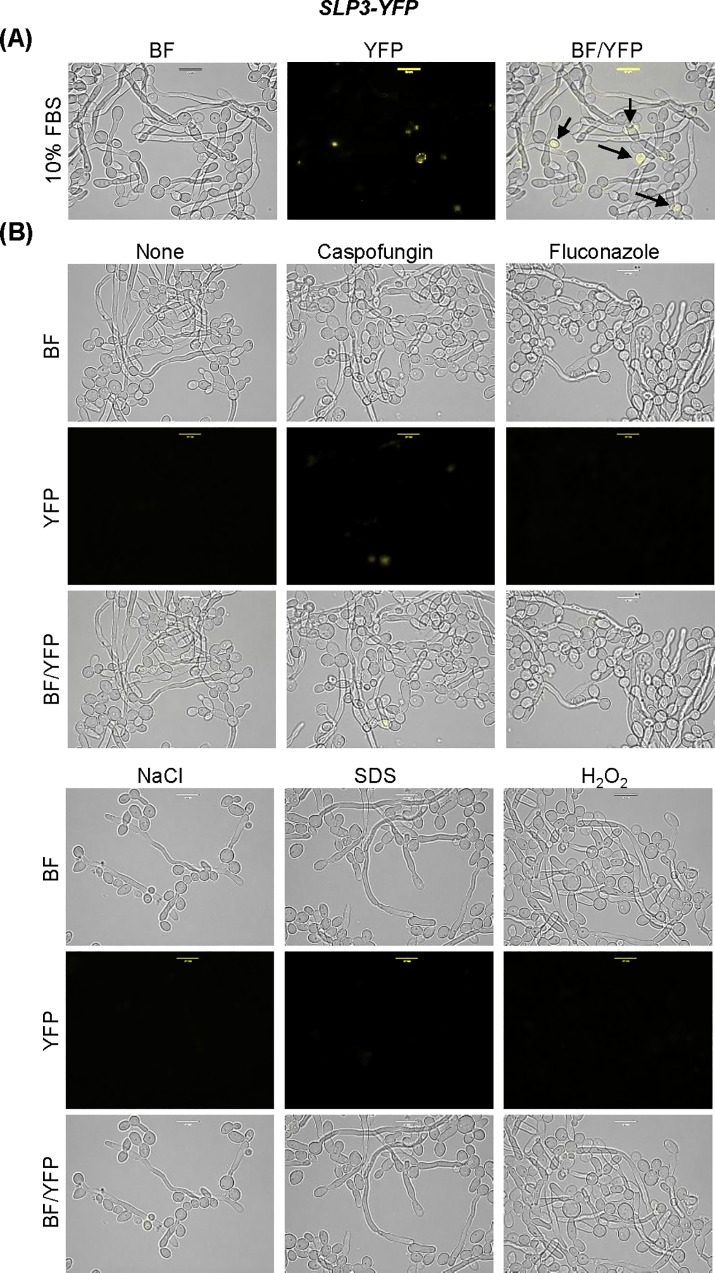
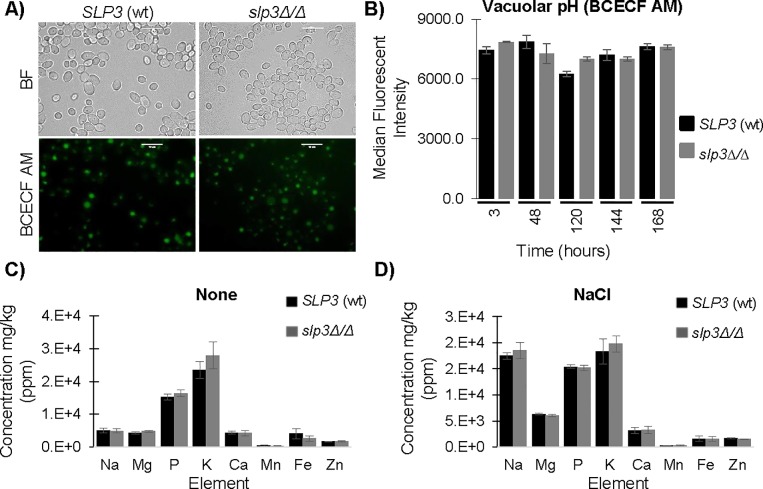
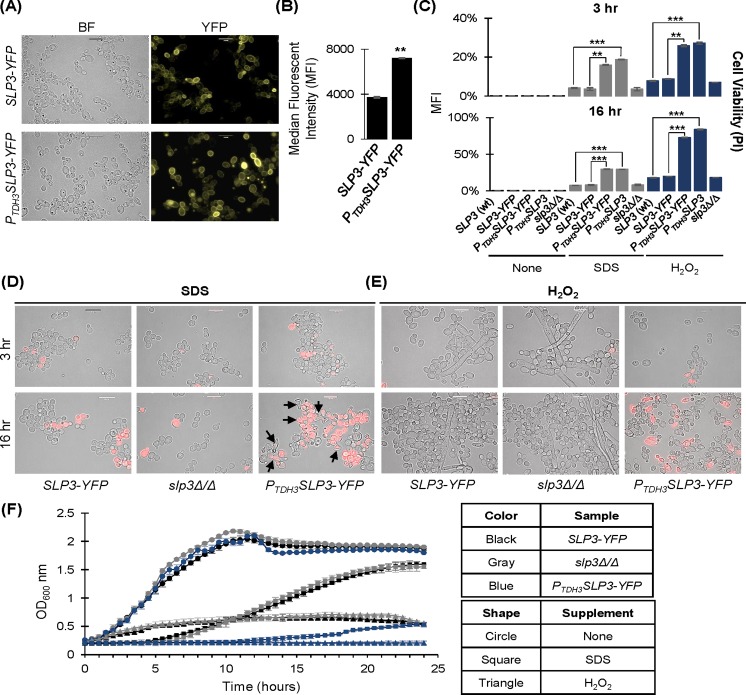
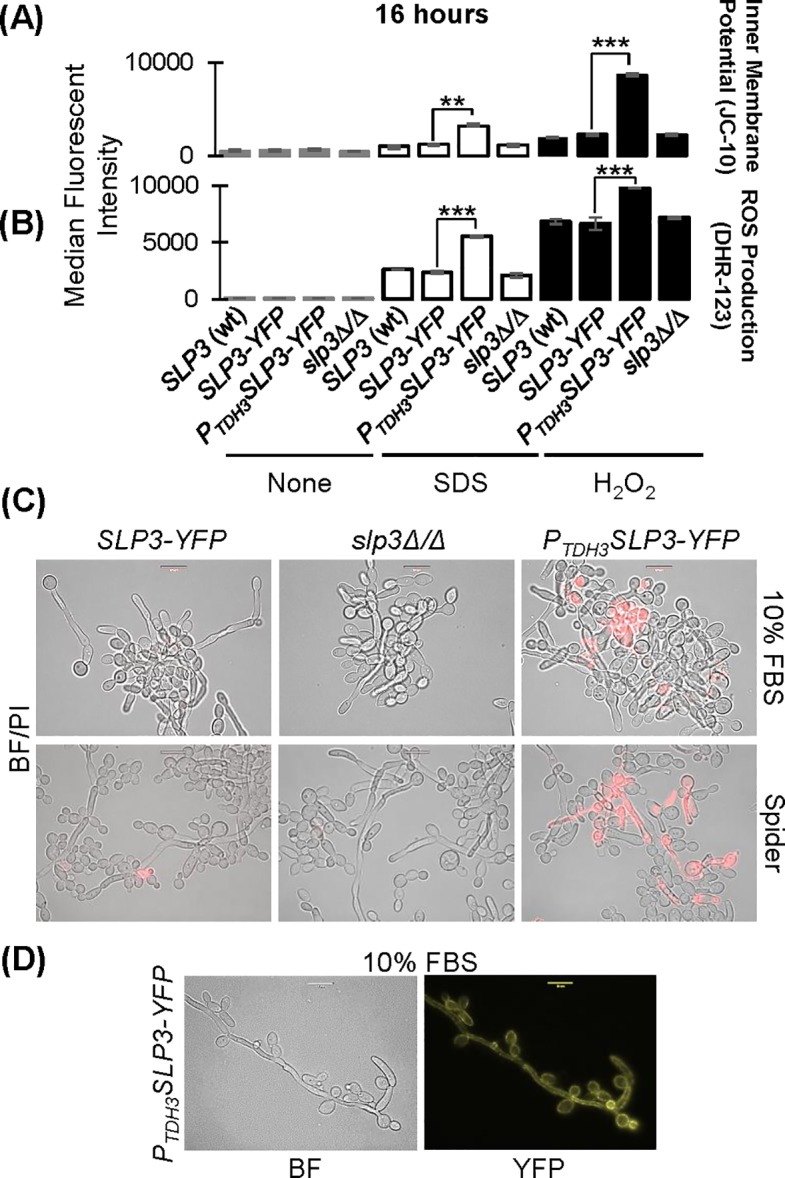
The ubiquitous presence of SPFH (Stomatin, Prohibitin, Flotillin, HflK/HflC) proteins in all domains of life suggests that their function would be conserved. However, SPFH functions are diverse with organism-specific attributes. SPFH proteins play critical roles in physiological processes such as mechanosensation and respiration. Here, we characterize the stomatin ORF19.7296/SLP3 in the opportunistic human pathogen Candida albicans. Consistent with the localization of stomatin proteins, a Slp3p-Yfp fusion protein formed visible puncta along the plasma membrane. We also visualized Slp3p within the vacuolar lumen. Slp3p primary sequence analyses identified four putative S-palmitoylation sites, which may facilitate membrane localization and are conserved features of stomatins. Plasma membrane insertion sequences are present in mammalian and nematode SPFH proteins, but are absent in Slp3p. Strikingly, Slp3p was present in yeast cells, but was absent in hyphal cells, thus categorizing it as a yeast-phase specific protein. Slp3p membrane fluorescence significantly increased in response to cellular stress caused by plasma membrane, cell wall, oxidative, or osmotic perturbants, implicating SLP3 as a general stress-response gene. A slp3Δ/Δ homozygous null mutant had no detected phenotype when slp3Δ/Δ mutants were grown in the presence of a variety of stress agents. Also, we did not observe a defect in ion accumulation, filamentation, endocytosis, vacuolar structure and function, cell wall structure, or cytoskeletal structure. However, SLP3 over-expression triggered apoptotic-like death following prolonged exposure to oxidative stress or when cells were induced to form hyphae. Our findings reveal the cellular localization of Slp3p, and for the first time associate Slp3p function with the oxidative stress response.


Conflict of interest statement

Competing Interests: The authors have declared that no competing interests exist.

Figures

Fig 1
Fig 1. Structure of C. albicans SPFH proteins.
Schematic representation of Orf19.7296p/Slp3p compared to C. albicans SPFH family members. Images are drawn to scale.
Fig 2
Fig 2. Localization of Slp3p.
(A) Exponential-phase samples of the untagged wt SLP3 control strain and (B) SLP3-YFP expressing strain were treated with 160 μM FM 4–64. The FM 4–64 incubation period was set to allow visualization of the vacuole. Cells were viewed under bright-field (BF) and fluorescent microscopy. The right panels show an overlay of the YFP and FM 4–64 fluorescence (YFP/FM 4–64). (C) Overlay photo shown in (B) was recolored with ImageJ to assess Slp3p-Yfp vacuolar membrane localization. The yellow fluorescence color was reassigned to green. (D) Overnight-cultured SLP3-YFP cells were treated with 200 μg/mL Filipin and viewed using fluorescent microscopy. Image depicts a single cell, and the right panel shows an overlay of the YFP and Filipin fluorescence (YFP/Filipin). The dashed white box highlights the cell depicted in the inset image. For each assay, three biological replicates were analyzed. Experiments were repeated at least three times, and data presented represents one representative experiment. Approximately 1.0 x 10⁴ cells of each strain were selected for viewing (A-D). Scale bars represent 10 μm.
Fig 3
Fig 3. Growth phase localization of Slp3p.
Samples of SLP3-YFP cells were collected at (A) 24, (B) 48, and (C) 72 hours and examined under bright-field and fluorescent microscopy. (D) Fluorescence of untagged wt SLP3 control cells grown for 72 hours was examined to assess potential yeast auto-fluorescence. Approximately 1.0 x 10⁴ cells of each strain were selected for viewing (A-D). Scale bars represent 10 μm. (E) Fluorescence of SLP3-YFP samples was quantified by flow cytometry at the indicated time points. Untagged wt SLP3 control cells were analyzed at identical time points and served as a negative fluorescent control. For each assay, three biological replicates were analyzed. Experiments were repeated at least three times, and data presented represents one representative experiment. ***p < 0.001 when compared to SLP3-YFP cells grown for 24 hours. Scale bars represent 10 μm.
Fig 4
Fig 4. Stress-induced localization of Slp3p.
Exponential-phase SLP3-YFP cells were incubated in YPD+uri for 30 minutes with the following additives: (A) None, (B) 125 ng/mL caspofungin, (C) 2.5 μg/mL fluconazole, (D) 1.0 M NaCl, (E) 0.17% H2O2, or (F) 0.08% SDS. Samples were observed under bright-field and fluorescent microscopy. Dashed white boxes shows the cell depicted in the inset image. (G) Fluorescence was quantified by flow cytometry. For each assay, three biological replicates were analyzed. Experiments were repeated at least three times, and data presented represents one representative experiment. ***p < 0.001 when compared to the untreated sample. Approximately 1.0 x 10⁴ cells of each strain were selected for viewing (A-F). Scale bars represent 10 μm.
Fig 5
Fig 5. Localization of Slp3p in the yeast-to-hyphae transition.
(A) SLP3-YFP cells were grown in 10% FBS/YPD+uri medium for 16 hours and observed under bright-field and fluorescent microscopy. Arrows highlight fluorescent yeast-phase cells. (B) Overnight cultured SLP3-YFP hyphal cells were standardized in 10% FBS/YPD+uri media and incubated for 45 minutes with the given additives and viewed under bright-field and fluorescent microscopy. The concentration of additives used is as follows: 125 ng/mL caspofungin, 2.5 μg/mL fluconazole, 1.0 M NaCl, 0.17% H2O2, and 0.08% SDS. For each assay, three biological replicates were analyzed. Experiments were repeated at least three times, and data presented represents one representative experiment. Approximately 1.0 x 10⁴ cells of each strain were selected for viewing. Scale bars represent 10 μm.
Fig 6
Fig 6. Analysis of intracellular ion levels and vacuolar function in the slp3Δ/Δ mutant strain.
(A) Exponential-phase samples of wt SLP3 and homozygous null slp3Δ/Δ mutant cells were stained with 10 μM BCECF AM for 40 minutes, and washed before visualizing using bright-field and fluorescence microscopy. Approximately 1.0 x 10⁴ cells of each strain were selected for viewing. (B) Flow cytometry was used to monitor vacuolar acidification at the indicated time points in yeast exponential and stationary phase cells. For each assay, three biological replicates were analyzed. Experiments were repeated at least three times, and data presented represents one representative experiment. Scale bars represent 10 μm. (C) Inductively coupled plasma mass spectrometry analysis was performed on exponential-phase wt control SLP3 cells and slp3Δ/Δ homozygous null mutant cells grown in nutrient YPD+uri medium and (D) following treatment with 1.0 M NaCl for 30 minutes as described in Methods. Mean values were calculated based on values obtained from three biological replicates. Two independent experiments were performed, and data presented represents one representative experiment.
Fig 7
Fig 7. Phenotype of SLP3 over-expression.
(A) Exponential-phase samples of PTDH3SLP3-YFP over-expressing cells and SLP3-YFP cells were examined under bright-field and fluorescent microscopy. (B) Samples described in (A) were quantified by flow cytometry. (C-E) Overnight yeast cultures were diluted into YPD+uri supplemented with the indicated additive and grown for 3 or 16 hours. Cells were treated with PI and examined using bright-field and fluorescent microscopy. Cells were quantified by flow cytometry. (F) Stationary phase cultures were standardized in the appropriate media, and growth kinetics were analyzed for 24 hours in the presence and absence of the indicated additive. For each assay, three biological replicates were analyzed. Experiments were repeated at least three times, and data presented represents one representative experiment. *p < 0.05, **p < 0.01, ***p < 0.001 when compared to the isogenic parental strain. Approximately 1.0 x 10⁴ cells of each strain were selected for viewing (A, D-E). Scale bars represent 10 μm.
Fig 8
Fig 8. Analysis of apoptosis in SLP3 over-expressing cells.
(A) Mitochondrial membrane potential was measured in overnight cultured cells following exposure with the given additives for 16 hours. Samples were labeled using JC-10 and quantified using flow cytometry. (B) Intracellular ROS production was studied in yeast cells following incubation with the indicated additives for 16 hours. Samples were labeled with DHR-123 and quantified using flow cytometry. Gray bars represent untreated samples; white bars represent samples treated with 0.08% SDS, and black bars represent samples treated with 0.17% H2O2. Similar findings were observed in samples treated for 3 hours. (C) PTDH3SLP3-YFP cells were grown in 10% FBS/YPD+uri and Spider media to observe the yeast-to-hyphae transition and stained with PI to assess viability. Samples were visualized using bright-field and fluorescence microscopy. (D) Slp3p puncta were visualized in the plasma membrane of yeast-phase cells and hyphal germ tube using bright-field and fluorescent microscopy. For each assay, three biological replicates were analyzed. Experiments were repeated at least three times, and data presented represents one representative experiment. *p < 0.05, **p < 0.01, ***p < 0.001 when compared to the isogenic parental strain. Approximately 1.0 x 10⁴ cells of each strain were selected for viewing. Scale bars represent 10 μm.

Similar articles

Cited by

References

    1. Rivera-Milla E, Stuermer CA, Malaga-Trillo E. Ancient origin of reggie (flotillin), reggie-like, and other lipid-raft proteins: convergent evolution of the SPFH domain. Cell Mol Life Sci. 2006;63(3):343–57. doi: 10.1007/s00018-005-5434-3 . - DOI - PMC - PubMed
    1. Browman DT, Hoegg MB, Robbins SM. The SPFH domain-containing proteins: more than lipid raft markers. Trends Cell Biol. 2007;17(8):394–402. doi: 10.1016/j.tcb.2007.06.005 . - DOI - PubMed
    1. Lapatsina L, Brand J, Poole K, Daumke O, Lewin GR. Stomatin-domain proteins. Eur J Cell Biol. 2012;91(4):240–5. doi: 10.1016/j.ejcb.2011.01.018 . - DOI - PubMed
    1. Lee JH, Hsieh CF, Liu HW, Chen CY, Wu SC, Chen TW, et al. Lipid raft-associated stomatin enhances cell fusion. FASEB J. 2017;31(1):47–59. doi: 10.1096/fj.201600643R . - DOI - PubMed
    1. Reuter AT, Stuermer CA, Plattner H. Identification, localization, and functional implications of the microdomain-forming stomatin family in the ciliated protozoan Paramecium tetraurelia. Eukaryot Cell. 2013;12(4):529–44. doi: 10.1128/EC.00324-12 ; PubMed Central PMCID: PMCPMC3623435. - DOI - PMC - PubMed

Publication types

LinkOut - more resources