Multiband multi-echo simultaneous ASL/BOLD for task-induced functional MRI
- PMID: 29389985
- PMCID: PMC5794066
- DOI: 10.1371/journal.pone.0190427
Multiband multi-echo simultaneous ASL/BOLD for task-induced functional MRI
Abstract
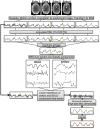
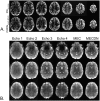
Typical simultaneous blood oxygenation-level dependent (BOLD) and arterial spin labeling (ASL) sequences acquire two echoes, one perfusion-sensitive and one BOLD-sensitive. However, for ASL, spatial resolution and brain coverage are limited due to the T1 decay of the labeled blood. This study applies a sequence combining a multiband acquisition with four echoes for simultaneous BOLD and pseudo-continuous ASL (pCASL) echo planar imaging (MBME ASL/BOLD) for block-design task-fMRI. A multiband acceleration of four was employed to increase brain coverage and reduce slice-timing effects on the ASL signal. Multi-echo independent component analysis (MEICA) was implemented to automatically denoise the BOLD signal by regressing non-BOLD components. This technique led to increased temporal signal-to-noise ratio (tSNR) and BOLD sensitivity. The MEICA technique was also modified to denoise the ASL signal by regressing artifact and BOLD signals from the first echo time-series. The MBME ASL/BOLD sequence was applied to a finger-tapping task functional MRI (fMRI) experiment. Signal characteristics and activation were evaluated using single echo BOLD, combined ME BOLD, combined ME BOLD after MEICA denoising, perfusion-weighted (PW), and perfusion-weighted after MEICA denoising time-series. The PW data was extracted using both surround subtraction and high-pass filtering followed by demodulation. In addition, the CBF/BOLD response ratio and CBF/BOLD coupling were analyzed. Results showed that the MEICA denoising procedure significantly improved the BOLD signal, leading to increased BOLD sensitivity, tSNR, and activation statistics compared to conventional single echo BOLD data. At the same time, the denoised PW data showed increased tSNR and activation statistics compared to the non-denoised PW data. CBF/BOLD coupling was also increased using the denoised ASL and BOLD data. Our preliminary data suggest that the MBME ASL/BOLD sequence can be employed to collect whole-brain task-fMRI with improved data quality for both BOLD and PW time series, thus improving the results of block-design task fMRI.
Conflict of interest statement
Figures


Similar articles
-
Multiband multi-echo imaging of simultaneous oxygenation and flow timeseries for resting state connectivity.PLoS One. 2017 Mar 2;12(3):e0169253. doi: 10.1371/journal.pone.0169253. eCollection 2017. PLoS One. 2017. PMID: 28253268 Free PMC article.
-
Improved resting state functional connectivity sensitivity and reproducibility using a multiband multi-echo acquisition.Neuroimage. 2021 Jan 15;225:117461. doi: 10.1016/j.neuroimage.2020.117461. Epub 2020 Oct 16. Neuroimage. 2021. PMID: 33069864 Free PMC article.
-
Comparison of 3T and 7T ASL techniques for concurrent functional perfusion and BOLD studies.Neuroimage. 2017 Aug 1;156:363-376. doi: 10.1016/j.neuroimage.2017.05.038. Epub 2017 May 19. Neuroimage. 2017. PMID: 28528845
-
Multi-echo fMRI: A review of applications in fMRI denoising and analysis of BOLD signals.Neuroimage. 2017 Jul 1;154:59-80. doi: 10.1016/j.neuroimage.2017.03.033. Epub 2017 Mar 29. Neuroimage. 2017. PMID: 28363836 Review.
-
Measurement of cerebral perfusion with arterial spin labeling: Part 1. Methods.J Int Neuropsychol Soc. 2007 May;13(3):517-25. doi: 10.1017/S1355617707070646. J Int Neuropsychol Soc. 2007. PMID: 17445301 Review.
Cited by
-
Improving the Breath-Holding CVR Measurement Using the Multiband Multi-Echo EPI Sequence.Front Physiol. 2021 Feb 26;12:619714. doi: 10.3389/fphys.2021.619714. eCollection 2021. Front Physiol. 2021. PMID: 33716769 Free PMC article.
-
Language lateralization from task-based and resting state functional MRI in patients with epilepsy.Hum Brain Mapp. 2020 Aug 1;41(11):3133-3146. doi: 10.1002/hbm.25003. Epub 2020 Apr 24. Hum Brain Mapp. 2020. PMID: 32329951 Free PMC article.
-
Resting state BOLD-perfusion coupling patterns using multiband multi-echo pseudo-continuous arterial spin label imaging.Sci Rep. 2025 Jan 15;15(1):2108. doi: 10.1038/s41598-024-81305-1. Sci Rep. 2025. PMID: 39814790 Free PMC article.
-
Denoising task-correlated head motion from motor-task fMRI data with multi-echo ICA.Imaging Neurosci (Camb). 2024;2:imag-2-00057. doi: 10.1162/imag_a_00057. Epub 2024 Jan 5. Imaging Neurosci (Camb). 2024. PMID: 39328846 Free PMC article.
-
Detecting Task Functional MRI Activation Using the Multiband Multiecho (MBME) Echo-Planar Imaging (EPI) Sequence.J Magn Reson Imaging. 2021 May;53(5):1366-1374. doi: 10.1002/jmri.27448. Epub 2020 Nov 19. J Magn Reson Imaging. 2021. PMID: 33210793 Free PMC article.
References
Publication types
MeSH terms
LinkOut - more resources
Full Text Sources
Other Literature Sources
Medical

