. 2018 Mar 24;69(7):1615-1633.
doi: 10.1093/jxb/ery015.

The Arabidopsis COPII components, AtSEC23A and AtSEC23D, are essential for pollen wall development and exine patterning

Affiliations

The Arabidopsis COPII components, AtSEC23A and AtSEC23D, are essential for pollen wall development and exine patterning

Mostafa Aboulela et al. J Exp Bot. .

Abstract

The specialized multilayered pollen wall plays multiple roles to ensure normal microspore development. The major components of the pollen wall (e.g. sporopollenin and lipidic precursors) are provided from the tapetum. Material export from the endoplasmic reticulum (ER) is mediated by coat protein complex II (COPII) vesicles. The Arabidopsis thaliana genome encodes seven homologs of SEC23, a COPII component. However, the functional importance of this diversity remains elusive. Here, we analyzed knockout and knockdown lines for AtSEC23A and AtSEC23D, two of the A. thaliana SEC23 homologs, respectively. Single atsec23a and atsec23d mutant plants, despite normal fertility, showed an impaired exine pattern. Double atsec23ad mutant plants were semi-sterile and exhibited developmental defects in pollen and tapetal cells. Pollen grains of atsec23ad had defective exine and intine, and showed signs of cell degeneration. Moreover, the development of tapetal cells was altered, with structural abnormalities in organelles. AtSEC23A and AtSEC23D exhibited the characteristic localization pattern of COPII proteins and were highly expressed in the tapetum. Our work suggests that AtSEC23A and AtSEC23D may organize pollen wall development and exine patterning by regulating ER export of lipids and proteins necessary for pollen wall formation. Also, our results shed light on the functional heterogeneity of SEC23 homologs.


Figures
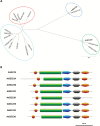
Fig. 1.
Fig. 1.
Phylogenetic and domain structure analyses of SEC23 homologs. (A) A phylogenetic tree of SEC23 homologs in plants (Arabidopsis thaliana and Oryza sativa), green algae (Chlamydomonas reinhardtii), mammals (Homo sapiens and Mus musculus), and yeast (Saccharomyces cerevisiae). Amino acid sequences were aligned using the Neighbor–Joining method and bootstrap values of 1000 replications by the ClustalW ver. 1.83 program (http://clustalw.ddbj.nig.ac.jp/). The tree was drawn by GENETYX-Tree software (Genetyx, Tokyo, Japan) based on the alignment. The scale bar demonstrates the evolutionary distance. Accession nos: AtSEC23A (A. thaliana, NP_567217), AtSEC23B (NP_563741), AtSEC23C (NP_179757), AtSEC23D (NP_565651), AtSEC23E (NP_189008), AtSEC23F (NP_193152), AtSEC23G (NP_568626), Os01g0321700 (O. sativa, XP_015621728), Os03g0742800 (AAR87299), Os04g0412900 (XP_015636882), Os05g0443300 (BAF17587), Os08g0474700 (XP_015650237), CrSEC23 (C. reinhardtii, XP_001702936), hSec23A (H. sapiens, CAA65774), hSec23B (CAA65775), MmSEC23A (M. musculus, NP_033173), MmSEC23B (NP_062761), and ScSEC23 (S. cerevisiae, NP_015507). (B) Structure of SEC23 domains in yeast and A. thaliana. The domains were predicted with the motif database Pfam (http://pfam.xfam.org/) and drawn using the image creator MyDomains (http://prosite.expasy.org/mydomains/). The five predicted domains are indicated as follows: circle, zinc finger; rectangle, trunk; pentagon, β-barrel; first hexagon, all-helical; and second hexagon, gelsolin-like.
Fig. 2.
Fig. 2.
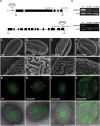
SEM analysis of pollen surface structures in the wild type (WT), atsec23a, atsec23d, and atsec23ad. (A) Schematic diagrams of AtSEC23A (upper) and AtSEC23D (lower) genes and T-DNA insertion sites. Black boxes, white boxes, and black solid lines represent the exons, untranslated regions, and introns, respectively. Triangles and arrows indicate the T-DNA insertions and positions of primers for RT-PCR analyses, respectively. (B) Expression analysis of AtSEC23A and AtSEC23D by RT-PCR in WT, atsec23a, atsec23d, and atsec23ad. Actin2 was used as an internal reference. (C–F) SEM images showing pollen surface structures of the WT (C), atsec23a (D), atsec23d (E), and atsec23ad (F). Lower panels indicate magnified images of the pollen surface structures in the upper panels. (G–J) Auramine O staining of the WT (G), atsec23a (H), atsec23d (I), and atsec23ad (J). Upper panels and lower panels show the fluorescence images of auramine O and merged images of the auramine O fluorescence and the bright field, respectively. Scale bars=10 µm (C–F; upper panels and G–J) and 3 µm (C–F; lower panels).
Fig. 3.
Fig. 3.
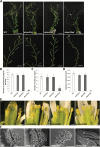
Fertility analysis of atsec23a, atsec23d, and atsec23ad. (A) Two-month-old WT, atsec23a, atsec23d, and atsec23ad. The arrow indicates one of the few seed-bearing siliques. The lower panels show a branch of each of the WT, atsec23a, atsec23d, and atsec23ad. (B–D) Seed and silique set analyses in atsec23a, atsec23d, and atsec23ad. The analyses include the number of seed-bearing siliques per plant (B; n=13), the number of seeds per silique (C; n=40), and the number of seeds per plant (D; n=10). Error bars indicate the SD. (E) Dissected flowers of atsec23a, atsec23d, and atsec23ad. Arrows show stigmas with or without pollen grains. (F) SEM micrographs of dehiscent anthers in the WT, atsec23a, atsec23d, and atsec23ad. Arrows indicate aggregates of collapsed pollen grains adhering to the anther wall. Scale bars=5 cm (A; upper panels), 2 cm (A; lower panels), 200 µm (E), and 100 µm (F).
Fig. 4.
Fig. 4.
Phenotypic analyses of WT, atsec23a, atsec23d, and atsec23ad pollen grains. (A–D) Alexander’s staining of WT (A), atsec23a (B), atsec23d (C), and atsec23ad pollen grains (D). (E–H) DAPI staining of mature pollen grains in the WT (E), atsec23a (F), atsec23d (G), and atsec23ad (H). Arrows and arrowheads indicate the few normally developed pollen grains with three nuclei and non-stained pollen grains, respectively. (I–M) Light microscopy images of pollen germination in the WT (I), atsec23a (J), atsec23d (K), atsec23a-compl. (L), and atsec23ad (M). (N) Pollen germination rate in the WT, atsec23a, atsec23d, and atsec23a-compl. Error bars indicate the SD. Scale bars=50 µm (A–D), 20 µm (E–H), and 200 µm (I–M).
Fig. 5.
Fig. 5.
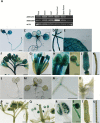
Expression patterns of AtSEC23A and AtSEC23D in A. thaliana. (A) RT-PCR analysis of AtSEC23A and AtSEC23D in root, stem, leaf, floral bud, open flower, and silique of the WT. Actin2 was monitored as an internal reference. (B–U) GUS staining of transgenic A. thaliana carrying PAtSEC23A:GUS (B–K) or PAtSEC23D:GUS (L–U). Five-day-old seedlings (B, L), 14-day-old seedlings (C, M), inflorescences (F, P), flowers (G, Q), anthers (H, R), germinated pollen grains (I, S), fertilized ovaries (J, T), and mature siliques (K, U). (D, E) and (N, O) are magnified images of the boxed areas in (C) and (M), respectively. The arrow in (Q) indicates germinated pollen grains on stigmatic papillae. Scale bars=1 mm (B, C, F, G, K, L, M, P, Q, and U), 200 µm (D, E, H, J, N, O, R, and T), and 20 µm (I and S).
Fig. 6.
Fig. 6.
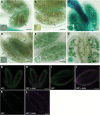
Detailed expression patterns of AtSEC23A and AtSEC23D in anthers. (A–F) GUS activity in the tapetum and pollen grains of transgenic A. thaliana carrying PAtSEC23A:GUS (A–C) or PAtSEC23D:GUS (D–F). GUS staining of anthers at uninucleate (A, D), bicellular (B, E), and tricellular stages (C, F). Insets are magnified images of pollen grains. Arrows indicate the tapetum. (G–J) GFP fluorescence in the tapetum at the uninucleate stage of transgenic A. thaliana carrying PAtSEC23A:AtSEC23A-G3GFP (G, H) or PAtSEC23D:AtSEC23D-G3GFP (I, J). (G–L) GFP fluorescence in the tapetum at the uninucleate stage of transgenic A. thaliana carrying PAtSEC23A:AtSEC23A-G3GFP (G, H) or PAtSEC23D:AtSEC23D-G3GFP (I, J), and the WT as a reference (K, L). GFP, signal of G3GFP; Auto, autofluorescence of chlorophyll. Scale bars=40 µm.
Fig. 7.
Fig. 7.
Intracellular localization of AtSEC23A and AtSEC23D in N. benthamiana leaf epidermal cells. (A) Fluorescent images of an epidermal cell co-expressing AtSEC23D–G3GFP and AtSEC23A–TagRFP. (B, C) Fluorescent images of epidermal cells co-expressing AtSEC23A–G3GFP (B) or AtSEC23D–G3GFP (C) with the ERES marker AtSEC24A–TagRFP. Arrowheads indicate ERESs. Scale bars=20 µm.
Fig. 8.
Fig. 8.
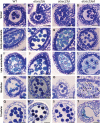
Semi-thin sections of anthers at different developmental stages. Sections of anthers at tetrad (A–D), early uninucleate (E–H), late uninucleate (I–L), bicellular (M–P), and tricellular stages (Q–T). Arrowheads and arrows indicate microspores with detached pollen walls and without pollen walls, respectively. Ta, tapetum; TR, tapetum residue; V, vacuole. Scale bars=30 µm.
Fig. 9.
Fig. 9.
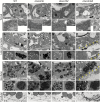
TEM micrographs of microspores at different developmental stages. (A–D) Ultrastructure of microspores at the tetrad stage. Arrowheads and arrows label the primexine and protecta, respectively. (E–H) Ultrastructure of microspores at the late uninucleate stage. (I–L) Ultrastructure of pollen grains at the bicellular stage. A star, arrows, and arrowheads indicate a naked microspore with no walls, plastids with abnormal morphology, and mitochondria, respectively. (M–P) Ultrastructure of pollen grains at the tricellular stage. Arrowheads show the irregular electron-lucent structures in the pollen coat of atsec23ad. Lower panels are magnifications of pollen surface structures in the upper panels. Ba, baculum; CP, collapsed pollen grains; CW, callose wall; En, endodermis; Ep, epidermis; GC, generative cell; In, intine; Lo, locule; Msp, microspore; N, nucleus; Ne, nexine; Ne-L, nexine-like structure; P, plastid; PC, pollen coat; Rm, remnants of pollen materials; SA, sporopollenin-like aggregations; Ta, tapetum; Te, tectum; TR, tapetum residue; V, vacuole; VN, vegetative nucleus. Scale bars=5 µm in upper panels, and 2 µm in lower panels.
Fig. 10.
Fig. 10.
TEM micrographs of tapetal cells and their organelles in WT, atsec23a, atsec23d, and atsec23ad. (A–D) Ultrastructure of tapetal cells at the tetrad stage. The left side of the lower panels in (A–D) shows magnified images of the ER. The right side of the lower panels indicates magnified images of the Golgi in (A–C) or Golgi (top) and clusters of the tiny vesicles (bottom) in (D). (E–H) Ultrastructure of tapetal cells at the late uninucleate stage. Left and right sides of the lower panels in (E–G) show magnified images of the labeled elaioplasts and tapetosomes in the upper panels, respectively. Left and right sides of the lower panels in (H) indicate magnified images of the labeled proplastid (precursor of elaioplast) and sporopollenin-like aggregations on the middle layer that faces the tapetum in the upper panels, respectively. (I–L) Ultrastructure of tapetal cells at the bicellular stage. Left and right sides of the lower panels show magnified images of the labeled elaioplasts and tapetosomes in the upper panels, respectively. (M–P) Ultrastructure of anthers at the tricellular stage. Arrows indicate the sporopollenin-like aggregations on the locule wall. El, elaioplast; En, endodermis; Ep, epidermis; Lo, locule; ML, middle layer; N, nucleus; Pp, proplastid; Rm, remnants of pollen materials; SA, sporopollenin-like aggregations; T, tapetosome; Ta, tapetum; TR, tapetum residue; V, vacuole. Scale bars=2 µm (A–D and I–L; upper panels), 250 nm (A–D; lower panels), 1 µm (E–H), and 10 µm (M–P).

References

    1. Aarts MG, Hodge R, Kalantidis K, Florack D, Wilson ZA, Mulligan BJ, Stiekema WJ, Scott R, Pereira A. 1997. The Arabidopsis MALE STERILITY 2 protein shares similarity with reductases in elongation/condensation complexes. The Plant Journal 12, 615–623. - PubMed
    1. Aboulela M, Tanaka Y, Nishimura K, Mano S, Nishimura M, Ishiguro S, Kimura T, Nakagawa T. 2017. Development of an R4 dual-site (R4DS) gateway cloning system enabling the efficient simultaneous cloning of two desired sets of promoters and open reading frames in a binary vector for plant research. PLoS One 12, e0177889. - PMC - PubMed
    1. Alexander MP. 1969. Differential staining of aborted and nonaborted pollen. Stain Technology 44, 117–122. - PubMed
    1. Alonso JM, Stepanova AN, Leisse TJ et al. . 2003. Genome-wide insertional mutagenesis of Arabidopsis thaliana. Science 301, 653–657. - PubMed
    1. Andersson MX, Goksör M, Sandelius AS. 2007. Membrane contact sites: physical attachment between chloroplasts and endoplasmic reticulum revealed by optical manipulation. Plant Signaling and Behavior 2, 185–187. - PMC - PubMed

Publication types