

doi: 10.1121/1.5020787.
Distribution of spectral modulation transfer functions in a young, normal-hearing population
Affiliations
- PMID: 29390785
- PMCID: PMC5777922
- DOI: 10.1121/1.5020787
Item in Clipboard
Distribution of spectral modulation transfer functions in a young, normal-hearing population
J Acoust Soc Am.
2018 Jan.
Abstract
Spectral modulation transfer functions (SMTFs) were measured in 49 young (18-35 years of age) normal-hearing listeners. Noise carriers spanned six octaves from 200 to 12 800 Hz. Sinusoidal (on a log-amplitude scale) spectral modulation with random starting phase was superimposed on the carrier at spectral modulation frequencies of 0.25, 0.5, 1.0, 2.0, 4.0, and 8.0 cycles/octave. Modulation detection thresholds (in dB) yielded SMTFs that were bandpass in nature, consistent with previous investigations reporting data for only a few subjects. Thresholds were notably consistent across subjects despite minimal practice. Population statistics are reported that may serve as reference data for future studies.
Figures
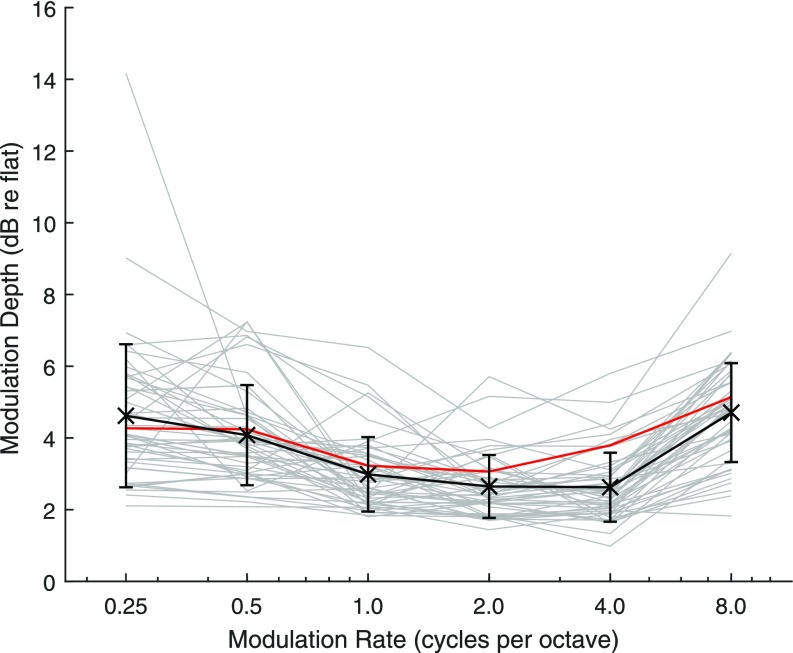
(Color online) Spectral modulation detection thresholds in dB relative to a flat spectrum used in the standard stimulus as a function of spectral modulation frequency (cycles per octave). (Top) Thin lines depict individual data for 50 listeners with normal hearing. A single older listener (age: 56 yr) is depicted in red. The solid black line shows mean and standard deviation. (Bottom) Median and centile ranges are shown for the normative data. The dark shaded region shows the interquartile range and the light shaded region shows 5%–95%, indicating the limits of normal performance.
References
Publication types
MeSH terms
Grants and funding
LinkOut - more resources
Full Text Sources
Other Literature Sources
Miscellaneous