. 2018 Feb 1;8(1):2183.
doi: 10.1038/s41598-018-20141-6.

The mechanistic link between health and gut microbiota diversity

Affiliations

The mechanistic link between health and gut microbiota diversity

Olaf F A Larsen et al. Sci Rep. .

Abstract

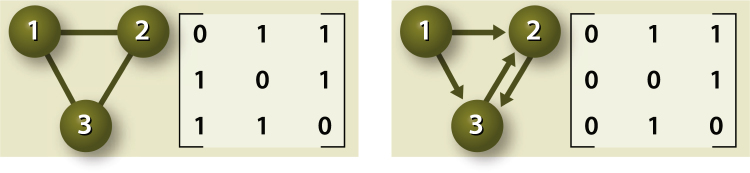
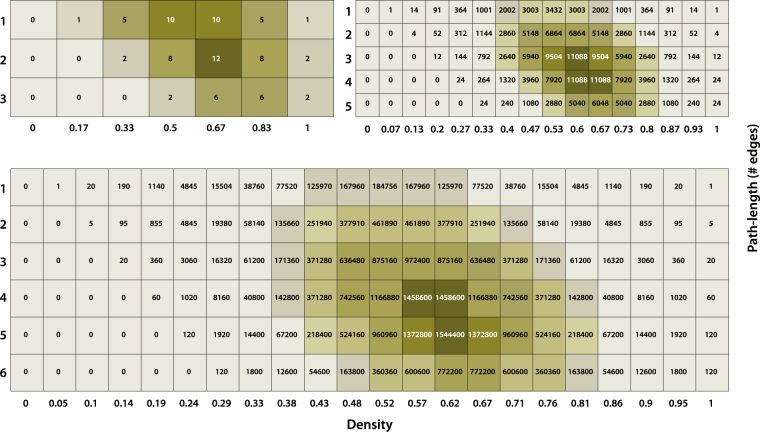
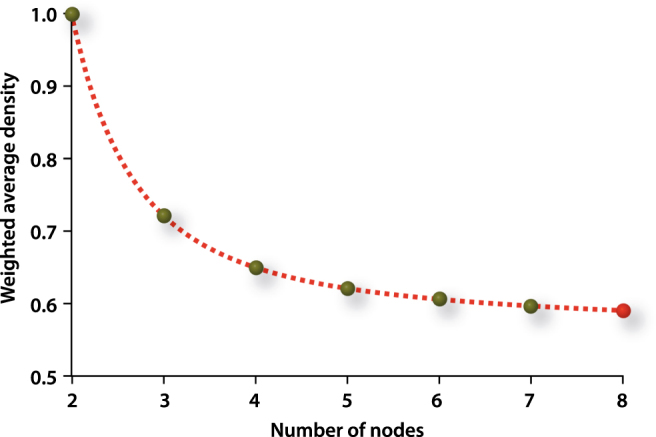
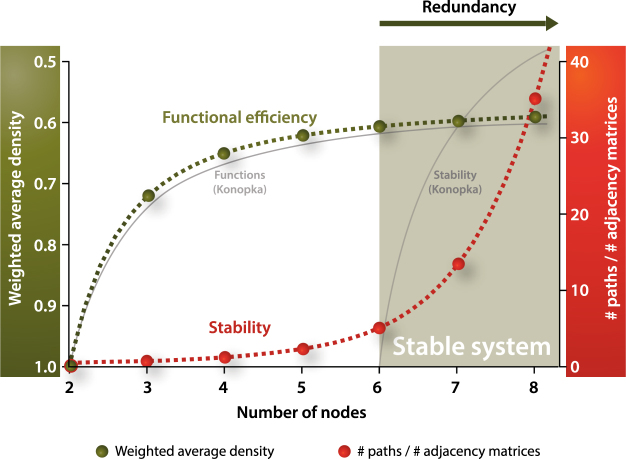
Although numerous reports link a decreased diversity of the gut microbiota to a declined health status, to date no mechanistic motivation for this exists. Here, we show by applying first principles basic graph theory on small networks that higher diversity within such a network indeed leads to more efficient systems and redundancy. Our results quantitatively support earlier hypothetical considerations on gut microbiota richness with respect to these parameters. Our simulations show that higher species diversity leads to higher resilience within small microbiological ecosystems, like being present in the gut microbiota. This notion should provide an ingredient when developing new interventional strategies within the domain of microbiota management.


Conflict of interest statement

O.L. is also Science Manager at Yakult Nederland B.V.E.C. is, in a non-conflicted way pertaining to this study, chairman of the SAB of Christian Hansen (Denmark), the PAB of Pfizer Consumer Health (USA), advisor to Yakult Nederland B.V. and Winclove Probiotics B.V. (Netherlands).

Figures

Figure 1
Figure 1
Schematic representations of two systems comprising three microbial species. The circles (“nodes”) represent the three species, whereas the lines (“edges”) represent the signalling connections between the species. In the left panel, the signals are undirected. As such, the presence or absence of an edge between two species simply represents communication or no communication at all between the respective species. In the right panel, the edges are directed. In this example, species 1 can exert a signal to species 2 and 3. Species 2, however, cannot exert a signal to species 1, but can exert a signal to species 3, and species 3 can again exert a signal to species 2. For each graphical representation, the respective adjacency matrix is given as well, with both row- and column-numbers representing nodes 1, 2 and 3, respectively. Each matrix element represents either a connection (“1”) or no connection (“0”) between the species. As an example, for the left adjacency matrix, elements (1, 2) and (2, 1) indicate a connection between species 1 and 2. The right adjacency matrix indicates that there is a signal going from species 1 to species 2, element (1, 2), but there is no signalling “back” possible from species 2 to species 1, element (2, 1). In our simulations, no connection of a species with itself is possible, hence the diagonal elements are all zero. In the case of undirected edges, the matrix is obviously symmetric (left example).
Figure 2
Figure 2
Heatmaps displaying the landscapes of paths with respect to density and path-length. The matrices represent the number of paths possible for configurations of respectively 4 nodes (top left), 6 nodes (top right), and 7 nodes (bottom), when going from node 1 to node n, as function of density (x-axis) and path-length (y-axis). For 7 nodes, the highest numbers of paths possible are centred around a density of 0.62 with path-lengths around 4 to 5.
Figure 3
Figure 3
Weighted average density as function of number of nodes. Red dot: not calculated, but obtained from extrapolation using a fit of the calculated data-points. The fit (dotted line, r > 0.999) is added as a guide to the eye.
Figure 4
Figure 4
Graphical summary of our findings (adapted from Konopka). Green: weighted average density reflecting functional efficiency. Red: number of paths divided by the number of adjacency matrices, reflecting stability. Grey: trends as proposed earlier by Konopka.

References

    1. Cho I, Blaser MJ. The human microbiome: at the interface of health and disease. Nat. Rev. Genet. 2012;13:260–270. - PMC - PubMed
    1. Tillisch K, et al. Consumption of fermented milk product with probiotic modulates brain activity. Gastroenterology. 2013;144:1394–1401. doi: 10.1053/j.gastro.2013.02.043. - DOI - PMC - PubMed
    1. Van Nood E, et al. Duodenal infusion of donor feces for recurrent Clostridium difficile. N. Engl. J. Med. 2013;368:407–415. doi: 10.1056/NEJMoa1205037. - DOI - PubMed
    1. Sender R, Fuchs S, Milo R. Revised estimates for the number of human and bacteria cells in the body. PLoS Biol. 2016;14:e1002533. doi: 10.1371/journal.pbio.1002533. - DOI - PMC - PubMed
    1. Sung J, et al. Global metabolic interaction network of the human gut microbiota for context-specific community-scale analysis. Nat. Commun. 2017;8:15393. doi: 10.1038/ncomms15393. - DOI - PMC - PubMed

LinkOut - more resources