. 2018 Feb 1;8(1):2062.
doi: 10.1038/s41598-018-20428-8.

Deep brain stimulation induces sparse distributions of locally modulated neuronal activity

Affiliations

Deep brain stimulation induces sparse distributions of locally modulated neuronal activity

YiZi Xiao et al. Sci Rep. .

Abstract

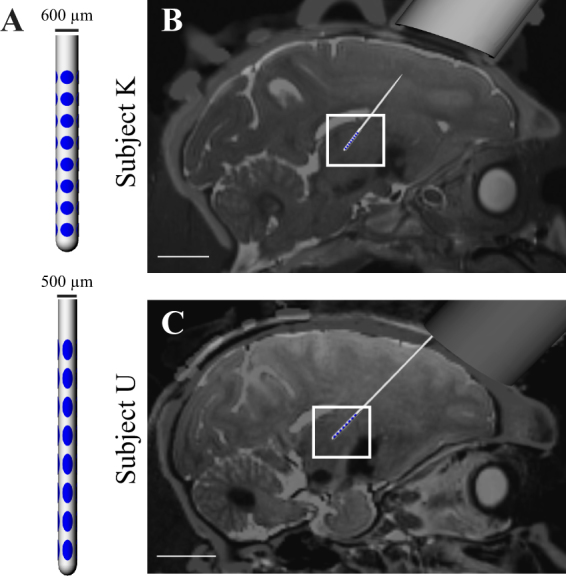
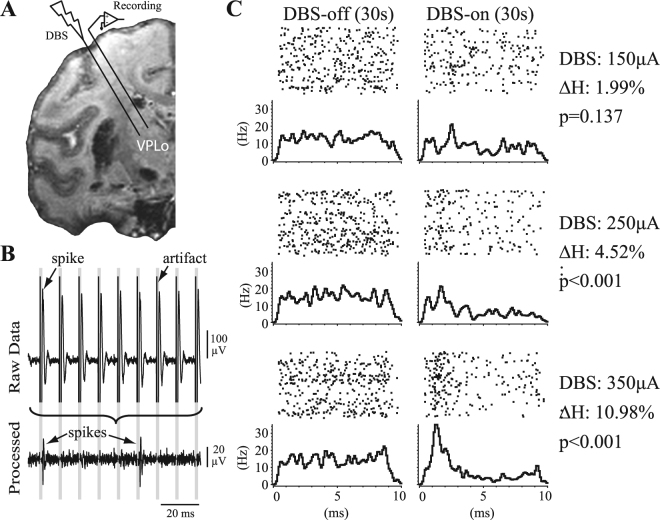
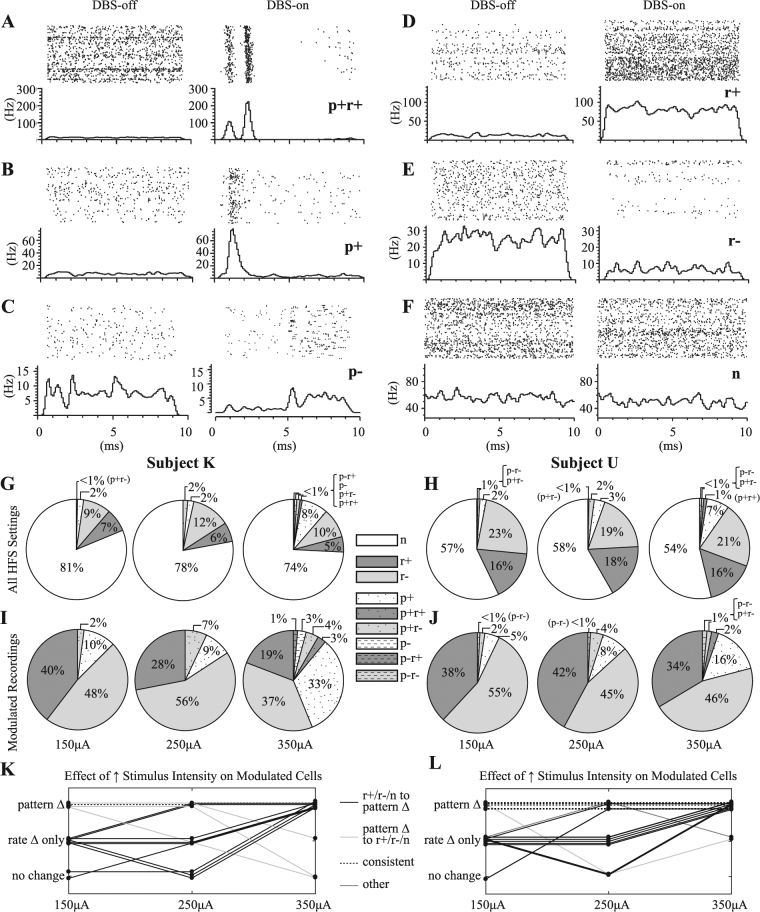
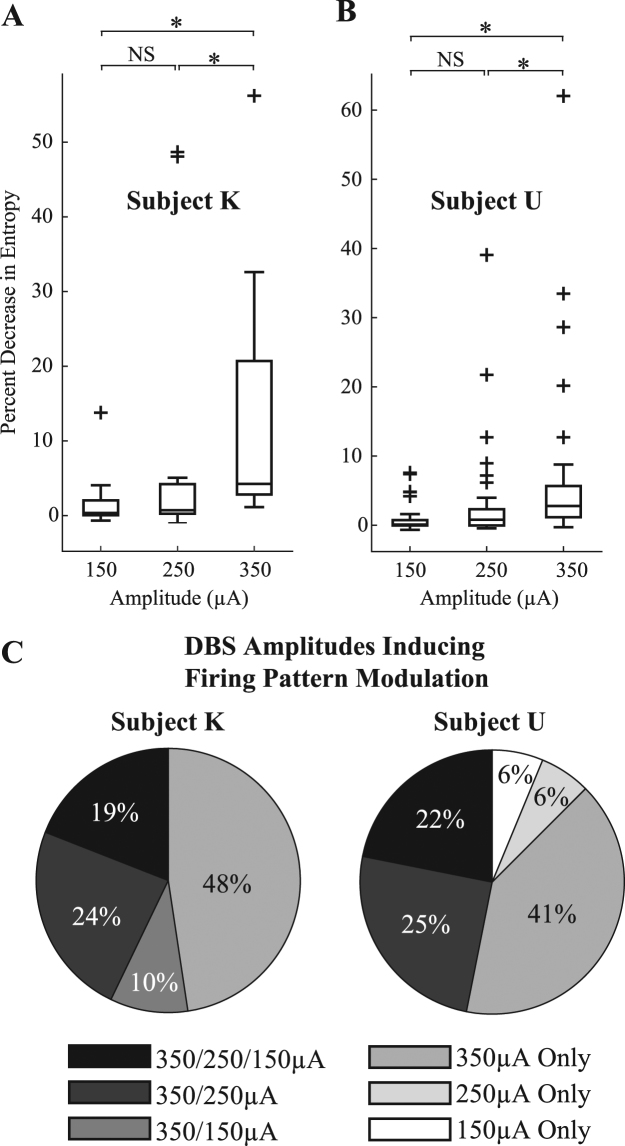
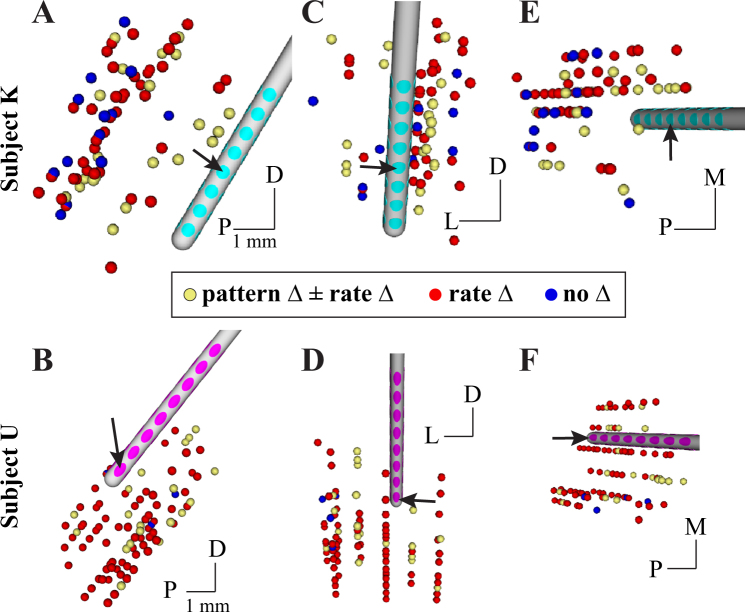
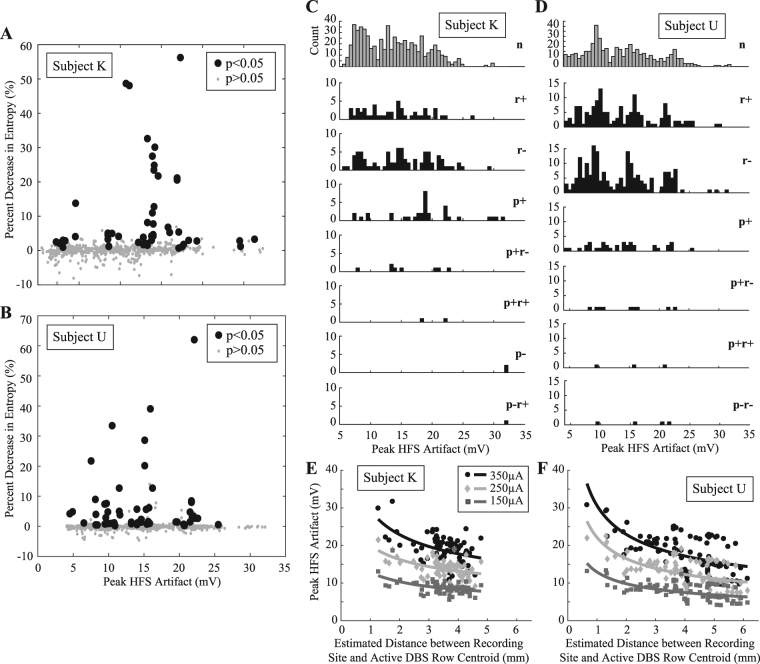
Deep brain stimulation (DBS) therapy is a potent tool for treating a range of brain disorders. High frequency stimulation (HFS) patterns used in DBS therapy are known to modulate neuronal spike rates and patterns in the stimulated nucleus; however, the spatial distribution of these modulated responses are not well understood. Computational models suggest that HFS modulates a volume of tissue spatially concentrated around the active electrode. Here, we tested this theory by investigating modulation of spike rates and patterns in non-human primate motor thalamus while stimulating the cerebellar-receiving area of motor thalamus, the primary DBS target for treating Essential Tremor. HFS inhibited spike activity in the majority of recorded cells, but increasing stimulation amplitude also shifted the response to a greater degree of spike pattern modulation. Modulated responses in both categories exhibited a sparse and long-range spatial distribution within motor thalamus, suggesting that stimulation preferentially affects afferent and efferent axonal processes traversing near the active electrode and that the resulting modulated volume strongly depends on the local connectome of these axonal processes. Such findings have important implications for current clinical efforts building predictive computational models of DBS therapy, developing directional DBS lead technology, and formulating closed-loop DBS strategies.


Conflict of interest statement

The authors declare that they have no competing interests.

Figures

Figure 1
Figure 1
DBS Array Implants. (A) DBS arrays implantated in the cerebellar-receiving area of motor thalamus. (B,C) Co-registration of pre-operative T2-weighted MRI and post-implant CT images showing the final DBS array position and orientation in each subject. 1-cm scale bars are shown in (B,C).
Figure 2
Figure 2
Single-unit spike recording analysis in the context of VPLo-HFS. (A) Microelectrode recordings were performed in the cerebellar receiving area of thalamus (VPLo) while stimulating in the same thalamic nucleus. (B) Recording artifacts were template-subtracted, with stimulation times used to generate peristimulus time histograms (PSTHs) of spike activity. Spike depolarization is shown as a negative polarity. (C) PSTHs from a recorded neuron before and during HFS at three different stimulation amplitudes. ΔH is the percentage decrease in PSTH entropy between the HFS-off and HFS-on states. The p value indicates the likelihood of the observed PSTH entropy during HFS to occur by chance.
Figure 3
Figure 3
Heterogeneity of thalamic PSTH responses to VPLo-HFS with increasing stimulation amplitude. (AF) Representative examples of the following classes of responses (p: firing pattern modulation, r: firing rate modulation. ‘+’: increase in firing rate or phase-locked spike activity, ‘−’: decrease in firing rate or phase-locked spike activity, n: no response). (G–J) Dependence of stimulation amplitude on motor thalamic neuronal responses to VPLo-HFS. Data from Subject K and Subject U are on the left and right side of the legend, respectively. The top row shows the proportionate effects of HFS at 150, 250, and 350 μA across all recordings (Subject K: n = 245, Subject U: n = 283), whereas the bottom row shows the corresponding percentages only for those recordings that were significantly modulated by HFS (i.e. firing pattern or rate modulation). (K,L) Effect of stimulus amplitude on all cells exhibiting one or more instances of firing pattern modulation (n = 11 cells in Subject K, n = 21 cells in Subject U).
Figure 4
Figure 4
Effect of HFS amplitude on PSTH entropy change and firing pattern modulation. (A,B) Shown are population-based entropy changes in those cells with at least one significant entropy change amongst the three stimulus amplitudes. NS: no significant difference by multiple comparison test. *Significant difference by Mann-Whitney U test with Bonferroni correction (α = 0.0167, FPM cells: Subject K, n = 21 recordings; Subject U, n = 32 recordings). (C) Likelihood of firing pattern modulation to occur across the three different stimulus amplitudes.
Figure 5
Figure 5
Distribution of modulated motor thalamic activity with respect to microdrive-defined recording site location. Recording location sphere colors correspond to whether no modulation was observed for any stimulus setting (blue), only a change in firing rate was observed (red), and if a firing pattern change was observed regardless of whether or not a rate change was also observed (yellow). Perspectives are shown for sagittal (A,B) coronal (C,D) and axial (E,F) perspectives in both subjects. D: dorsal; P: posterior; L: lateral; M: medial. Scale bars indicates 1-mm.
Figure 6
Figure 6
Distribution of modulated motor thalamic activity with respect to stimulation artifact size. Percent decrease in PSTH entropy between the HFS-off and HFS-on periods plotted against the peak amplitude of the recorded HFS artifact for (A) Subject K and (B) Subject U. Recordings that exhibited significant firing pattern modulation during HFS are labeled as large black solid circles. (C,D) Spatial distribution of neuronal recordings grouped by their response to HFS (p: firing pattern modulation, r: firing rate modulation. ‘+’: increase in firing rate or phase-locked spike activity, ‘−’: decrease in firing rate or phase-locked spike activity, n: no response). (E,F) Relationship between the stimulus artifact peak amplitude and the estimated recording site distance from the centroid point of the active DBS row. Shown are data for both subjects categorized based on stimulus amplitude (150, 250, and 350 µA).

References

    1. Agnesi F, Connolly AT, Baker KB, Vitek JL, Johnson MD. Deep brain stimulation imposes complex informational lesions. PloS one. 2013;8:e74462. doi: 10.1371/journal.pone.0074462. - DOI - PMC - PubMed
    1. Grill WM, Snyder AN, Miocinovic S. Deep brain stimulation creates an informational lesion of the stimulated nucleus. Neuroreport. 2004;15:1137–1140. doi: 10.1097/00001756-200405190-00011. - DOI - PubMed
    1. Chiken S, Nambu A. High-frequency pallidal stimulation disrupts information flow through the pallidum by GABAergic inhibition. The Journal of neuroscience: the official journal of the Society for Neuroscience. 2013;33:2268–2280. doi: 10.1523/JNEUROSCI.4144-11.2013. - DOI - PMC - PubMed
    1. Filali M, Hutchison WD, Palter VN, Lozano AM, Dostrovsky JO. Stimulation-induced inhibition of neuronal firing in human subthalamic nucleus. Experimental brain research. Experimentelle Hirnforschung. 2004;156:274–281. doi: 10.1007/s00221-003-1784-y. - DOI - PubMed
    1. Boraud T, Bezard E, Bioulac B, Gross C. High frequency stimulation of the internal Globus Pallidus (GPi) simultaneously improves parkinsonian symptoms and reduces the firing frequency of GPi neurons in the MPTP-treated monkey. Neurosci Lett. 1996;215:17–20. doi: 10.1016/S0304-3940(96)12943-8. - DOI - PubMed

Publication types

LinkOut - more resources