

Evaluation of type 2 diabetic mellitus animal models via interactions between insulin and mitogen‑activated protein kinase signaling pathways induced by a high fat and sugar diet and streptozotocin
- PMID: 29393432
- PMCID: PMC5865978
- DOI: 10.3892/mmr.2018.8504
Evaluation of type 2 diabetic mellitus animal models via interactions between insulin and mitogen‑activated protein kinase signaling pathways induced by a high fat and sugar diet and streptozotocin
Abstract
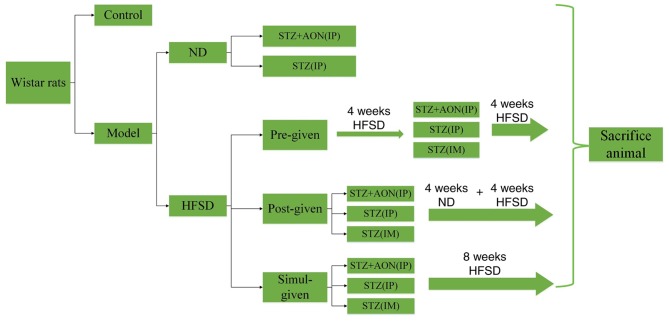
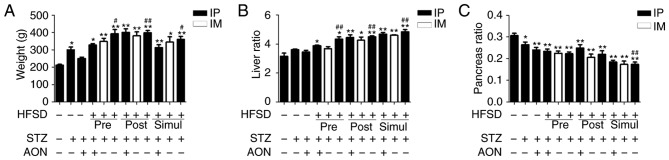
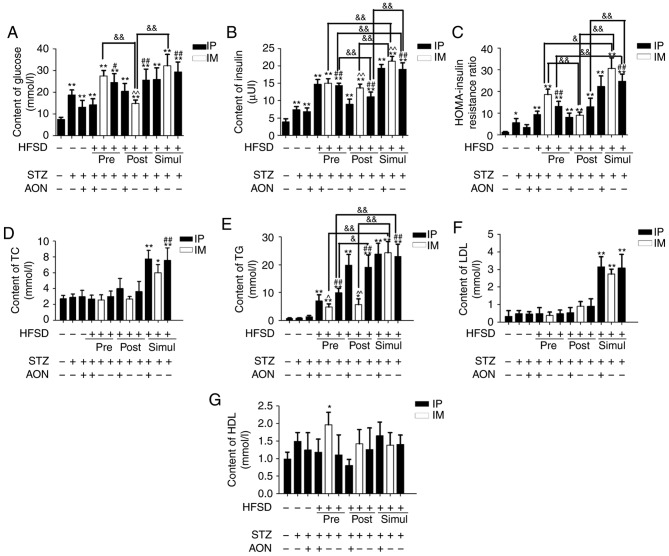
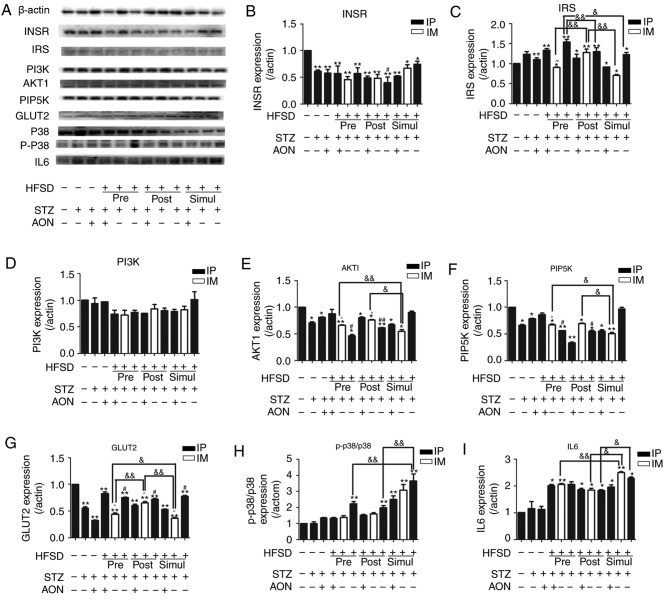
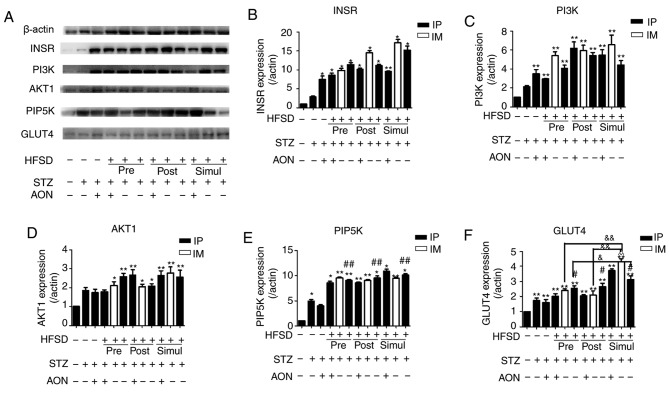
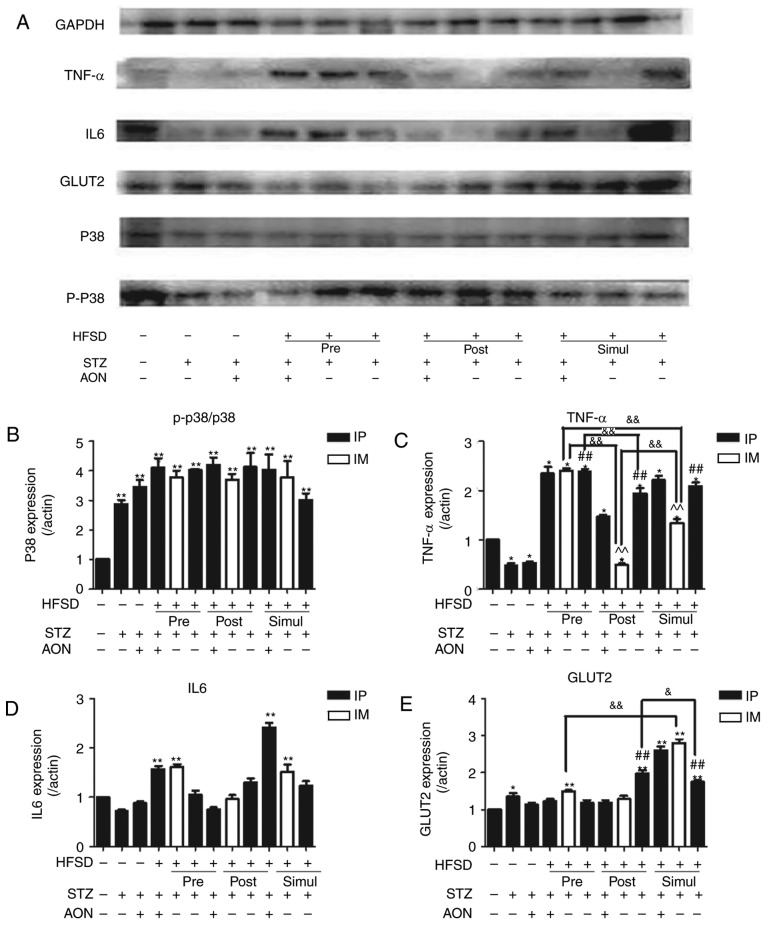
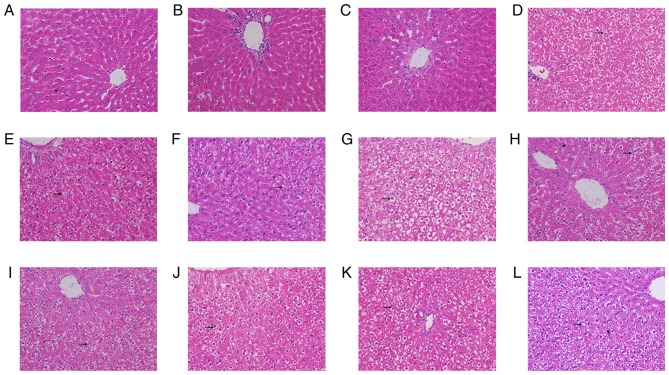
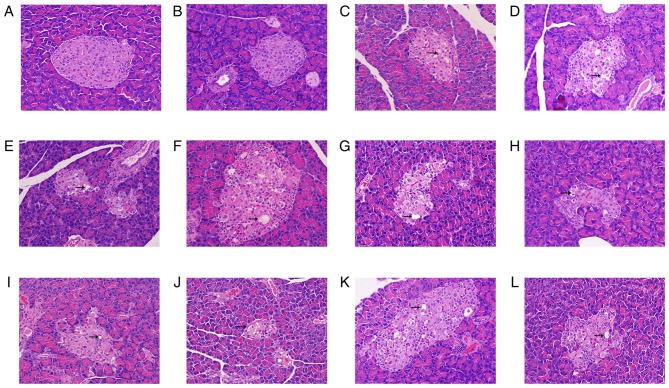
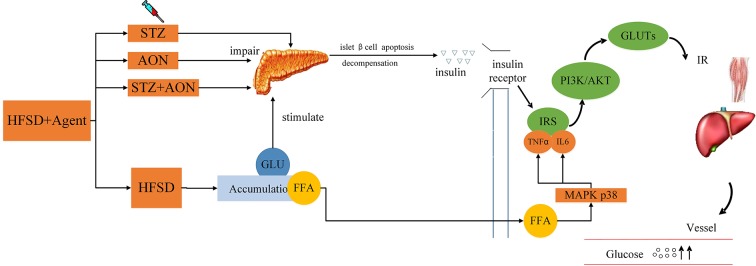
Type 2 diabetic mellitus (T2DM), which is characterized by insulin resistance (IR), hyperglycemia and hyperlipidemia, is a comprehensive dysfunction of metabolism. The insulin receptor (INSR)/phosphoinositide 3‑kinase (PI3K)/AKT signaling pathway is well acknowledged as a predominant pathway associated with glucose uptake; however, the effect of streptozotocin (STZ) plus a high fat and sugar diet (HFSD) on the proteins associated with this pathway requires further elucidation. In order to explore this effect, a T2DM rat model was constructed to investigate T2DM pathogenesis and potential therapeutic advantages. Rats were randomly divided into control and model groups, including normal diet (ND) and HFSD types. ND types were administered intraperitoneal (IP) injections of STZ (35 mg/kg) or a combination of STZ and alloxan monohydrate (AON) (40 mg/kg), whereas HFSD types were composed of HFSD pre‑given, post‑given and simul‑given groups, and were modeled as follows: IP or intramuscular (IM) injection of STZ (35 mg/kg) or a combination of STZ and AON (40 mg/kg). Results indicated that, compared with controls, blood glucose, insulin, homeostatic model assessment‑insulin resistance and total triglyceride were significantly elevated in groups with HFSD and modeling agents (P<0.05 or P<0.01), whereas total cholesterol and low‑density lipoprotein levels were significantly elevated in groups simultaneously administered HFSD and modeling agents (P<0.05 or P<0.01), in addition to downregulation of the expression of insulin signaling pathway proteins in the liver, including INSR, PI3K, AKT1, phosphatidylinositol-5-phosphate 4‑kinase type‑2α (PIP5Kα) and glucose transporter (GLUT)2, and increased expression of inflammatory factors, including p38, tumor necrosis factor (TNF)α and interleukin (IL)6. Furthermore, compared with other two HFSD types including pre‑given and post‑given group, the simul‑given group that received IM injection with STZ exhibited decreased expression levels of major insulin signal pathway proteins INSR, PI3K, AKT1, PIP5Kα, GLUT2 or GLUT4 in the liver and pancreas (P<0.05 or P<0.01), whereas the opposite was observed in the skeletal muscle. In addition, the protein expression levels of phosphorylated‑p38, p38, IL6 and TNFα in the simul‑given group that received IM injection with STZ were increased (P<0.05 or P<0.01), and histopathology also indicated inflammation in pancreas and liver. The present findings suggest that a low dose of STZ may partially impair the β cells of the pancreas, whereas long‑term excess intake of HFSD may increase lipid metabolites, inhibit the insulin signaling pathway and activate the mitogen‑activated protein kinase p38 signaling pathway. The combined action of STZ and AON may result in insulin resistance, which ultimately results in abnormalities in glucose and lipid metabolism. The present model, analogue to T2DM onset of humans, evaluated the medical effect on metabolic dysfunction and provides an insight into the underlining mechanism of IR.
Keywords: type 2 diabetic mellitus; insulin resistance; mitogen activated protein kinase; insulin signal pathway; protein expression.
Figures
Similar articles
-
Scutellariae Radix and Coptidis Rhizoma Improve Glucose and Lipid Metabolism in T2DM Rats via Regulation of the Metabolic Profiling and MAPK/PI3K/Akt Signaling Pathway.Int J Mol Sci. 2018 Nov 18;19(11):3634. doi: 10.3390/ijms19113634. Int J Mol Sci. 2018. PMID: 30453687 Free PMC article.
-
[Effects of acute and chronic exercise on fat PI3K/AKT/GLUT4 signal pathway in type 2 diabetic rats].Zhongguo Ying Yong Sheng Li Xue Za Zhi. 2020 Jan 28;36(1):12-16. doi: 10.12047/j.cjap.5802.2020.003. Zhongguo Ying Yong Sheng Li Xue Za Zhi. 2020. PMID: 32476367 Chinese.
-
Eugenosedin-A improves glucose metabolism and inhibits MAPKs expression in streptozotocin/nicotinamide-induced diabetic rats.Kaohsiung J Med Sci. 2018 Mar;34(3):142-149. doi: 10.1016/j.kjms.2017.11.003. Epub 2017 Nov 29. Kaohsiung J Med Sci. 2018. PMID: 29475461 Free PMC article.
-
Treatment of diabetes with vanadium salts: general overview and amelioration of nutritionally induced diabetes in the Psammomys obesus gerbil.Diabetes Metab Res Rev. 2001 Jan-Feb;17(1):55-66. doi: 10.1002/1520-7560(2000)9999:9999<::aid-dmrr165>3.0.co;2-j. Diabetes Metab Res Rev. 2001. PMID: 11241892 Review.
-
The PI3K/Akt signaling axis and type 2 diabetes mellitus (T2DM): From mechanistic insights into possible therapeutic targets.Cell Biol Int. 2024 Aug;48(8):1049-1068. doi: 10.1002/cbin.12189. Epub 2024 May 29. Cell Biol Int. 2024. PMID: 38812089 Review.
Cited by
-
Ficus deltoidea extract down-regulates protein tyrosine phosphatase 1B expression in a rat model of type 2 diabetes mellitus: a new insight into its antidiabetic mechanism.J Nutr Sci. 2020 Jan 20;9:e2. doi: 10.1017/jns.2019.40. J Nutr Sci. 2020. PMID: 32042410 Free PMC article.
-
Agriophyllum Oligosaccharides Ameliorate Diabetic Insulin Resistance Through INS-R/IRS/Glut4-Mediated Insulin Pathway in db/db Mice and MIN6 Cells.Front Pharmacol. 2021 Aug 23;12:656220. doi: 10.3389/fphar.2021.656220. eCollection 2021. Front Pharmacol. 2021. PMID: 34497509 Free PMC article.
-
Effects of the amount and type of carbohydrates used in type 2 diabetes diets in animal models: A systematic review.PLoS One. 2020 Jun 12;15(6):e0233364. doi: 10.1371/journal.pone.0233364. eCollection 2020. PLoS One. 2020. PMID: 32530969 Free PMC article.
-
Exogenous Hydrogen Sulfide Ameliorates Diabetic Myocardial Fibrosis by Inhibiting Cell Aging Through SIRT6/AMPK Autophagy.Front Pharmacol. 2020 Jul 31;11:1150. doi: 10.3389/fphar.2020.01150. eCollection 2020. Front Pharmacol. 2020. PMID: 32903815 Free PMC article.
-
Embryonic stem cell-derived exosomes inhibit doxorubicin-induced TLR4-NLRP3-mediated cell death-pyroptosis.Am J Physiol Heart Circ Physiol. 2019 Aug 1;317(2):H460-H471. doi: 10.1152/ajpheart.00056.2019. Epub 2019 Jun 7. Am J Physiol Heart Circ Physiol. 2019. PMID: 31172809 Free PMC article.
References
-
- Chang WC, Wu JS, Chen CW, Kuo PL, Chien HM, Wang YT, Shen SC. Protective effect of vanillic acid against hyperinsulinemia, hyperglycemia and hyperlipidemia via alleviating hepatic insulin resistance and inflammation in high-fat diet (HFD)-Fed rats. Nutrients. 2015;7:9946–9959. doi: 10.3390/nu7125514. - DOI - PMC - PubMed
-
- Global Burden of Disease Study 2013 Collaborators: Global, regional, and national incidence, prevalence, and years lived with disability for 301 acute and chronic diseases and injuries in 188 countries, 1990–2013: A systematic analysis for the Global Burden of Disease Study 2013. Lancet. 2015;386:743–800. doi: 10.1016/S0140-6736(15)60692-4. - DOI - PMC - PubMed
-
- Qian J, Thomas AP, Schroeder AM, Rakshit K, Colwell CS, Matveyenko AV. Development of diabetes does not alter behavioral and molecular circadian rhythms in a transgenic rat model of type 2 diabetes mellitus. Am J Physiol Endocrinol Metab. 2017;313:E213–E221. doi: 10.1152/ajpendo.00406.2016. - DOI - PMC - PubMed
MeSH terms
Substances
LinkOut - more resources
Full Text Sources
Other Literature Sources
Medical
Miscellaneous
