. 2018 Apr;28(4):251-268.
doi: 10.1002/hipo.22832. Epub 2018 Feb 12.

CA1 pyramidal neuron gene expression mosaics in the Ts65Dn murine model of Down syndrome and Alzheimer's disease following maternal choline supplementation

Affiliations

CA1 pyramidal neuron gene expression mosaics in the Ts65Dn murine model of Down syndrome and Alzheimer's disease following maternal choline supplementation

Melissa J Alldred et al. Hippocampus. 2018 Apr.

Abstract

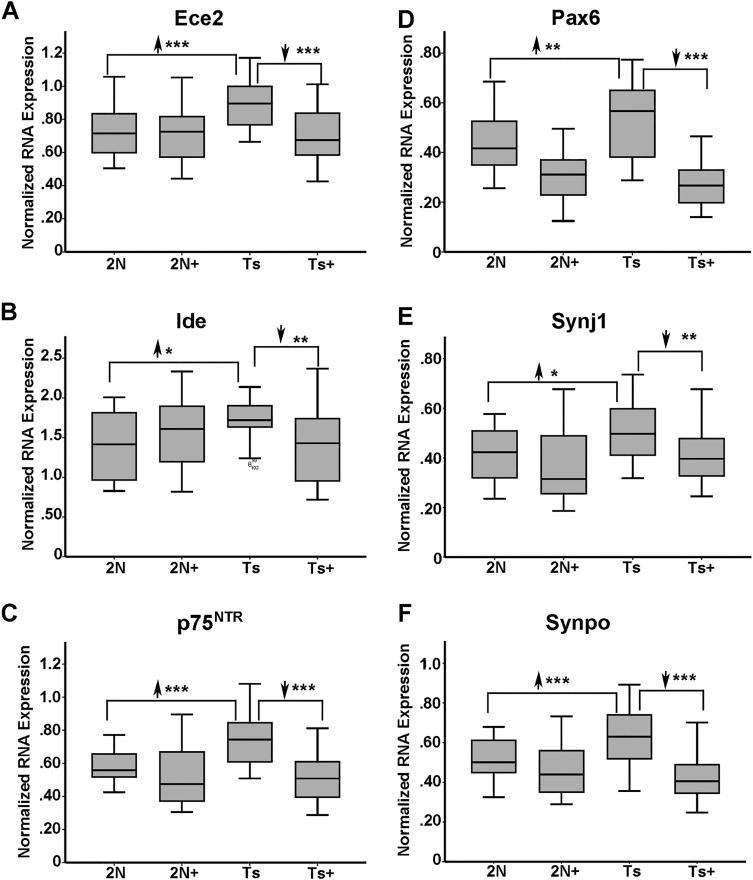
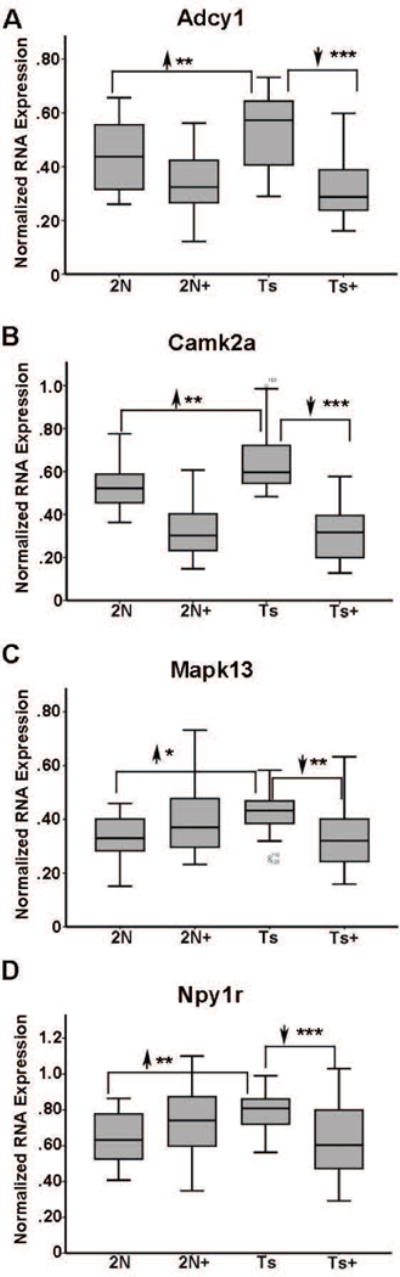
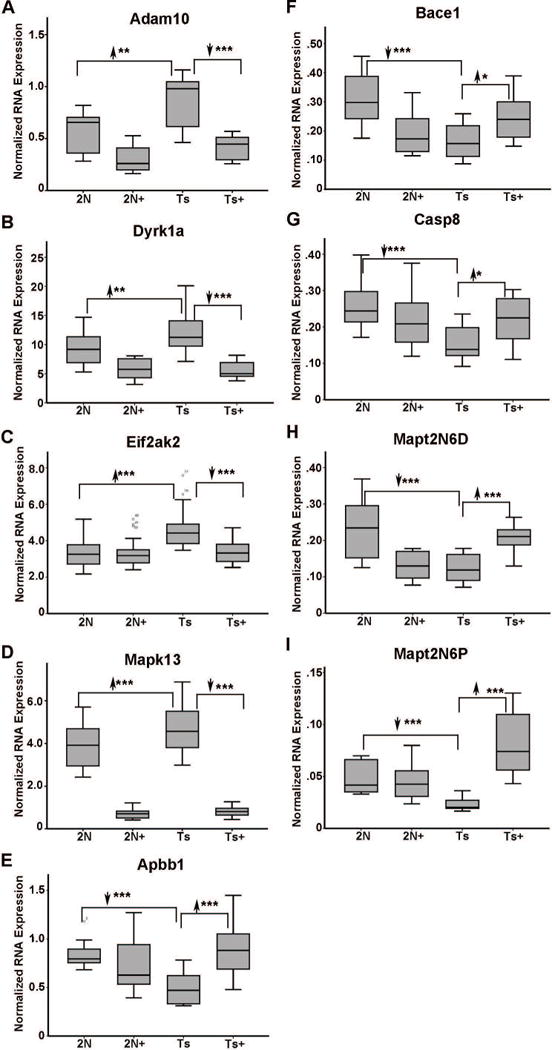
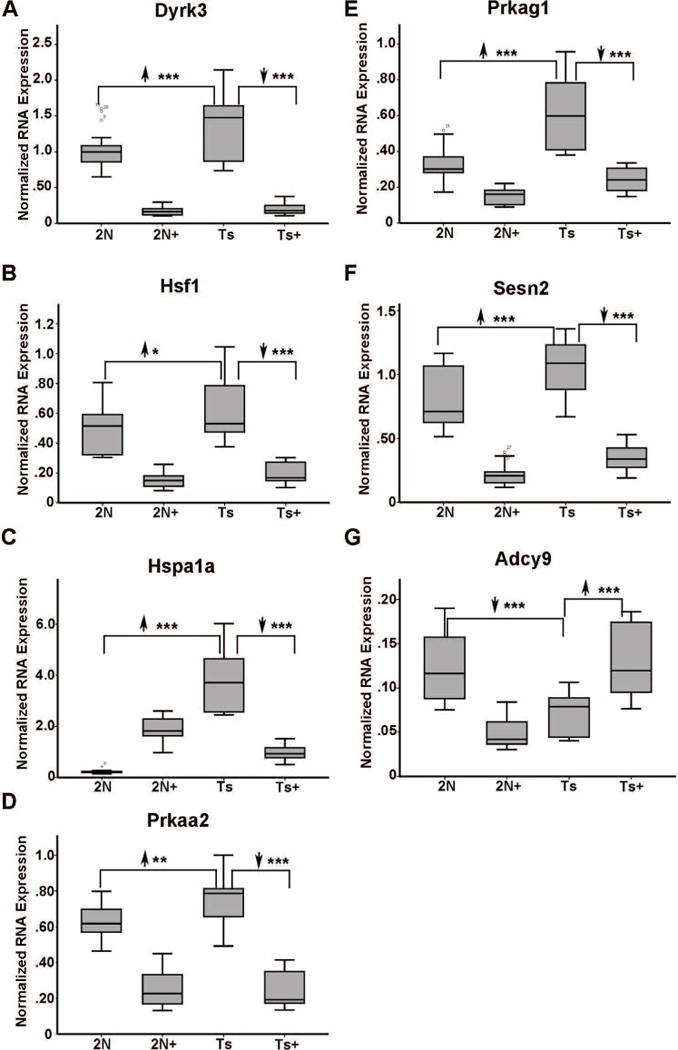
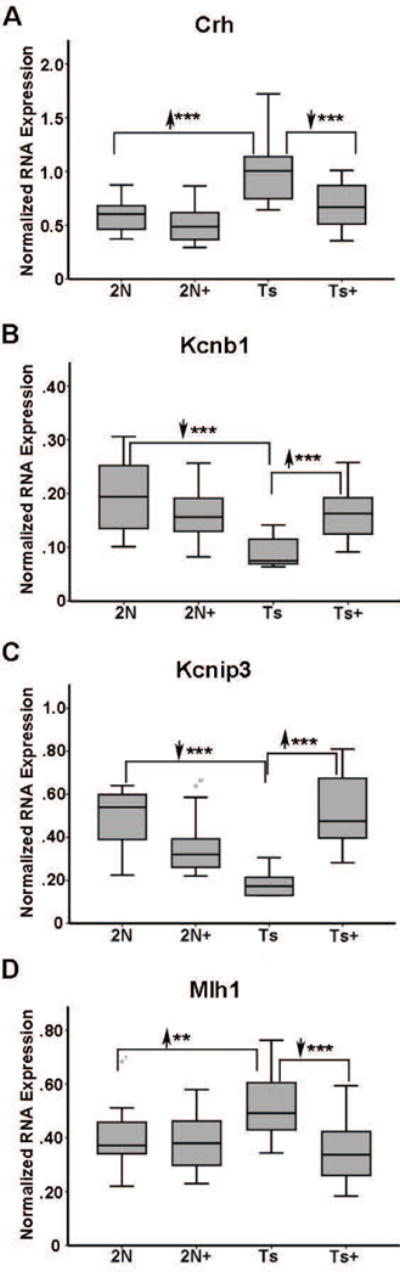
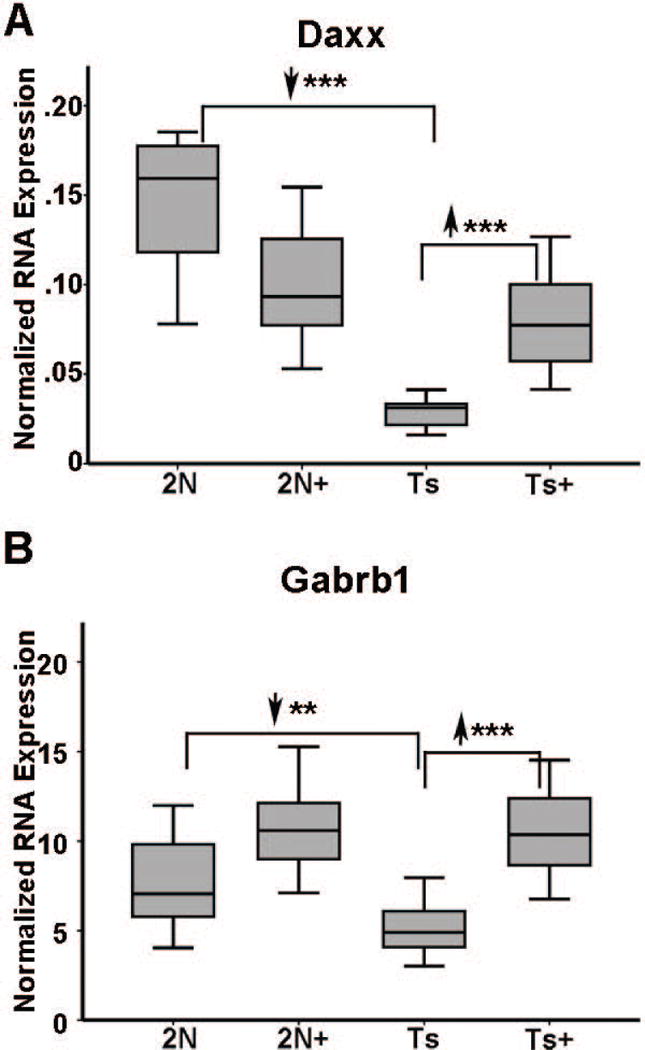
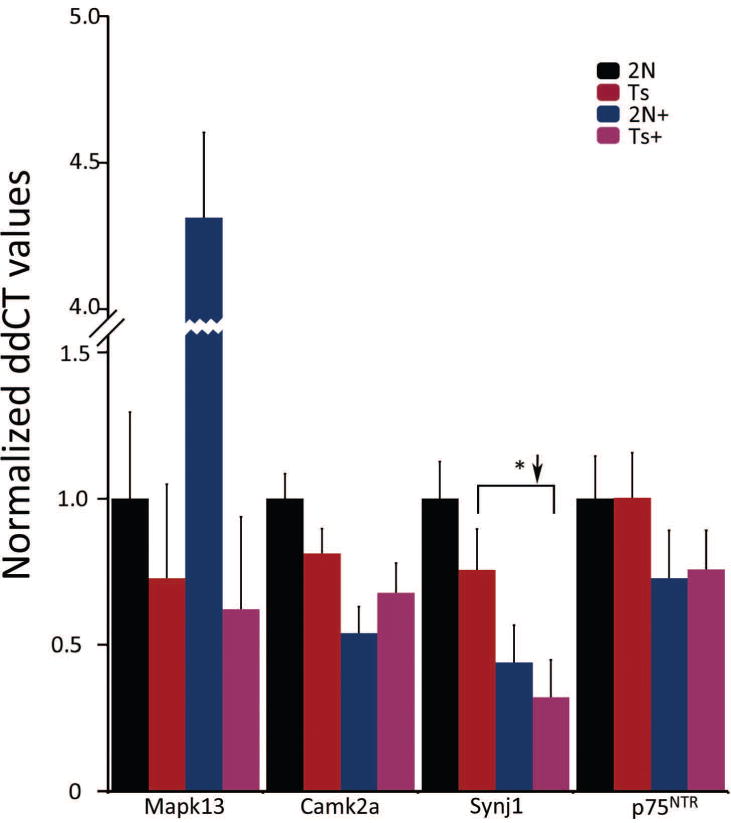
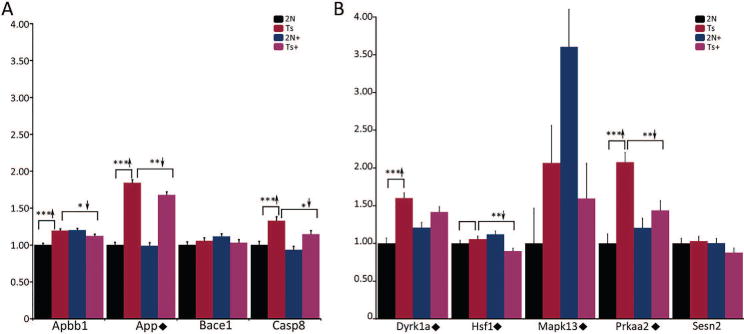
Although there are changes in gene expression and alterations in neuronal density and afferent inputs in the forebrain of trisomic mouse models of Down syndrome (DS) and Alzheimer's disease (AD), there is a lack of systematic assessments of gene expression and encoded proteins within individual vulnerable cell populations, precluding translational investigations at the molecular and cellular level. Further, no effective treatment exists to combat intellectual disability and basal forebrain cholinergic neurodegeneration seen in DS. To further our understanding of gene expression changes before and following cholinergic degeneration in a well-established mouse model of DS/AD, the Ts65Dn mouse, we assessed RNA expression levels from CA1 pyramidal neurons at two adult ages (∼6 months of age and ∼11 months of age) in both Ts65Dn and their normal disomic (2N) littermates. We further examined a therapeutic intervention, maternal choline supplementation (MCS), which has been previously shown to lessen dysfunction in spatial cognition and attention, and have protective effects on the survival of basal forebrain cholinergic neurons in the Ts65Dn mouse model. Results indicate that MCS normalized expression of several genes in key gene ontology categories, including synaptic plasticity, calcium signaling, and AD-associated neurodegeneration related to amyloid-beta peptide (Aβ) clearance. Specifically, normalized expression levels were found for endothelin converting enzyme-2 (Ece2), insulin degrading enzyme (Ide), Dyrk1a, and calcium/calmodulin-dependent protein kinase II (Camk2a), among other relevant genes. Single population expression profiling of vulnerable CA1 pyramidal neurons indicates that MCS is a viable therapeutic for long-term reprogramming of key transcripts involved in neuronal signaling that are dysregulated in the trisomic mouse brain which have translational potential for DS and AD.

Keywords: choline supplementation; hippocampus; laser capture microdissection; microarray; trisomic.


Figures

Figure 1
Figure 1
~6 MO MCS-treated trisomic offspring show upregulation and reversal of select genes in synaptic plasticity and neurodegeneration GO categories. A. Ece2 is upregulated 1.24 fold (2N versus Ts) in Ts65Dn mice and downregulated in Ts+ mice (Ts+ versus Ts) to 2N levels by MCS. B. Ide is upregulated 1.22 fold (2N versus Ts) in Ts65Dn mice and downregulated in Ts+ mice (Ts+ versus Ts) to 2N levels by MCS. C. p75NTR is upregulated 1.26 fold (2N versus Ts) in Ts65Dn mice and downregulated in Ts+ mice (Ts+ versus Ts) to 2N levels by MCS. D. Pax6 is upregulated 1.23 fold (2N versus Ts) in Ts65Dn mice and downregulated in Ts+ mice relative to 2N and Ts levels by MCS treatment, while Pax6 levels in Ts+ are not significantly different from 2N+ levels. E. Synj1 is upregulated 1.22 fold (2N versus Ts) in Ts65Dn mice and downregulated in Ts+ mice (Ts+ versus Ts) to 2N levels by MCS. F. Synpo is upregulated 1.24 fold (2N versus Ts) in Ts65Dn mice and is downregulated in Ts+ mice (Ts+ versus Ts) to 2N levels by MCS. Note that 2N mice show no significant differences due to MCS treatment in the presented genes except Pax6. Key: *, p<0.01; **, p<0.005; ***, p<0.001. Upward arrowhead, significant upregulation; downward arrowhead, significant downregulation. For figure clarity, we used the abbreviation Ts (for Ts65Dn mice) and Ts+ (for Ts65Dn MCS treated mice).
Figure 2
Figure 2
Select calcium signaling genes were normalized by MCS treatment in Ts65Dn mice at ~6 MO. A. Adcy1 is upregulated 1.21 fold (2N versus Ts) in Ts65Dn mice and downregulated in Ts+ mice relative to 2N and Ts levels by MCS treatment, while Adcy1 levels in Ts+ are not significantly different from 2N+ levels. B. Camk2a is upregulated 1.23 fold (2N versus Ts) in Ts65Dn mice and downregulated in Ts+ mice relative to 2N and Ts levels by MCS treatment, while Camk2a levels in Ts+ are not significantly different from 2N+ levels. C. Mapk13 is upregulated 1.28 fold (2N versus Ts) in Ts65Dn mice and downregulated in Ts+ mice (Ts+ versus Ts) to 2N levels by MCS. D. Npy1r is upregulated 1.23 fold (2N versus Ts) in Ts65Dn mice and downregulated in Ts+ mice (Ts+ versus Ts) to 2N levels by MCS. Significant differences due to MCS treatment in 2N mice were observed for Adcy1 and Camk2a. Key: *, p<0.01; **, p<0.005; ***, p<0.001. Upward arrowhead, significant upregulation; downward arrowhead, significant downregulation.
Figure 3
Figure 3
Expression levels impacted by perinatal MCS in ~11 MO MCS-treated offspring included select AD and DS response genes. A. Adam10 is upregulated 1.52 fold (2N versus Ts) in Ts65Dn mice and downregulated in Ts+ mice (Ts+ versus Ts) to 2N levels by MCS. B. Dyrk1a is upregulated 1.30 fold (2N versus Ts) in Ts65Dn mice and downregulated in Ts+ mice relative to 2N and Ts levels by MCS treatment, while Dyrk1a levels in Ts+ are not significantly different from 2N+ levels. C. Eif2ak2 is upregulated 1.35 fold (2N versus Ts) in Ts65Dn mice and downregulated in Ts+ mice (Ts+ versus Ts) to 2N levels by MCS. D. Mapk13 is upregulated 1.22 fold (2N versus Ts) in Ts65Dn mice and downregulated in Ts+ mice relative to 2N and Ts levels by MCS treatment, while Mapk13 levels in Ts+ are not significantly different from 2N+ levels. E. Apbb1 is downregulated 1.64 fold (2N versus Ts) in Ts65Dn mice and upregulated in Ts+ mice (Ts+ versus Ts) to 2N levels by MCS. F. Bace1 is downregulated 1.92 fold (2N versus Ts) in Ts65Dn mice and upregulated in Ts+ mice (Ts+ versus Ts) to 2N levels by MCS. G. Casp8 is downregulated 1.58 fold (2N versus Ts) in Ts65Dn mice and upregulated in Ts+ mice (Ts+ versus Ts) to 2N levels by MCS. H. Mapt2N6D is downregulated 1.87 fold (2N versus Ts) in Ts65Dn mice and upregulated in Ts+ mice (Ts+ versus Ts) to 2N levels by MCS. I. Mapt2N6P is downregulated 2.12 fold (2N versus Ts) in Ts65Dn mice and upregulated in Ts+ mice (Ts+ versus Ts) to significantly higher levels than Mapt2N6P expression in 2N and 2N+ mice. Key: *, p<0.01; **, p<0.005; ***, p<0.001. Upward arrowhead, significant upregulation; downward arrowhead, significant downregulation.
Figure 4
Figure 4
Expression levels impacted by perinatal MCS in ~11 MO MCS-treated offspring included select energy homeostasis genes. A. Dyrk3 is upregulated 1.32 fold (2N versus Ts) in Ts65Dn mice and downregulated in Ts+ mice relative to 2N and Ts levels by MCS treatment, while Dyrk3 levels in Ts+ are not significantly different from 2N+ levels. B. Hsf1 is upregulated 1.24 fold (2N versus Ts) in Ts65Dn mice and downregulated in Ts+ mice relative to 2N and Ts levels by MCS treatment, while Hsf1 levels in Ts+ are not significantly different from 2N+ levels. C. Hspa1a is upregulated 7.72 fold (2N versus Ts) in Ts65Dn mice and downregulated in Ts+ mice relative to 2N and Ts levels by MCS treatment, while Hspa1a levels in Ts+ are trend-level (p<0.02) lower than 2N+ levels but higher than 2N levels. D. Prkaa2 is upregulated 1.17 fold (2N versus Ts) in Ts65Dn mice and downregulated in Ts+ mice relative to 2N and Ts levels by MCS treatment, while Prkaa2 levels in Ts+ are not significantly different from 2N+ levels. E. Prkag1 is upregulated 1.83 fold (2N versus Ts) in Ts65Dn mice and downregulated in Ts+ mice relative to 2N and Ts levels by MCS treatment, while Prkag1 levels in Ts+ are not significantly different from 2N+ levels. F. Sesn2 is upregulated 1.32 fold (2N versus Ts) in Ts65Dn mice and downregulated in Ts+ mice relative to 2N and Ts levels by MCS treatment, while Sesn2 levels in Ts+ are not significantly different from 2N+ levels. G. Adcy9 is the sole downregulated gene in this GO category. Adcy9 is downregulated 1.73 fold in Ts65Dn mice and upregulated in Ts+ mice (Ts+ versus Ts) to 2N levels by MCS. Key: *, p<0.01; **, p<0.005; ***, p<0.001. Upward arrowhead, significant upregulation; downward arrowhead, significant downregulation.
Figure 5
Figure 5
Select age-related and oxidative function genes were reversed by MCS in ~11 MO trisomic mice. A. Crh is upregulated 1.74 fold (2N versus Ts) in Ts65Dn mice and downregulated in Ts+ mice (Ts+ versus Ts) to 2N levels by MCS. B. Kcnb1 is downregulated 2.19 fold (2N versus Ts) in Ts65Dn mice and upregulated in Ts+ mice (Ts+ versus Ts) to 2N levels by MCS. C. Kcnip3 is downregulated 2.62 fold (2N versus Ts) in Ts65Dn mice and upregulated in Ts+ mice (Ts+ versus Ts) to 2N levels by MCS. D. Mlh1 is upregulated 1.32 fold (2N versus Ts) in Ts65Dn mice and downregulated in Ts+ mice (Ts+ versus Ts) to 2N levels by MCS. Key: **, p<0.005; ***, p<0.001. Upward arrowhead, significant upregulation; downward arrowhead, significant downregulation.
Figure 6
Figure 6
Downregulated neurotransmitter-related genes that were attenuated by MCS treatment included A Daxx is downregulated 5.17 fold (2N versus Ts) in Ts65Dn mice and upregulated in Ts+ mice (Ts+ versus Ts) to 2N+ levels by MCS, but not to 2N levels. B Gabrb1 is downregulated 1.43 fold (2N versus Ts) in Ts65Dn mice and upregulated in Ts+ mice (Ts+ versus Ts) to 2N levels by MCS. Key: **, p<0.005; ***, p<0.001. Upward arrowhead, significant upregulation; downward arrowhead, significant downregulation.
Figure 7
Figure 7
qPCR for select genes using subregional CA1 dissections of admixed cells in ~6 MO mice. Synj1 displays significant downregulation in MCS-treated Ts65Dn offspring, consistent with microarray studies. No genes had differential expression between genotypes, in contrast to microarray data from microdissected CA1 pyramidal neurons. Key: *, p<0.05.
Figure 8
Figure 8
qPCR for select genes using subregional CA1 dissections of admixed cells in ~11 MO mice. A. Apbb1 and Casp8 were upregulated in Ts65Dn mice and displayed significant reduction in MCS treated trisomic offspring. App is upregulated in Ts65Dn mice, and partially recovers to 2N levels by MCS treatment. Bace1 showed no significant differences based on diet or genotype. B. Dyrk1a and Prkaa2 were upregulated in trisomic mice, and displayed normalization (Dyrk1a trend-level p<0.067) with MCS treatment in Ts65Dn offspring. Hsf1 and Mapk13 were downregulated due to MCS treatment in trisomic mice (Mapk13 trend-level p<0.11). Sesn2 showed no significant differences based on diet or genotype. Key: *, p<0.05; **, p<0.01; ***, p<0.001. Upward arrowhead, significant upregulation; downward arrowhead, significant downregulation. Diamond, qPCR results validate microarray findings.

References

    1. ABI. Guide to Performing Relative Quantitation of Gene Expression Using Real-Time Quantitative PCR. Applied Biosystems Product Guide. 2004:1–60.
    1. Agrawal R, Tyagi E, Vergnes L, Reue K, Gomez-Pinilla F. Coupling energy homeostasis with a mechanism to support plasticity in brain trauma. Biochim Biophys Acta. 2014;1842:535–546. - PubMed
    1. Akeson EC, Lambert JP, Narayanswami S, Gardiner K, Bechtel LJ, Davisson MT. Ts65Dn – localization of the translocation breakpoint and trisomic gene content in a mouse model for Down syndrome. Cytogenet Cell Genet. 2001;93:270–276. - PubMed
    1. Alldred MJ, Che S, Ginsberg SD. Terminal continuation (TC) RNA amplification enables expression profiling using minute RNA input obtained from mouse brain. Int J Mol Sci. 2008;9:2091–2104. - PMC - PubMed
    1. Alldred MJ, Che S, Ginsberg SD. Terminal continuation (TC) RNA amplification without second strand synthesis. J Neurosci Methods. 2009;177:381–385. - PMC - PubMed

Publication types

MeSH terms