. 2018 Feb 2;19(1):24.
doi: 10.1186/s12882-018-0822-8.

Cortical and trabecular bone are equally affected in rats with renal failure and secondary hyperparathyroidism

Affiliations

Cortical and trabecular bone are equally affected in rats with renal failure and secondary hyperparathyroidism

Nikita M Bajwa et al. BMC Nephrol. .

Abstract

Background: Changes in mineral metabolism and bone structure develop early in the course of chronic kidney disease and at end-stage are associated with increased risk of fragility fractures. The disruption of phosphorus homeostasis leads to secondary hyperparathyroidism, a common complication of chronic kidney disease. However, the molecular pathways by which high phosphorus influences bone metabolism in the early stages of the disease are not completely understood. We investigated the effects of a high phosphorus diet on bone and mineral metabolism using a 5/6 nephrectomy model of chronic kidney disease.

Methods: Four-week old rats were randomly assigned into groups: 1) Control with standard diet, 2) Nephrectomy with standard rodent diet, and 3) Nephrectomy with high phosphorus diet. Rats underwent in vivo imaging at baseline, day 14, and day 28, followed by ex vivo imaging.

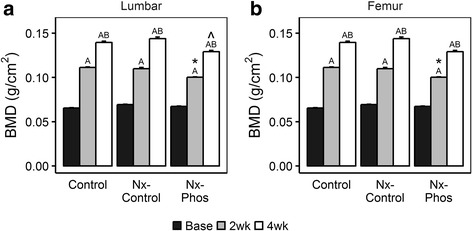
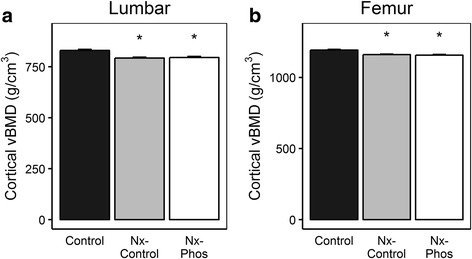
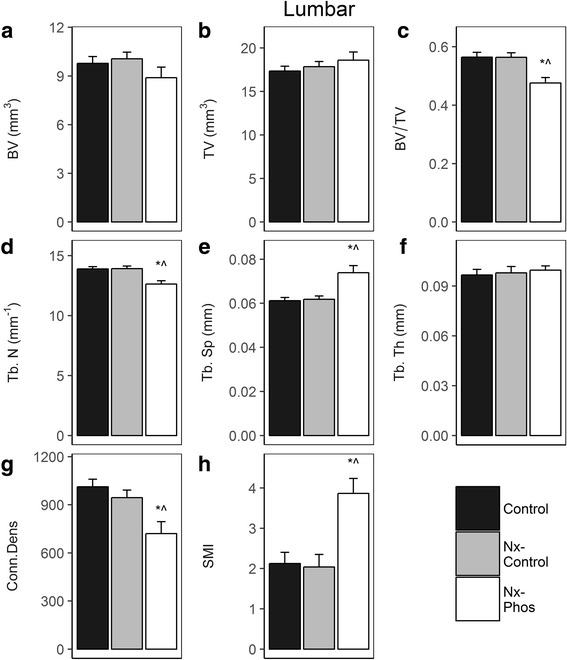
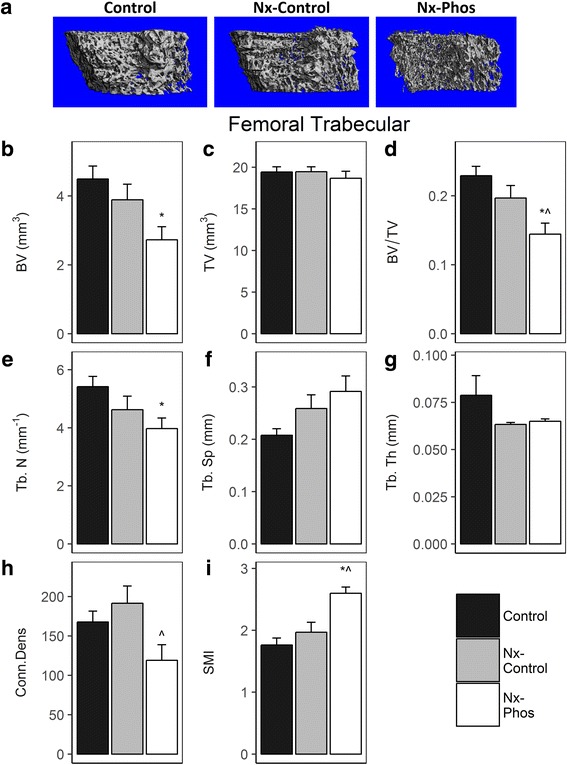
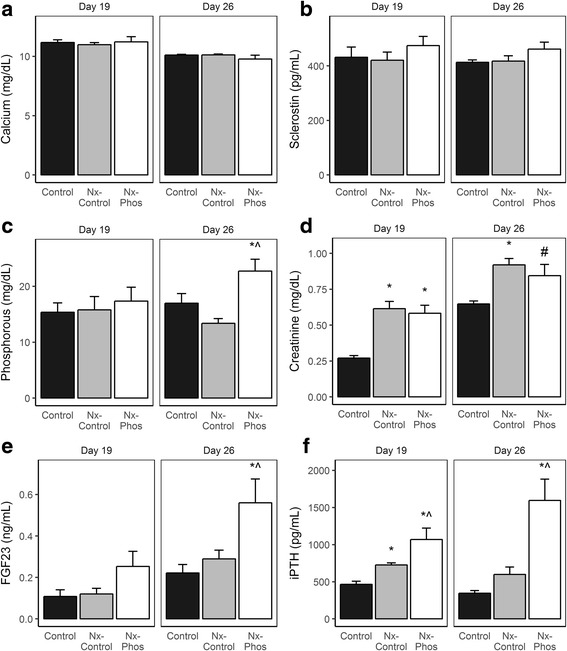
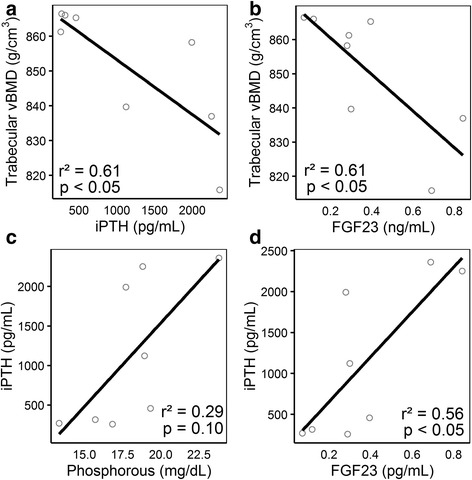
Results: Cortical bone density at the femoral mid-diaphysis was reduced in nephrectomy-control and nephrectomy-high phosphorus compared to control rats. In contrast, trabecular bone mass was reduced at both the lumbar vertebrae and the femoral secondary spongiosa in nephrectomy-high phosphorus but not in nephrectomy-control. Reduced trabecular bone volume adjusted for tissue volume was caused by changes in trabecular number and separation at day 35. Histomorphometry revealed increased bone resorption in tibial secondary spongiosa in nephrectomy-control. High phosphorus diet-induced changes in bone microstructure were accompanied by increased serum parathyroid hormone and fibroblast growth factor 23 levels.

Conclusion: Our study demonstrates that changes in mineral metabolism and hormonal dysfunction contribute to trabecular and cortical bone changes in this model of early chronic kidney disease.

Keywords: Bone; Chronic kidney disease; FGF23; Phosphorus; Renal pathology.


Conflict of interest statement

Ethics approval

Animal housing and procedures were approved by the Institutional Animal Care and Use Committee of the Jerry L. Pettis Memorial Veterans Affairs Medical Center. Rats were anesthetized with isoflurane prior to surgical procedures. All procedures performed complied with the principles and procedures of the Guidelines for the Care and Use of Experimental Animals.

Consent for publication

Not applicable.

Competing interests

The authors declare that they have no competing interests.

Publisher’s Note

Springer Nature remains neutral with regard to jurisdictional claims in published maps and institutional affiliations.

Figures

Fig. 1
Fig. 1
Study timeline and the effect of phosphorus on bone measurements. (a) Rats underwent baseline in vivo DXA imaging, followed by partial nephrectomy of the left kidney at day 0. At day 5, rats underwent total nephrectomy of the right kidney and began a high phosphorus diet or standard diet at day 7. In vivo DXA imaging occurred at 14 days post-nephrectomy, followed by serum collection 5 days later. One week later, serum was collected again, followed by in vivo DXA imaging at 28 days post-nephrectomy. At 35 days, rats were euthanized and bones underwent ex vivo micro-CT imaging. (b) Weight was monitored weekly throughout the duration of the study. Values are presented as mean percent increase over baseline ± SEM; n = 6–8. (c) Body length was obtained at baseline, prior to surgery and euthanasia. Values are presented as mean percent increase over baseline ± SEM; n = 6–8. *Significant at p < 0.05 versus Control animals. ^Significant at p < 0.05 versus Nx-Control animals
Fig. 2
Fig. 2
Effects of nephrectomy and/or high phosphorus diet on lumbar and femoral bone mineral density (BMD). (a) BMD was determined from DXA analysis of the lumbar vertebrae. ASignificant at p < 0.01 versus baseline rats. BSignificant at p < 0.01 versus 2 weeks post-nephrectomy. *Significant at p < 0.05 versus Control. ^Significant at p < 0.01 versus Nx-Control. Values are presented as means ± SEM; n = 11–14. (b) BMD was determined from DXA analysis of the femur. ASignificant at p < 0.01 versus baseline rats. BSignificant at p < 0.01 versus 2 weeks post-nephrectomy. *Significant at p < 0.05 versus Control. Values are presented as means ± SEM; n = 11–14
Fig. 3
Fig. 3
Effects of nephrectomy and/or high phosphorus diet on cortical bone. The (a) lumbar vertebrae and (b) femur vBMD were determined from micro-CT analysis. *Significant at p < 0.01 versus control. Values are presented as means ± SEM; n = 10–12
Fig. 4
Fig. 4
Effects of nephrectomy and/or high phosphorus diet on the microstructure of lumbar bone. (a) Bone volume, (b) total volume, (c) total volumetric BMD (BV/TV), (d) trabecular number, (e) trabecular separation, (f) trabecular thickness, (g) connectivity density, and (h) structure model index were determined from micro-CT analysis. *Significant at p < 0.01 versus Control. ^Significant at p < 0.01 versus Nx-Control. Values are presented as means ± SEM; n = 10–12
Fig. 5
Fig. 5
Trabecular bone parameters of the femur. (a) Representative micro-CT images, (b) bone volume, (c) total volume, (d) total volumetric BMD (BV/TV), (e) trabecular number, (f) trabecular separation, (g) trabecular thickness, (h) connectivity density, and (i) structure model index were obtained from micro-CT analysis. *Significant at p < 0.01 versus Control. ^Significant at p < 0.01 versus Nx-Control. Values are presented as means ± SEM; n = 10–12
Fig. 6
Fig. 6
Effects of nephrectomy and/or high phosphorus diet on serum levels of systemic bone formation and skeletal markers. Serum levels of (a) Calcium, (b) sclerostin, (c) phosphorus, (d) creatinine, (e) FGF23, and (f) iPTH were measured at days 19 and 26 post-nephrectomy. *Significant at p < 0.01 versus Nx-Control. ^Significant at p < 0.01 versus Nx-Control. #Significant at p < 0.06 versus Nx-Control. Values are presented as means ± SEM; n = 3–9
Fig. 7
Fig. 7
Relationships between bone and serum levels of systemic bone formation and skeletal markers in rats with nephrectomy and/or high phosphorus diet. (a) Trabecular volumetric bone mineral density (vBMD) vs. iPTH, (r2 = 0.61, p < 0.05), (b) trabecular vBMD vs. FGF23, (r2 = 0.61, p < 0.05), (c) phosphorus vs. iPTH, (r2 = 0.29, p = .10), and (d) iPTH vs. FGF23, (r2 = 0.56, p < 0.05) at day 26; n = 8

References

    1. USRDS annual data report. Epidemiology of kidney disease in the United States. Bethesda, MD: National Institutes of Health, National Institute of Diabetes and Digestive and Kidney Diseases; 2015.
    1. Lau WL, Linnes M, Chu EY, Foster BL, Bartley BA, Somerman MJ, et al. High phosphate feeding promotes mineral and bone abnormalities in mice with chronic kidney disease. Nephrol Dial Transplant. 2013;28(1):62–69. doi: 10.1093/ndt/gfs333. - DOI - PMC - PubMed
    1. Nickolas TL, Stein EM, Dworakowski E, Nishiyama KK, Komandah-Kosseh M, Zhang CA, et al. Rapid cortical bone loss in patients with chronic kidney disease. J Bone Miner Res. 2013;28(8):1811–1820. doi: 10.1002/jbmr.1916. - DOI - PMC - PubMed
    1. Ott SM. Bone histomorphometry in renal osteodystrophy. Semin Nephrol. 2009;29(2):122–132. doi: 10.1016/j.semnephrol.2009.01.005. - DOI - PubMed
    1. Spasovski GB, Bervoets AR, Behets GJ, Ivanovski N, Sikole A, Dams G, et al. Spectrum of renal bone disease in end-stage renal failure patients not yet on dialysis. Nephrol Dialysis, transplantation. 2003;18(6):1159–1166. doi: 10.1093/ndt/gfg116. - DOI - PubMed

Publication types

LinkOut - more resources