. 2018 Feb 1;69(3):412-425.e6.
doi: 10.1016/j.molcel.2017.12.029. Epub 2018 Jan 27.

The Augmented R-Loop Is a Unifying Mechanism for Myelodysplastic Syndromes Induced by High-Risk Splicing Factor Mutations

Affiliations

The Augmented R-Loop Is a Unifying Mechanism for Myelodysplastic Syndromes Induced by High-Risk Splicing Factor Mutations

Liang Chen et al. Mol Cell. .

Abstract

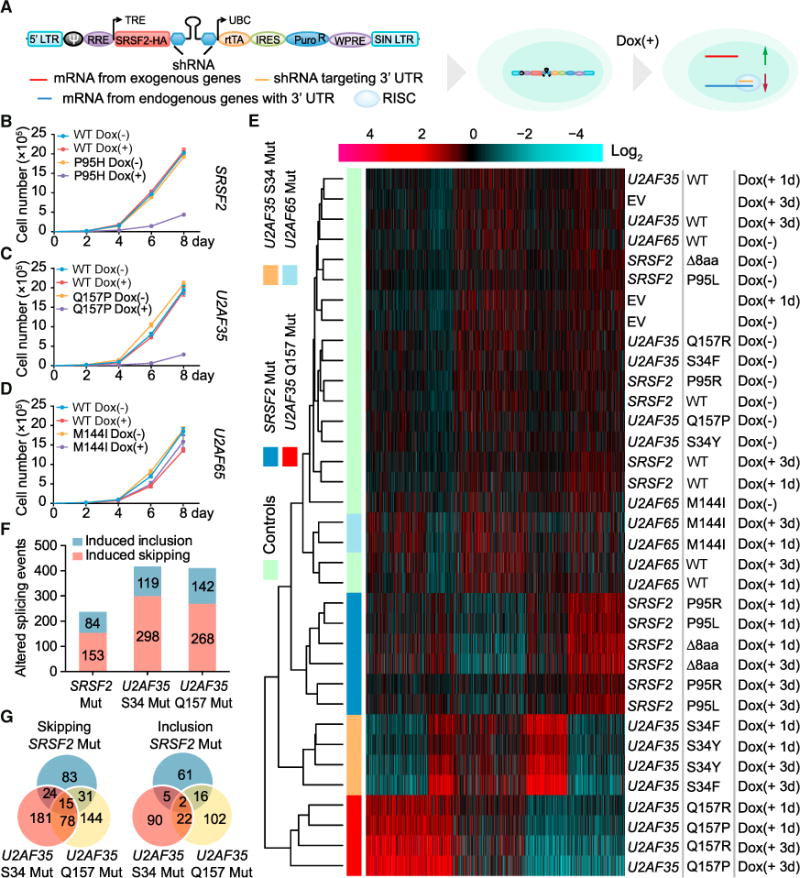
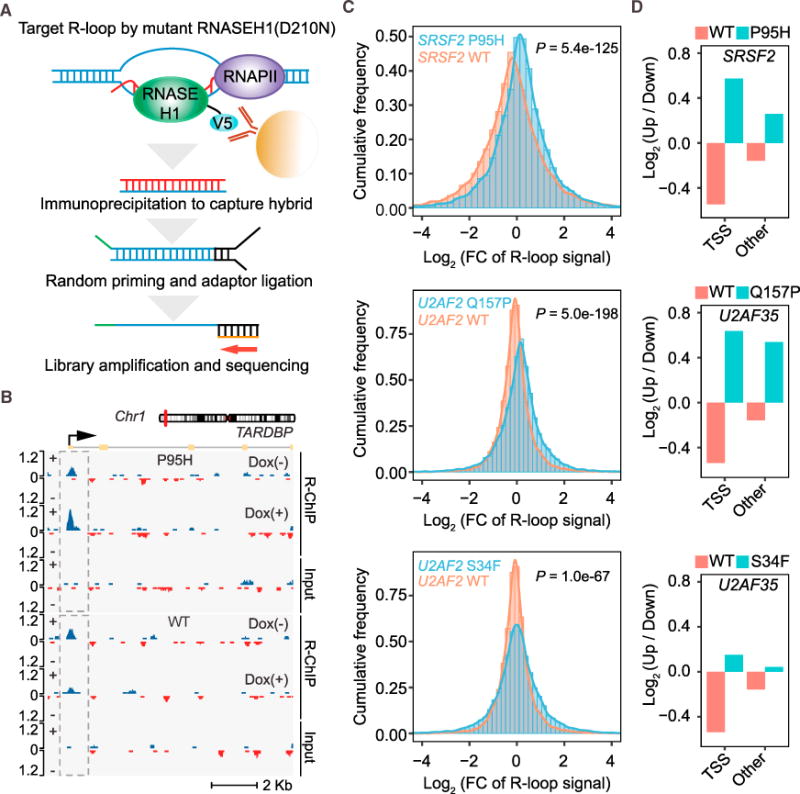
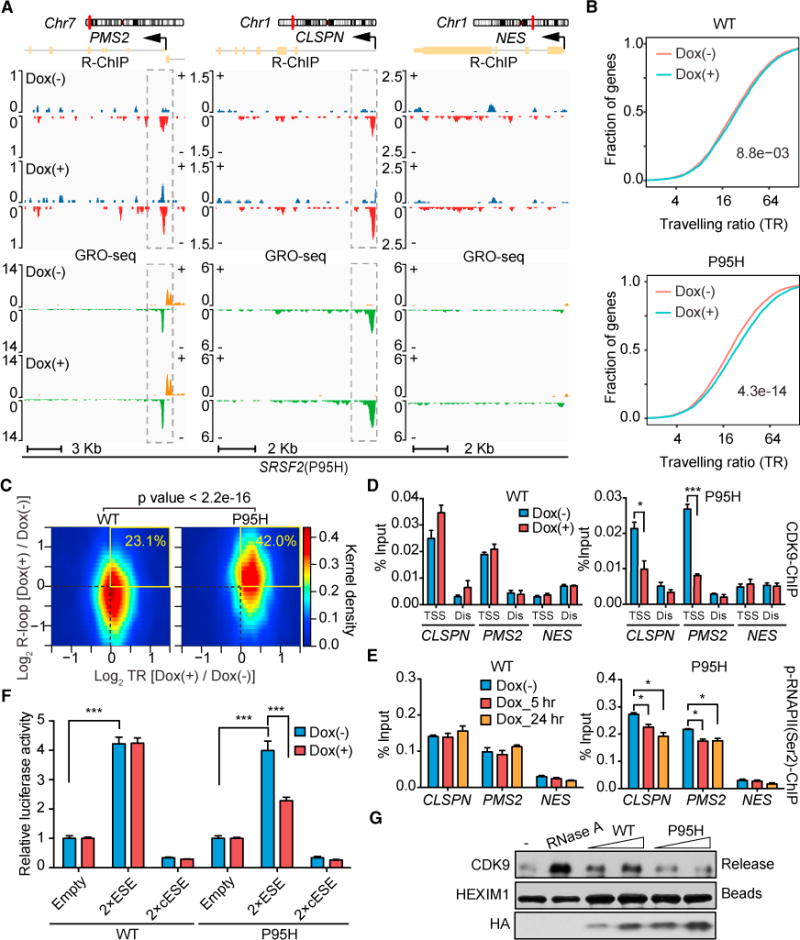
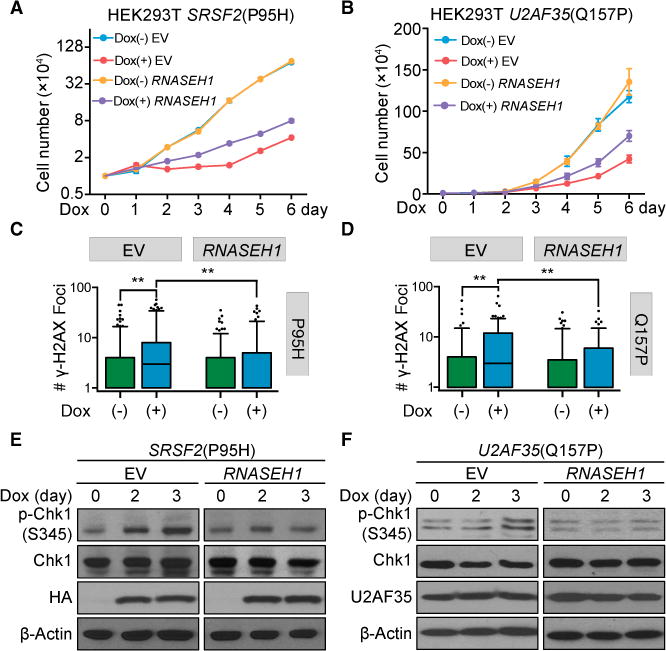
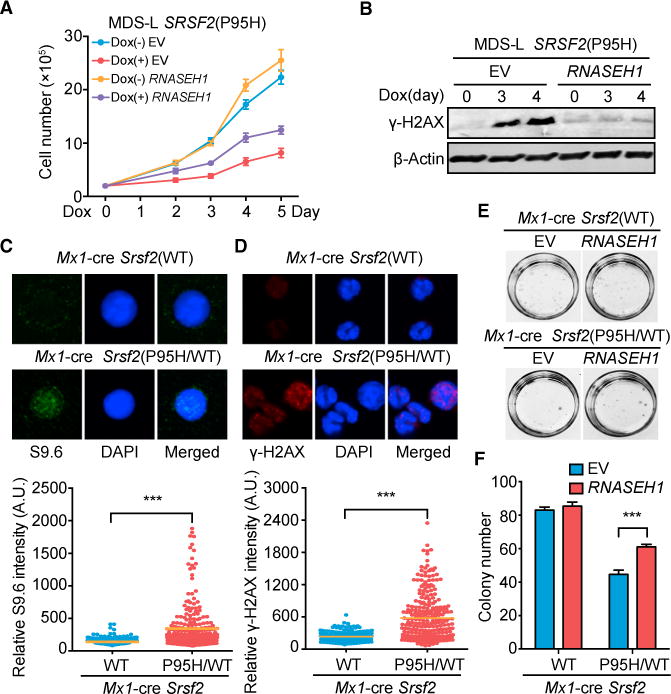
Mutations in several general pre-mRNA splicing factors have been linked to myelodysplastic syndromes (MDSs) and solid tumors. These mutations have generally been assumed to cause disease by the resultant splicing defects, but different mutations appear to induce distinct splicing defects, raising the possibility that an alternative common mechanism is involved. Here we report a chain of events triggered by multiple splicing factor mutations, especially high-risk alleles in SRSF2 and U2AF1, including elevated R-loops, replication stress, and activation of the ataxia telangiectasia and Rad3-related protein (ATR)-Chk1 pathway. We further demonstrate that enhanced R-loops, opposite to the expectation from gained RNA binding with mutant SRSF2, result from impaired transcription pause release because the mutant protein loses its ability to extract the RNA polymerase II (Pol II) C-terminal domain (CTD) kinase-the positive transcription elongation factor complex (P-TEFb)-from the 7SK complex. Enhanced R-loops are linked to compromised proliferation of bone-marrow-derived blood progenitors, which can be partially rescued by RNase H overexpression, suggesting a direct contribution of augmented R-loops to the MDS phenotype.

Keywords: MDS; R-loops; genome instability; splicing factor mutations.


Conflict of interest statement

DECLARATION OF INTERESTS

The authors declare no competing financial interests.

Figures

Figure 1
Figure 1. Phenotypic Analysis and Splicing Profiling of Splicing Factor Mutations
(A) Schematic of the strategy to express exogenous WT or mutant splicing factors and concomitantly knock down the corresponding endogenous transcripts. Each pTRIPZ expression unit contains the protein coding region of a WT or mutant splicing factor gene (SRSF2-HA is used as an example), followed by an shRNA to target the 3′ UTR of the corresponding endogenous transcript. Stable cells were first selected, and the expression of each expression unit was induced by addition of doxycycline (Dox) to culture medium. (B–D) Proliferation of HEK293T cells following different days of Dox-induced expression of WT or mutant SRSF2(P95H) (B, n = 3 biological replicates), U2AF35(Q157P) (C, n = 3 biological replicates), and U2AF65(M144I) (D, n = 4 biological replicates). (E) Clustering analysis of the splicing responses profiled by RNA annealing selection ligation followed by deep sequencing (RASL-seq). The log2 ratio of the short versus long isoform for each splicing event was calculated and used for k-means clustering. Red, induced exon skipping events; blue, induced exon inclusion events. Individual constructs and treatment conditions are indicated on the right. D8aa, mutant SRSF2 depleted of amino acids 95 to 102. (F) The numbers of significantly induced skipping and inclusion splicing events identified by RASL-seq (>1.5-fold and p < 0.05 by unpaired Student’s t test) in mutant cells relative to their WT counterparts. (G) Venn diagrams of shared and unique splicing events induced in cells expressing different SRSF2 and U2AF35 mutants. See also Figure S1 for additional analyses of mutation-induced cellular phenotypes and Figures S2A–S2C for the validation of RASL-seq data by RT-PCR.
Figure 2
Figure 2. DNA Damage Response and Activation of the ATR Pathway by Mutant Splicing Factors
(A and B) γ-H2AX foci detected by immunocytochemistry in HEK293T cells upon induced expression of WT or mutant SRSF2(P95H and D8aa) (A) and U2AF35(S34F and Q157P) (B) by Dox for 3 days. Red, γ-H2AX; blue, DAPI. Scale bar, 10 μm. (C and D) Quantitative analyses of γ-H2AX foci for cells with WT or mutant SRSF2 (C), and WT or mutant U2AF35 (D). More than 100 cells per treatment condition per cell type were analyzed. Statistical significance was determined by one-way ANOVA test. *p < 0.05; **p < 0.01. (E) Top: schematic of the DNA fiber assay. HEK293T cells treated with Dox for 3 days were sequentially labeled with IdU and CIdU for 20 min each. Bottom: representative DNA fibers fluorescently labeled with IdU (red) and CIdU (green). (F) Length distribution of DNA fiber tracks in HEK293T cells expressing WT or mutant SRSF2 and U2AF35. The relative lengths of IdU-and CIdU-labeled elongating DNA fiber tracts (n > 100) were scored for each dataset. The p values were calculated by unpaired Student’s t test. (G and H) Western blot analysis of γ-H2AX and phospho-Chk1(S345) levels in HEK293T cells upon induction of SRSF2(WT, P95H, and D8aa) (G) or U2AF35(WT, S34F, and Q157P) (H) by Dox for different days. (I and J) Western blot analysis of cells with mutant SRSF2 (I) and U2AF35 (J) for phospho-ATM(S1981), phospho-Chk2(T68), and phospho-RPA32(S4/S8) levels. See also Figures S2D and S2E for additional western blotting analyses of HEK293 and MDS-L cells and Figures S2F and S2G for immunostaining and quantitative analysis of phospho-ATM and phospho-Chk2.
Figure 3
Figure 3. R-Loops Induced by Mutant Splicing Factors
(A) Schematic of the R-loop profiling method (R-ChIP) by expressing a catalytically dead RNase H followed by standard ChIP sequencing. (B) R-loop enrichment and dynamic change at the TSS region of a representative gene in HEK293T cells expressing WT SRSF2 (bottom) or mutant SRSF2(P95H) (top) after Dox treatment for 5 hr. (C) Fold changes (FCs) of R-loop intensity (Dox(+)/Dox(−)) in HEK293T cells expressing WT or mutant SRSF2(P95H) (top), U2AF35(Q157P) (center), and U2AF35(S34F) (bottom), presented by histograms. The p values for all pairwise comparisons were determined by Wilcoxon test. (D) Ratio of up- and downregulated R-loops in promoter versus non-promoter regions in HEK293T cells expressing WT or mutant SRSF2(P95H), U2AF35(Q157P), and U2AF35(S34F). See also Figure S3 for additional analyses of R-ChIP data and Figure S4 for R-loop levels in WT and mutant cells in relation to splice sites and sequence motifs for RNA binding.
Figure 4
Figure 4. R-Loop Formation and Transcriptional Repression Induced by Mutant SRSF2
(A) R-loop levels profiled by R-ChIP and nascent RNA production (indicative of corresponding transcriptionally engaged Pol II) by GRO-seq on two representative positive genes (PMS2 and CLSPN) and one negative gene (NES) in mutant SRSF2(P95H) HEK293T cells with or without Dox treatment for 5 hr. (B) Changes in traveling ratio (TR) based on metagene analysis of the GRO-seq datasets (gene length > 1,000, n = 19,300) upon induction of WT or mutant SRSF2(P95H). The p values were calculated by two-sided Kolmogorov-Smirnov test as indicated. (C) Heatmaps of changes in TSS-associated R-loops (y axis) and TR (x axis) for individual genes in HEK293T cells expressing WT or mutant SRSF2(P95H). The numbers in the top right quarter of each graph indicate the percentages of positively correlated events. The p value was calculated by Fisher’s exact test. (D and E) ChIP-qPCR analysis of CDK9 (D) and Pol II Ser2 phosphorylation (E) on the promoter of representative genes (PMS2, CLSPN, and NES) as shown in (A) upon induced expression of WT or mutant SRSF2(P95H). A distal region (Dis) was analyzed in parallel in each case as a control for CDK9 ChIP-qPCR. Data are presented as mean ± SEM (n = 3 technical replicates). Statistical significance was determined by unpaired Student’s t test. *p < 0.05; ***p < 0.001. (F) Dual luciferase assays using pCMV (internal control) and HSV-ESE reporters on HEK293T cells upon induced expression of WT or SRSF2(P95H) by Dox treatment. Data are presented as mean ± SEM (n = 6 biological replicates). ***p < 0.001 based on unpaired Student’s t test. (G) The P-TEFb extraction assay. The anti-HEXIM1-immunoprecipitated 7SK complex was incubated with affinity-purified WT or mutant SRSF2(P95H) protein, followed by detection of released CDK9 from the 7SK complex by western blotting. RNase A treatment provided a positive control, HEXIM1 remaining on beads served as a loading control, and the relative amounts of purified proteins tested were detected by western blotting using anti-HA and are shown at the bottom. See also Figure S5 for additional data regarding the transcriptional response to mutant SRSF2 and U2AF35.
Figure 5
Figure 5. Rescue of Functional Defects on Cellular Models by RNASEH1 Overexpression
(A and B) Proliferation of HEK293T cells stably expressing RNASEH1 with or without induced expression of SRSF2(P95H) (A, n = 3 biological replicates) or U2AF35(Q157P) (B, n = 4 biological replicates) upon Dox treatment for different days. Cells expressing empty vector (EV) served as a control. (C and D) Quantitative analysis of γ-H2AX foci detected by immunocytochemistry in HEK293T cells expressing RNASEH1 before and after induced expression of SRSF2(P95H) (C) or U2AF35(Q157P) (D) by Dox treatment for 3 days. More than 100 cells per Dox treatment condition per cell type were analyzed, and p values were calculated by one-way ANOVA test. (E and F) Suppression of Chk1 activation by overexpressed RNASEH1 in HEK293T cells upon induced expression of SRSF2(P95H) (E) or U2AF35 (Q157P) (F) by Dox for different days. See also Figure S6A for RNASEH1 overexpression by western blotting analysis and Figures S6B–S6D for cell proliferation of additional mutant cells with or without RNASEH1 overexpression.
Figure 6
Figure 6. Functional Rescue of Mutant SRSF2-Induced Defects in Hematopoietic Systems by RNASEH1 Overexpression
(A) Proliferation of MDS-L cells expressing empty vector or RNASEH1 with or without induced expression of SRSF2(P95H) by Dox treatment for different days (n = 4 biological replicates). (B) Western blot analysis of γ-H2AX levels in SRSF2(P95H) MDS-L cells expressing EV or RNASEH1 as in (A). (C and D) R-loop signals detected by immunostaining with S9.6 (C) and DNA damage response detected by immunostaining for γ-H2AX (D), both in isolated c-Kit+ progenitor cells from Srsf2(WT) or heterozygous Srsf2(P95H/WT) knockin mice 14 days after poly(I:C) injection. The quantitative data at the bottom were based on 3 mice from each (WT or mutant) group. ***p < 0.001 based on unpaired Student t test for more than 100 cells analyzed. (E and F) Representative photographs showing colonies (E) and quantification of colony numbers (F) of c-Kit+ progenitor cells isolated from Srsf2(WT) or Srsf2(P95H/WT) mice 14 days after overexpression of EV or RNASEH1. All data are presented as mean ± SEM (6 plates of Srsf2(WT) cells and 8 plates of Srsf2(P95H/WT) cells). ***p < 0.001 by unpaired Student’s t test. See also Figure S6E for RNASEH1 overexpression in these cells and Figure S6F for the quantified data from the second repeat of the replating assay.

Comment in

References

    1. Aguilera A, García-Muse T. R loops: from transcription byproducts to threats to genome stability. Mol Cell. 2012;46:115–124. - PubMed
    1. Awasthi P, Foiani M, Kumar A. ATM and ATR signaling at a glance. J Cell Sci. 2015;128:4255–4262. - PubMed
    1. Biankin AV, Waddell N, Kassahn KS, Gingras MC, Muthuswamy LB, Johns AL, Miller DK, Wilson PJ, Patch AM, Wu J, et al. Australian Pancreatic Cancer Genome Initiative Pancreatic cancer genomes reveal aberrations in axon guidance pathway genes. Nature. 2012;491:399–405. - PMC - PubMed
    1. Calo E, Flynn RA, Martin L, Spitale RC, Chang HY, Wysocka J. RNA helicase DDX21 coordinates transcription and ribosomal RNA processing. Nature. 2015;518:249–253. - PMC - PubMed
    1. Chen PC, Dudley S, Hagen W, Dizon D, Paxton L, Reichow D, Yoon SR, Yang K, Arnheim N, Liskay RM, Lipkin SM. Contributions by MutL homologues Mlh3 and Pms2 to DNA mismatch repair and tumor suppression in the mouse. Cancer Res. 2005;65:8662–8670. - PubMed

Publication types

MeSH terms