. 2018 Feb 8;172(4):811-824.e14.
doi: 10.1016/j.cell.2017.12.038. Epub 2018 Jan 25.

Human ADAR1 Prevents Endogenous RNA from Triggering Translational Shutdown

Affiliations

Human ADAR1 Prevents Endogenous RNA from Triggering Translational Shutdown

Hachung Chung et al. Cell. .

Abstract

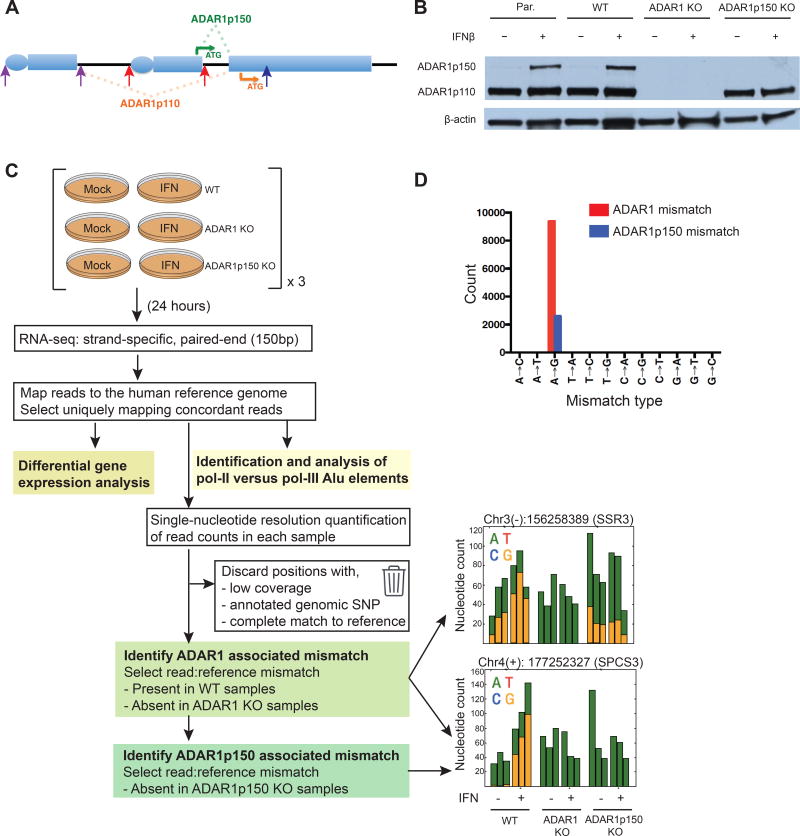
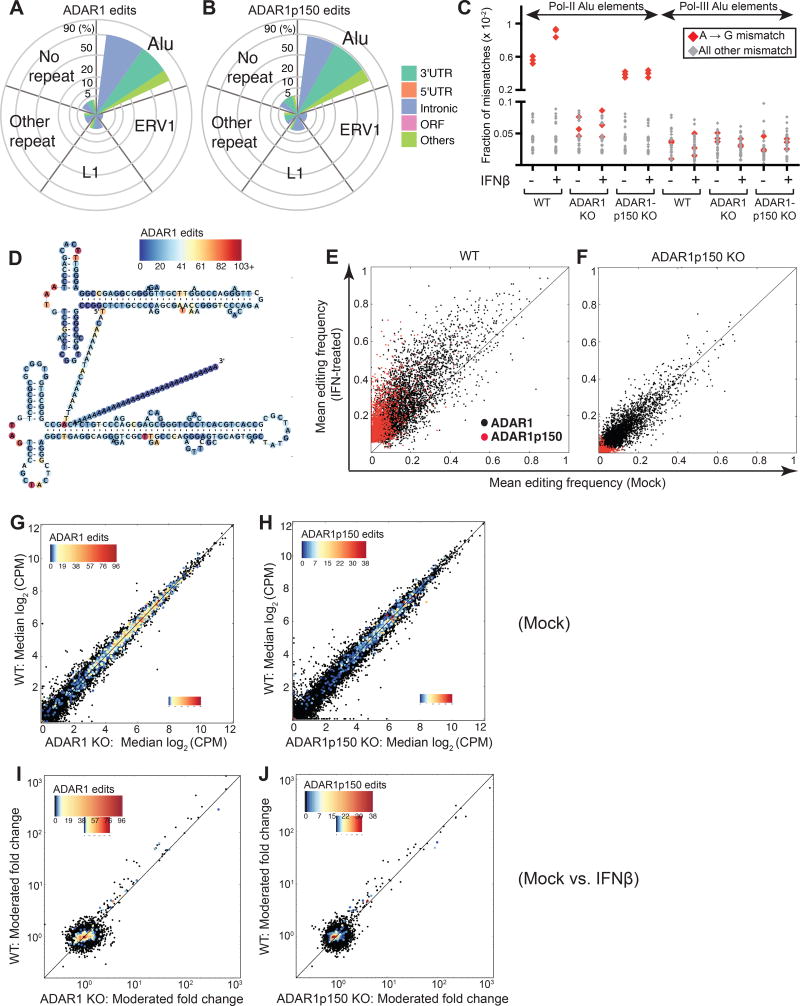
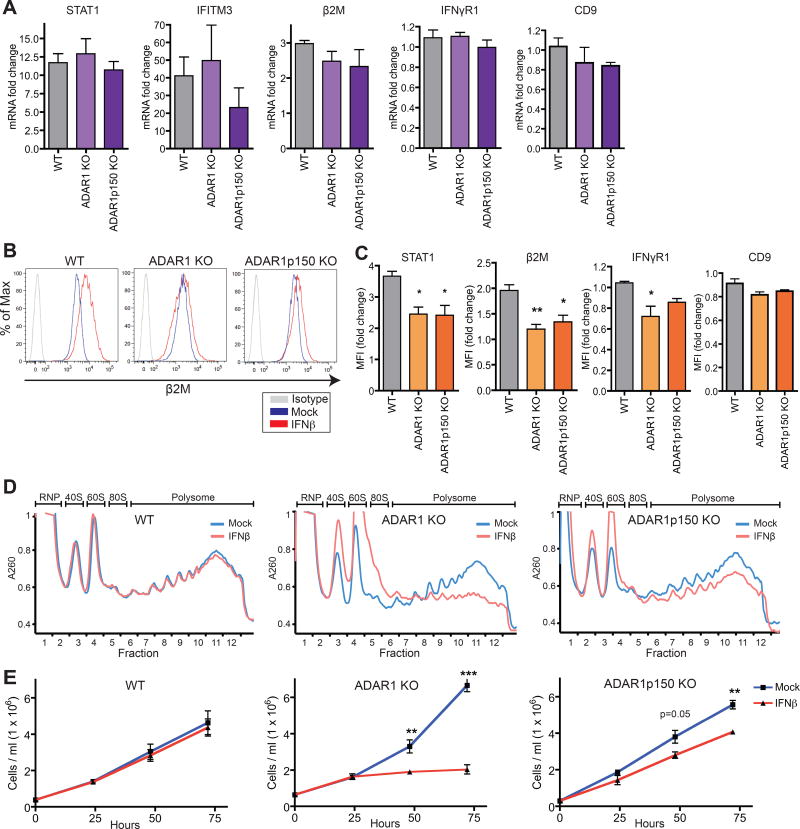
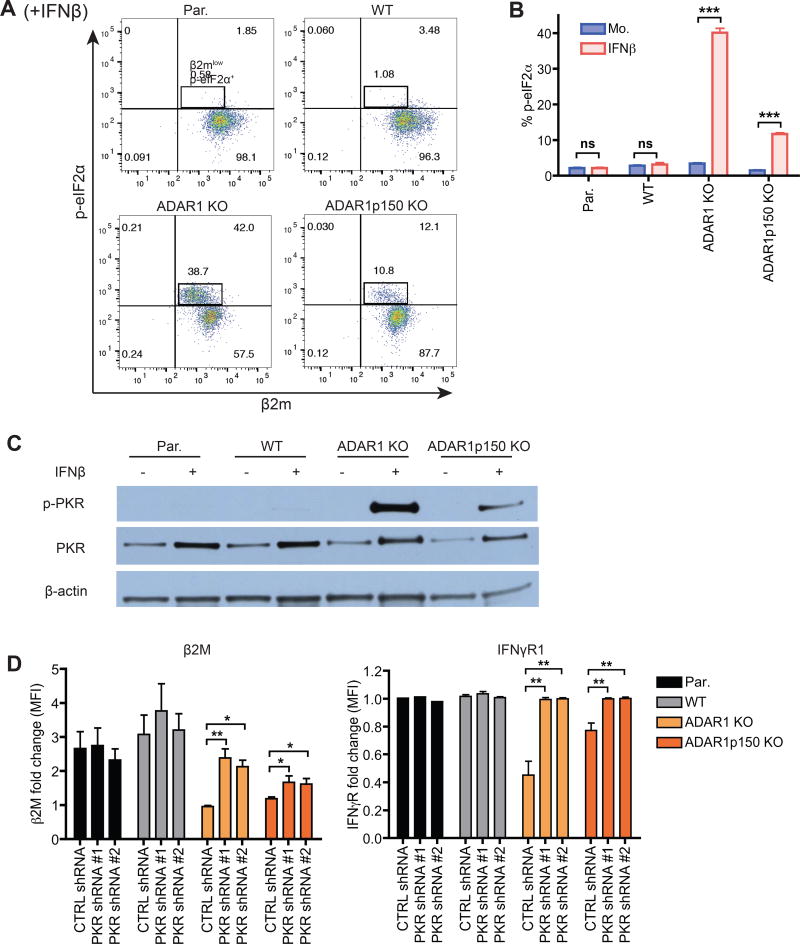
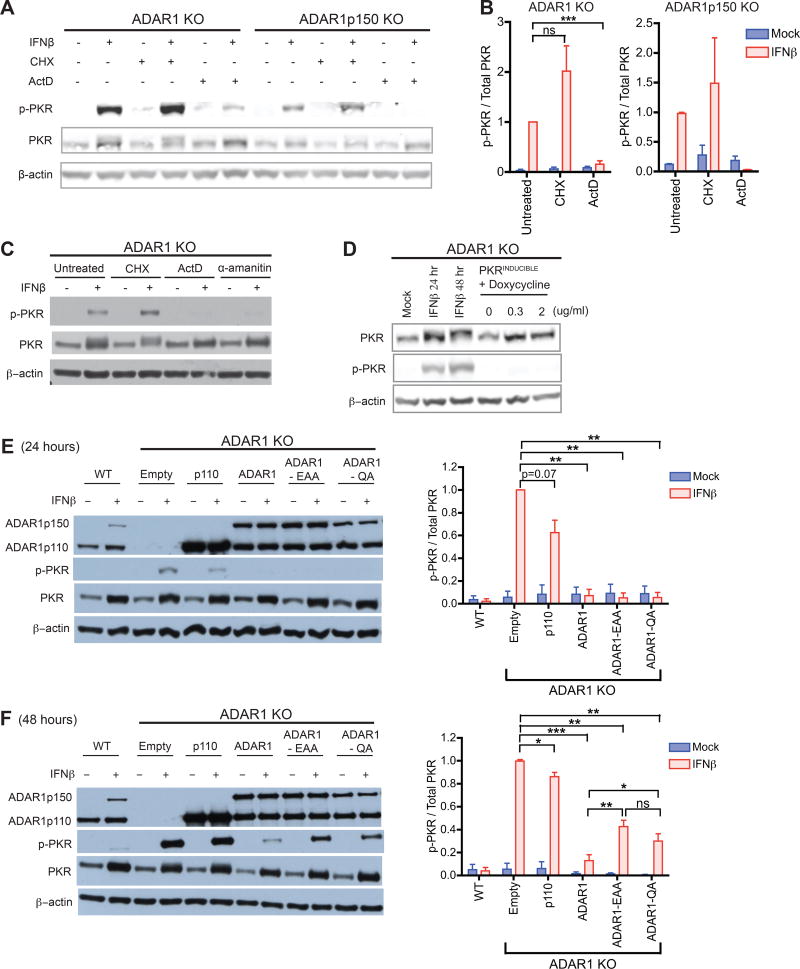
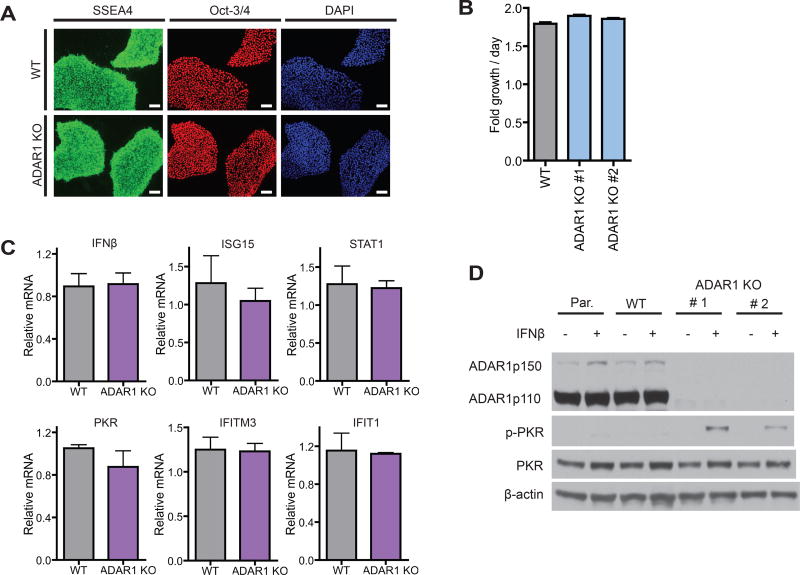
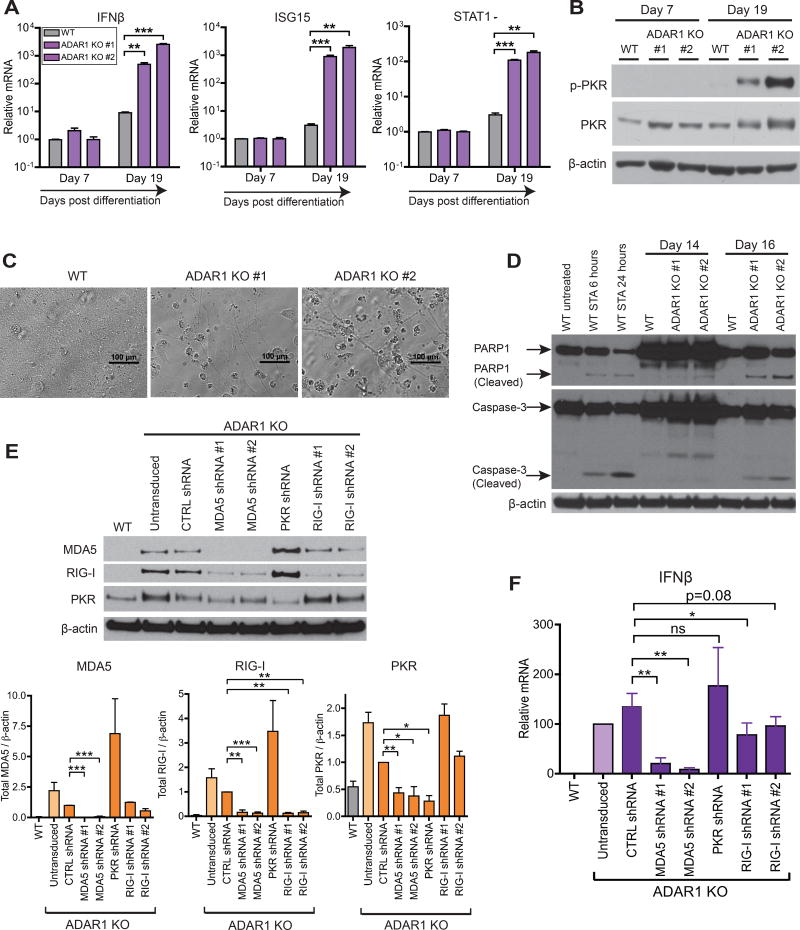
Type I interferon (IFN) is produced when host sensors detect foreign nucleic acids, but how sensors differentiate self from nonself nucleic acids, such as double-stranded RNA (dsRNA), is incompletely understood. Mutations in ADAR1, an adenosine-to-inosine editing enzyme of dsRNA, cause Aicardi-Goutières syndrome, an autoinflammatory disorder associated with spontaneous interferon production and neurologic sequelae. We generated ADAR1 knockout human cells to explore ADAR1 substrates and function. ADAR1 primarily edited Alu elements in RNA polymerase II (pol II)-transcribed mRNAs, but not putative pol III-transcribed Alus. During the IFN response, ADAR1 blocked translational shutdown by inhibiting hyperactivation of PKR, a dsRNA sensor. ADAR1 dsRNA binding and catalytic activities were required to fully prevent endogenous RNA from activating PKR. Remarkably, ADAR1 knockout neuronal progenitor cells exhibited MDA5 (dsRNA sensor)-dependent spontaneous interferon production, PKR activation, and cell death. Thus, human ADAR1 regulates sensing of self versus nonself RNA, allowing pathogen detection while avoiding autoinflammation.

Keywords: ADAR1; AGS; Aicardi-Goutieres syndrome; Alu elements; MDA5; PKR; RNA editing; innate immunity; neuronal progenitor cells; translation; type I interferon.


Conflict of interest statement

DECLARATION OF INTERESTS

The authors declare no competing interests.

Figures

Figure 1
Figure 1. RNA-Seq analysis pipeline to determine the ADAR1 editome
(A) Two isoforms of ADAR1 are generated by usage of different promoters and alternative splicing. Pc, constitutively active promoter that initiates transcription of exon 1B. Pi, interferon inducible promoter that initiates transcription of exon 1A. Exon 1B or exon 1A splices to exon 2 leading to ADAR1p110 or ADAR1p150 expression, respectively. ATG designates the translational start site for ADAR1p110 (orange) or ADAR1p150 (green). Arrows indicate gRNAs targeting expression of ADAR1 (blue), ADAR1p150 (red), and ADAR1p110 (purple) (see Tables S1 and S2 for more detail). (B) Western blot of WT, ADAR1- and ADAR1p150 KO 293T cell clones after mock or IFNβ treatment. Par, parental 293T cell line. (C, D) Schematic of comparative RNA-Seq analysis pipeline for the identification of ADAR1 and ADAR1p150-dependent mismatches, with examples of per sample nucleotide counts for both mismatch types (n = 3 independent clones for each genotype) (C). Pol II and pol III Alu elements refer to putative RNA polymerase II transcribed Alu elements, or RNA polymerase III transcribed Alu elements, respectively. Total mismatch counts associated with ADAR1 (red) and ADAR1p150 (blue) (D). All mismatch sites identified are listed in Tables S3 and S4.
Figure 2
Figure 2. Identification and characterization of the ADAR1 editome during IFN response
(A–B) Distribution of ADAR1- (A) and ADAR1p150- (B) edit sites with respect to repetitive elements. Edit sites within Alu, L1 (LINE1), and ERV1 (Endogenous retroviral sequence 1) elements are indicated. Remaining edit sites within another class of repetitive element or within a non-repetitive element are shown as "Other repeat" and "No repeat", respectively. Spoke axis indicates the percentage of edit sites located within each repetitive element class. Size and color of wedges indicate the proportion of edits found within different transcript components. (C) Fraction of A-to-G read:reference mismatches (in red), and all other read:reference mismatches (in gray) identified in pol II Alu elements (‘transcript-embedded Alus’) and pol III Alu elements (‘independently transcribed Alus’). n = 3 clones for each genotype. (D) ADAR1-associated edits identified within Alu sequences enumerated and shown on the predicted secondary structure of the Alu consensus sequence. The color bar represents the number of ADAR1 edits identified per position in the Alu consensus sequence. (E–F) Editing frequencies at ADAR1- (black) and ADAR1p150- (red) associated edit sites are shown for mock (x-axis) versus IFN-treated (y-axis) cells in WT (E) and ADAR1p150 KO cells (F). (G–H) Gene expression (Log2 read counts per million, CPM) in mock treated WT versus ADAR1 KO (G), and WT versus ADAR1p150 KO cells (H). The median value from n = 3 cell clones is shown per gene. (I–J) Fold change gene expression (moderated fold-change values, limma analysis) upon IFN treatment are shown for WT versus ADAR1 KO (I), and WT versus ADAR1p150 KO cells (J). (G–J) Colored dots indicate genes with edit sites. Color bar represents the number of ADAR1- or ADAR1p150- associated edit sites identified per gene. See also Figure S2 and Table S6.
Figure 3
Figure 3. ADAR1 prevents global translational shutdown and cell growth arrest during IFN response
(A–D) WT or ADAR1-deficient 293T cells were treated with IFNβ (24 hours). ISG mRNA fold change upon IFN treatment measued by qRT-PCR (A). β2M protein expression (B) and mean fluorescence intensity (MFI) fold change measured by flow cytometery upon IFN treatment (C). Polysome gradients (D). RNP, ribonucleoprotein. 40S, 60S and 80S denote the corresponding ribosomal subunits and monosome, respectively. Polysome, translating ribosomes bound to transcript. Data shown as mean ± SEM. n = 3 cell clones for each genotype. One-way ANOVA and Tukey’s post hoc test, *P < 0.05, **P < 0.01. (E) Cell density during IFN treatment. Data shown as mean ± SEM (n = 3 experimental replicates). Student’s t-test, **P < 0.01, ***P < 0.001. See also Figures S3 and S4.
Figure 4
Figure 4. ADAR1 enables efficient cellular translation by preventing PKR activation
(A–C) WT or ADAR1-deficient 293T cells were mock or IFNβ treated (24 hours). (A, B) Flow cytometry analysis of phosphorylated eIF2α (p-eIF2α) and β2M. Representative dot plots of IFN treated samples only (A). Bar graph showing the frequency (%) of p-eIF2α+ cells (B). Data shown as mean ± SEM (n = 3 experimental replicates). Student’s t-test, ***P < 0.001. (C) Western blot of phosphorylated PKR (p-PKR), total PKR, and β-actin control. (D) β2M and IFNγR1 mean fluorescence intensity (MFI) fold change upon IFNβ treatment (24 hours) in PKR knock-down cells. PKR shRNA #1 and #2 are two independent shRNAs targeting different regions of PKR. CTRL, control. Data shown as mean ± SEM (n = 3 experimental replicates). One-way ANOVA and Tukey’s post hoc test, *P < 0.05, **P < 0.01. (A–D) Par, parental 293T cell line. See also Figure S5.
Figure 5
Figure 5. PKR activation depends on newly transcribed endogenous RNA, and is suppressed by the dsRNA binding and catalytic activities of ADAR1
(A–C) ADAR1 KO or ADAR1p150 KO 293T cells were mock or IFNβ treated for 24 hours in total. After the initial 12 hours of IFN treatment, cells were co-incubated with cycloheximide (CHX, 30ug/ml), actinomycin-D (ActD, 10ug/ml), or α-amanitin (25ug/ml) for the latter 12 hours (Figure S6A). Western blot of phosphorylated PKR (p-PKR) (A, C). p-PKR band intensity was normalized to that of total PKR (n = 2~3 experimental replicates) (B). (D) Doxycycline-inducible expression of PKR in ADAR1 KO cells. As a positive control for PKR induction, ADAR1 KO cells were treated with IFNβ. p-PKR and total PKR was measured by western blot. (E–F) ADAR1 KO cells were transduced with puromycin-selectable lentiviruses containing the following constructs; p110, WT ADAR1p110; ADAR1, WT ADAR1p110 and ADAR1p150; EAA, ADAR1 (both isoforms) dsRBD mutant; QA, ADAR1 (both isoforms) deaminase domain mutant; Empty, empty vector negative control. Stable cell lines were mock or IFNβ treated for 24 (E) or 48 hours (F). Representative western blots (left panels) and bar graphs summarizing p-PKR band intensities normalized to that of total PKR (right panels, n= 3~5 experimental replicates). (B, E, F) Data shown as mean ± SEM. Student’s t-test, *P < 0.05, **P < 0.01, ***P < 0.001, ns = not significant. See also Figure S6.
Figure 6
Figure 6. Generation and characterization of ADAR1 KO hESCs
(A) Immunofluorescence staining of WT and ADAR1 KO hESCs. SSEA4 (green), Oct-3/4 (red), and DAPI (blue). Scale bar, 100um. (B) hESC growth rate/day measured by the CellTiter-Glo assay. (C) qRT-PCR of IFNβ and ISGs. Data shown as mean ± SEM (n = 3~6 experimental replicates). (D) Western blot of mock and IFNβ treated (24 hours) hESCs. p-PKR, PKR phosphorylation. (A–D) Par., parental hESC clone. WT, CRISPR/Cas9 derived WT hESC cell clone. ADAR1 KO #1 and #2 are two independent CRISPR/Cas9 derived ADAR1 KO hESC clones (see Table S2).
Figure 7
Figure 7. Differentiation of ADAR1 KO hESCs to NPCs leads to spontaneous IFNβ production, PKR activation, and apoptotic cell death
(A–D) WT and two independent ADAR1 KO hESC clones were differentiated into monolayer NPCs (Figure S7A). qRT-PCR of IFNβ and two ISGs (STAT1, ISG15) (n = 3 experimental replicates) (A). Western blot of p-PKR in NPCs (B). Bright field images of NPC monolayer at 20 days post differentiation (C). Western blot of full length and cleaved forms of PARP1 and Caspase-3, markers of apoptosis (D). As a positive control for apoptosis, WT NPCs were treated with 1uM of Staurosporine (STA). (E-F) RIG-I, MDA5, or PKR were knocked down in ADAR1 KO NPCs with lentiviral shRNAs (Figure S7F). Representative western blot (uppler panel) and band intensities normalized to β- actin (lower panels, n = 2~5 experimental replicates) (E). qRT-PCR of IFNβ mRNA (n = 4~5 experimental replicates) (F). (A, E, F) Data shown as mean ± SEM. Student’s t-test, *P < 0.05, **P < 0.01, ***P < 0.001, ns = not significant. See also Figure S7.

Comment in

  • RNA metabolism: Interfering with interferon by RNA editing.
    Zlotorynski E. Zlotorynski E. Nat Rev Mol Cell Biol. 2018 Mar;19(3):140-141. doi: 10.1038/nrm.2018.12. Epub 2018 Feb 7. Nat Rev Mol Cell Biol. 2018. PMID: 29410527 No abstract available.
  • Sort Your Self Out!
    Uggenti C, Crow YJ. Uggenti C, et al. Cell. 2018 Feb 8;172(4):640-642. doi: 10.1016/j.cell.2018.01.023. Cell. 2018. PMID: 29425484
  • Who Defends the Stem Cell's Citadel?
    Strick-Marchand H, Durantel D. Strick-Marchand H, et al. Cell Stem Cell. 2018 Mar 1;22(3):287-289. doi: 10.1016/j.stem.2018.02.007. Cell Stem Cell. 2018. PMID: 29499145

References

    1. Athanasiadis A, Rich A, Maas S. Widespread A-to-I RNA editing of Alucontaining mRNAs in the human transcriptome. PLoS biology. 2004;2:e391. - PMC - PubMed
    1. Bao W, Kojima KK, Kohany O. Repbase Update, a database of repetitive elements in eukaryotic genomes. Mobile DNA. 2015;6:11. - PMC - PubMed
    1. Bass BL, Weintraub H. An unwinding activity that covalently modifies its double-stranded RNA substrate. Cell. 1988;55:1089–1098. - PubMed
    1. Bensaude O. Inhibiting eukaryotic transcription: Which compound to choose? How to evaluate its activity? Transcription. 2011;2:103–108. - PMC - PubMed
    1. Chambers SM, Fasano CA, Papapetrou EP, Tomishima M, Sadelain M, Studer L. Highly efficient neural conversion of human ES and iPS cells by dual inhibition of SMAD signaling. Nat Biotechnol. 2009;27:275–280. - PMC - PubMed

Publication types

MeSH terms

Supplementary concepts