. 2018 May;93(5):1098-1107.
doi: 10.1016/j.kint.2017.11.011. Epub 2018 Feb 1.

Reduced active transcellular intestinal oxalate secretion contributes to the pathogenesis of obesity-associated hyperoxaluria

Affiliations

Reduced active transcellular intestinal oxalate secretion contributes to the pathogenesis of obesity-associated hyperoxaluria

Ruhul Amin et al. Kidney Int. 2018 May.

Abstract

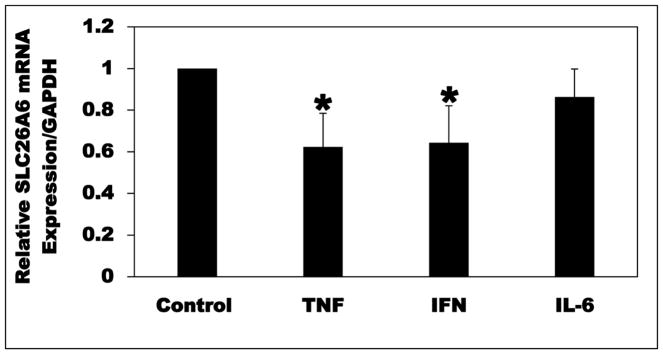
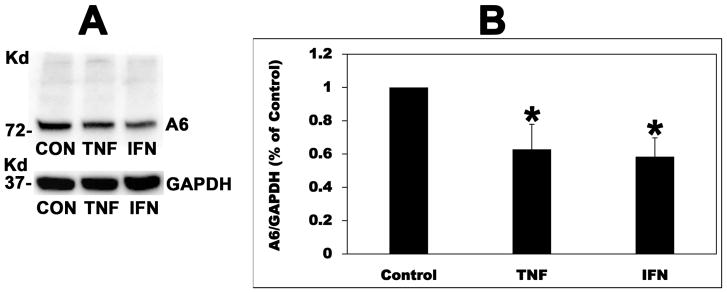
Most kidney stones are composed of calcium oxalate, and minor changes in urine oxalate affect the stone risk. Obesity is a risk factor for kidney stones and a positive correlation of unknown etiology between increased body size, and elevated urinary oxalate excretion has been reported. Here, we used obese ob/ob (ob) mice to elucidate the pathogenesis of obesity-associated hyperoxaluria. These ob mice have significant hyperoxaluria (3.3-fold) compared with control mice, which is not due to overeating as shown by pair-feeding studies. Dietary oxalate removal greatly ameliorated this hyperoxaluria, confirming that it is largely enteric in origin. Transporter SLC26A6 (A6) plays an essential role in active transcellular intestinal oxalate secretion, and ob mice have significantly reduced jejunal A6 mRNA (- 80%) and total protein (- 62%) expression. While net oxalate secretion was observed in control jejunal tissues mounted in Ussing chambers, net absorption was seen in ob tissues, due to significantly reduced secretion. We hypothesized that the obesity-associated increase in intestinal and systemic inflammation, as reflected by elevated proinflammatory cytokines, suppresses A6-mediated intestinal oxalate secretion and contributes to obesity-associated hyperoxaluria. Indeed, proinflammatory cytokines (elevated in ob mice) significantly decreased intestinal oxalate transport in vitro by reducing A6 mRNA and total protein expression. Proinflammatory cytokines also significantly reduced active mouse jejunal oxalate secretion, converting oxalate transport from net secretion in vehicle-treated tissues to net absorption in proinflammatory cytokines-treated tissues. Thus, reduced active intestinal oxalate secretion, likely secondary to local and systemic inflammation, contributes to the pathogenesis of obesity-associated hyperoxaluria. Hence, proinflammatory cytokines represent potential therapeutic targets.

Keywords: SLC26A6; hyperoxaluria; inflammation; intestinal oxalate secretion; obesity.


Figures

Fig. 1
Fig. 1
Urinary oxalate levels in the ob/ob (ob) mice and their lean controls. A: Urine samples were collected either directly from the bladders of the ob mice and their controls at the time of euthanasia or collected over a 1 h period as described in Methods. The ob mice have significantly higher (μmol Oxalate/mg creatinine) urinary oxalate levels (* P < 9.9E−20 for ob compared with Controls, by unpaired t-test, n = 47–49). B: The ob mice and their controls were placed individually in metabolic cages and 24 h urine samples were collected. The ob mice have significantly higher (μmol/24 h) urinary oxalate levels (* P < 0.0002 for ob compared with Controls, by unpaired t-test, n = 7–8).
Fig. 2
Fig. 2
Urinary oxalate levels in the db/db (db) mice and their lean controls. Urine samples were collected directly from the bladders of the db mice and their controls at the time of euthanasia. The db mice have significantly higher (μmol Oxalate/mg creatinine) urinary oxalate levels (* P < 0.03 for db compared with Controls, by unpaired t-test, n = 3).
Fig. 3
Fig. 3
Effect of pair-feeding on urinary oxalate levels in the ob/ob (ob) mice and their lean controls. A: Average daily food consumption by the ob mice and their controls. The ob mice and their controls were housed individually and their daily food consumption was assessed over a period of 4 days, during which they have free access to food. The ob mice consumed significantly higher food per day (*P < 0.006 for ob compared with Controls, by unpaired t-test, n = 4–5). B: Urinary oxalate levels in pair-fed (4g/mouse/day) ob mice and their controls. Urine samples were collected either directly from the bladders at the time of euthanasia or collected over a 1 h period as described in Methods. The ob mice have significantly higher (μmol Oxalate/mg creatinine) urinary oxalate levels (* P < 0.007 for ob compared with Controls, by unpaired t-test, n = 4).
Fig. 4
Fig. 4
SLC26A1 (A1), SLC26A2 (A2), SLC26A3 (A3), and SLC26A6 (A6) mRNA expression in the ob/ob (ob) mice and their lean controls. Total RNA was isolated from the ob mice and their controls for real-time PCR analysis. Values are means ± SD of 4–5 independent experiments each of which was done in duplicate or triplicate. Relative A1, A2, A3, and A6 mRNA expression levels were expressed as a percentage of Control normalized to GAPDH. The ob mice have significantly reduced A6 mRNA expression level (* P < 0.002 for ob compared with Controls, by unpaired t-test).
Fig. 5
Fig. 5
SLC26A6 (A6) total protein expression in the ob/ob (ob) mice and their lean controls. A: A representative Western blot analysis of total A6 protein expression. A6 protein expression was evaluated in jejunal mucosal scrapings (15 μg protein/lane) isolated from the ob mice and their controls (CON). The lower part of the same blot was probed with an anti-β-actin (Actin) antibody to normalize loading of protein in each lane (lower panel). B: Densitometry of immunoblot results. Western blot band density was quantified using ImageJ software. Values are means ± SD for 4 independent experiments (blots shown in Supplementary Fig. S1) of relative total A6 abundance to β-actin and are presented as a percentage of the Control value. The ob mice have significantly reduced A6 protein expression (* P < 0.004 for ob compared with Controls, by unpaired t-test).
Fig. 6
Fig. 6
Unidirectional [mucosa to serosa = JMS (absorptive flux), and serosa to mucosa = JSM (secretory flux)] and net (Jnet) transepithelial oxalate fluxes across jejunal tissues (n = 19 tissue pairs) isolated from the ob/ob (ob) mice and their lean controls and mounted ex vivo in modified Ussing chambers. While a net baseline oxalate secretory flux is observed in control tissues, a large net baseline oxalate absorptive flux is seen in ob tissues, which is mainly due to a significant reduction in JSM (* P < 0.007 and < 1.6E−10 for ob mice compared with Controls, with regards to JSM and Jnet, respectively, by unpaired t-test).
Fig. 7
Fig. 7
Effect of dietary oxalate removal on urinary oxalate levels in the ob/ob (ob) mice and their lean controls. Urinary oxalate levels were assessed as described in Methods in ob and control mice consuming oxalate-containing diet (Regular Diet) or an oxalate-free diet. The oxalate-free diet significantly reduced urinary oxalate levels in the ob mice (* P < 8.2E−12 for the ob mice on the oxalate-free diet compared with the regular diet, by unpaired t-test, n = 7–10).
Fig. 8
Fig. 8
Plasma and jejunal cytokines levels in the ob/ob (ob) mice and their lean controls. A: Plasma TNF-α (TNF), IFN-γ(IFN), and IL-6 levels were measured as described in the Methods. Values are means ± SD of 10–19 independent measurements each of which was done in duplicate. The ob mice have significantly higher plasma TNF, IFN, and IL-6 levels (* P < 0.002, 3.2E−06, and 1.4E−09 for ob compared with Controls, with regards to TNF, IFN, IL-6, respectively, by unpaired t-test). B: Jejunal total RNA was isolated from the ob mice and their controls for real-time PCR analysis. Values are means ± SD of 7–11 independent experiments each of which was done in triplicate. Relative TNF, IFN, and IL-6 mRNA expression levels were expressed as a percentage of Control normalized to GAPDH. The ob mice have significantly higher jejunal wall TNF and IFN mRNA expression levels (* P < 0.002 and 0.008 for ob compared with Controls, with regards to TNF and IFN, respectively, by unpaired t-test).
Fig. 9
Fig. 9
Effect of TNF-α, IFN-γ, IL-β, and IL-6 on apical 14C-oxalate uptake by Caco2-BBE (C2) cells. C2 cells were treated basolaterally with TNF-α (25 ng/ml × 48 h), IFN-γ, IL-β, or IL-6 (50 ng/ml × 48 h), or vehicle (Control) and then14C-oxalate uptake was measured as described in Methods. Values are means ± SD of 7 independent experiments each of which was done in triplicate and was normalized to the respective Control value. TNF-α, IFN-γ, and IL-6 significantly inhibited 14C-oxalate uptake (* P < 0.001 for TNF-α, IFN-γ, and IL-6 compared with Control or IL-β, by ANOVA).
Fig. 10
Fig. 10
Effect of TNF-α (TNF), IFN-γ(IFN), and IL-6 on SLC26A6 (A6) mRNA expression in Caco2-BBE (C2) cells. C2 cells were treated basolaterally with TNF (25 ng/ml × 48 h), IFN or IL-6 (50 ng/ml × 48 h), or vehicle (Control), and then total RNA was isolated for real-time PCR analysis. Values are means ± SD of 5–6 independent experiments each of which was done in triplicate. Relative A6 mRNA expression level was expressed as a percentage of Control normalized to GAPDH. TNF and IFN significantly reduced A6 mRNA expression level (* P < 0.05 for TNF and IFN compared with Control, by ANOVA).
Fig. 11
Fig. 11
Effect of TNF-α (TNF) and IFN-γ(IFN) on SLC26A6 (A6) total protein expression in Caco2-BBE (C2) cells. A: A representative Western blot analysis of total A6 protein expression. A6 protein expression was evaluated in C2 cell lysate (10 μg protein/lane: CON, TNF, and IFN = C2 cells treated with vehicle, TNF, and IFN, respectively). The lower part of the same blot was probed with an anti-GAPDH antibody to normalize loading of protein in each lane (lower panel). B: Densitometry of immunoblot results. Western blot band density was quantified using ImageJ software. Values are means ± SD for 4 independent experiments (blots shown in Supplementary Fig. S2) of relative total A6 abundance to GAPDH and are presented as a percentage of the Control value. TNF and IFN significantly reduced A6 protein expression (* P < 0.01 for TNF and IFN compared with Control, by ANOVA).
Fig. 12
Fig. 12
Unidirectional [mucosa to serosa = JMS (absorptive flux), and serosa to mucosa = JSM (secretory flux)] and net (Jnet) transepithelial oxalate fluxes across jejunal tissues (n = 11 tissue pairs) isolated from vehicle - and TNF-α-treated BALB/c mice and mounted ex vivo in modified Ussing chambers. TNF-α caused significant inhibition of jejunal active transcellular oxalate secretion (JSM), converting oxalate transport from net secretion in vehicle-treated tissues to net absorption in TNF-α-treated tissues (* P < 0.011 and < 0.0008 for TNF-α-treated tissues compared with vehicle-treated tissues, with regards to JSM and Jnet, respectively, by unpaired t-test).

Comment in

References

    1. Alexander RT, Hemmelgarn BR, Wiebe N, et al. Kidney stones and kidney function loss: a cohort study. Bmj. 2012;345:e5287. - PMC - PubMed
    1. Coe FL, Evan A, Worcester E. Kidney stone disease. The Journal of clinical investigation. 2005;115:2598–2608. - PMC - PubMed
    1. Curhan GC, Taylor EN. 24-h uric acid excretion and the risk of kidney stones. Kidney international. 2008;73:489–496. - PubMed
    1. Gorbachinsky I, Akpinar H, Assimos DG. Metabolic syndrome and urologic diseases. Rev Urol. 2010;12:e157–180. - PMC - PubMed
    1. Rendina D, Mossetti G, De Filippo G, et al. Association between metabolic syndrome and nephrolithiasis in an inpatient population in southern Italy: role of gender, hypertension and abdominal obesity. Nephrology, dialysis, transplantation: official publication of the European Dialysis and Transplant Association - European Renal Association. 2009;24:900–906. - PubMed

Publication types

MeSH terms