

Declining comorbidity-adjusted mortality rates in English patients receiving maintenance renal replacement therapy
- PMID: 29395337
- PMCID: PMC5912929
- DOI: 10.1016/j.kint.2017.11.020
Declining comorbidity-adjusted mortality rates in English patients receiving maintenance renal replacement therapy
Abstract
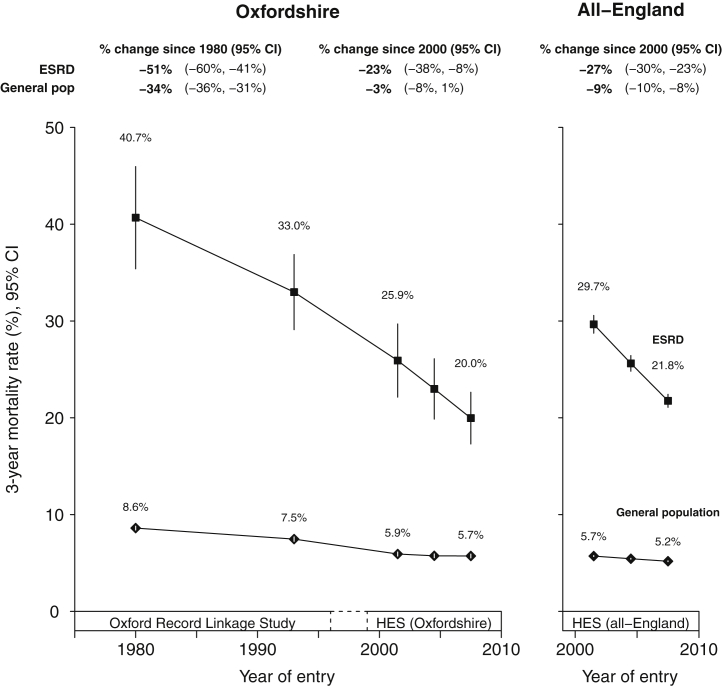
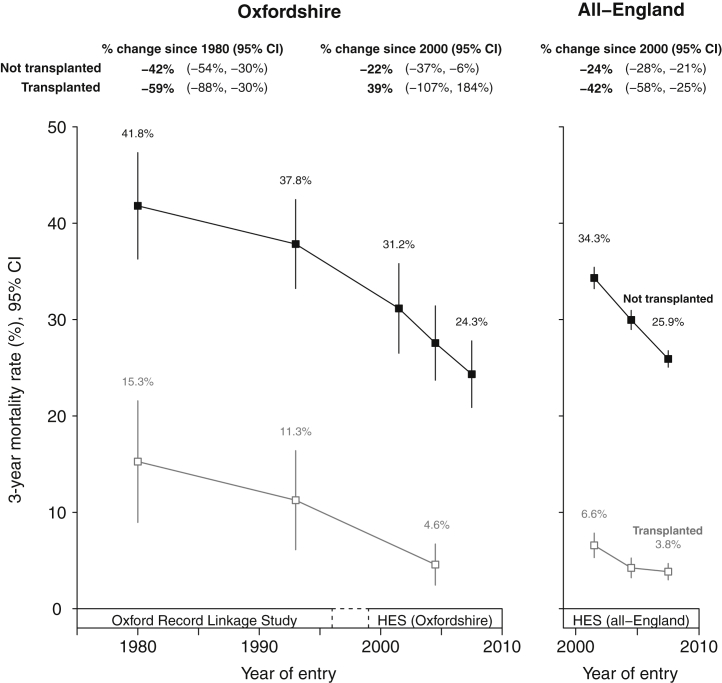
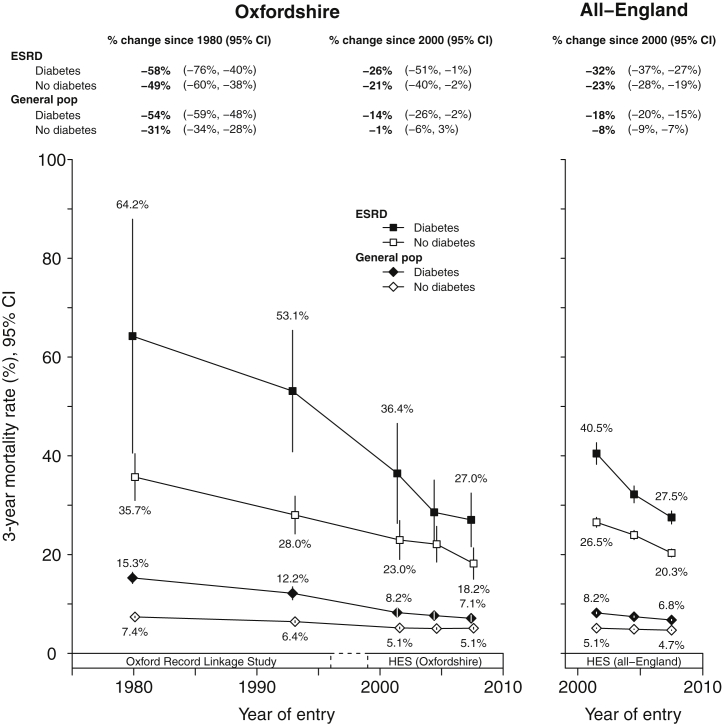
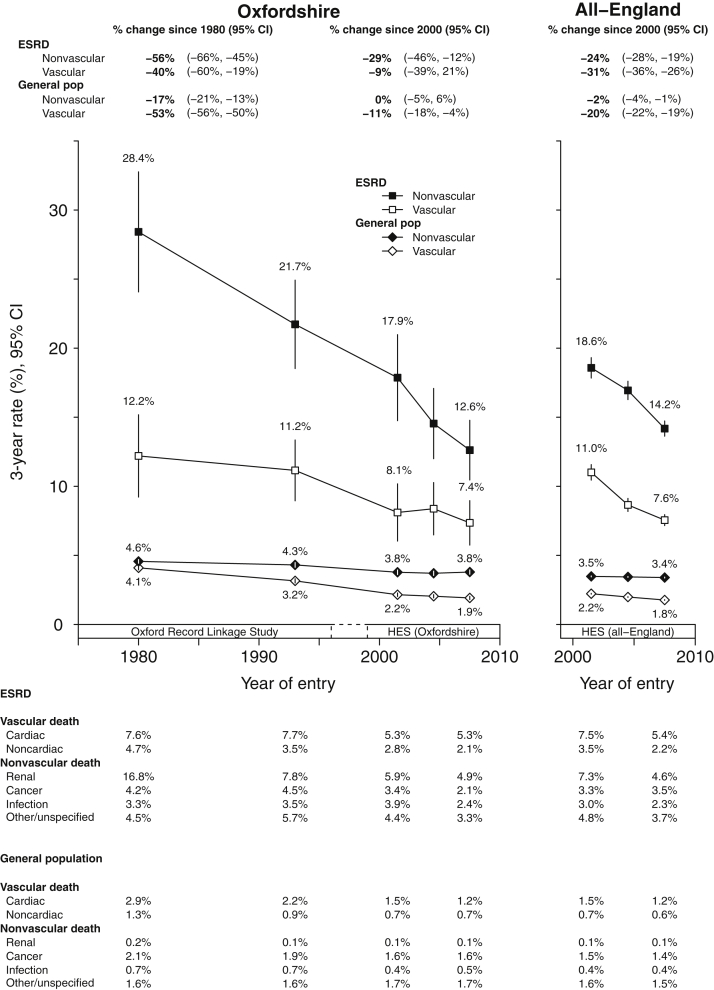
We aimed to compare long-term mortality trends in end-stage renal disease versus general population controls after accounting for differences in age, sex and comorbidity. Cohorts of 45,000 patients starting maintenance renal replacement therapy (RRT) and 5.3 million hospital controls were identified from two large electronic hospital inpatient data sets: the Oxford Record Linkage Study (1965-1999) and all-England Hospital Episode Statistics (2000-2011). All-cause and cause-specific three-year mortality rates for both populations were calculated using Poisson regression and standardized to the age, sex, and comorbidity structure of an average 1970-2008 RRT population. The median age at initiation of RRT in 1970-1990 was 49 years, increasing to 61 years by 2006-2008. Over that period, there were increases in the prevalence of vascular disease (from 10.0 to 25.2%) and diabetes (from 6.7 to 33.9%). After accounting for age, sex and comorbidity differences, standardized three-year all-cause mortality rates in treated patients with end-stage renal disease between 1970 and 2011 fell by about one-half (relative decline 51%, 95% confidence interval 41-60%) steeper than the one-third decline (34%, 31-36%) observed in the general population. Declines in three-year mortality rates were evident among those who received a kidney transplant and those who remained on dialysis, and among those with and without diabetes. These data suggest that the full extent of mortality rate declines among RRT patients since 1970 is only apparent when changes in comorbidity over time are taken into account, and that mortality rates in RRT patients appear to have declined faster than in the general population.
Keywords: RRT; epidemiological; mortality trends.
Copyright © 2017 International Society of Nephrology. Published by Elsevier Inc. All rights reserved.
Figures
Comment in
-
Uncovering real mortality trends in ESRD patients.Kidney Int. 2018 May;93(5):1040-1043. doi: 10.1016/j.kint.2018.01.002. Kidney Int. 2018. PMID: 29680020
References
-
- Anon. (Editorial). Profit and loss in intermittent haemodialysis. Lancet. 1965;2:1058–1059.
-
- Anon. (Editorial). Intermittent Haemodialysis. Lancet. 1962;279:2.
-
- Crowther S.M., Reynolds L.A., Tansey E.M., editors. History of Dialysis in the UK: c. 1950-1980. Wellcome Trust Centre; London: 2009. Wellcome Witnesses to Twentieth Century Medicine; No. 37.
-
- Caskey F., Castledine C., Dawnay A. UK Renal Registry: 18th Annual Report of the Renal Association 2015. Nephron. 2016;132(Suppl 1) - PubMed
Publication types
MeSH terms
Grants and funding
LinkOut - more resources
Full Text Sources
Other Literature Sources
Medical
