. 2018 Feb 6;26(2):259-269.e5.
doi: 10.1016/j.str.2017.12.013. Epub 2018 Jan 27.

Structural Connection between Activation Microswitch and Allosteric Sodium Site in GPCR Signaling

Affiliations

Structural Connection between Activation Microswitch and Allosteric Sodium Site in GPCR Signaling

Kate L White et al. Structure. .

Abstract

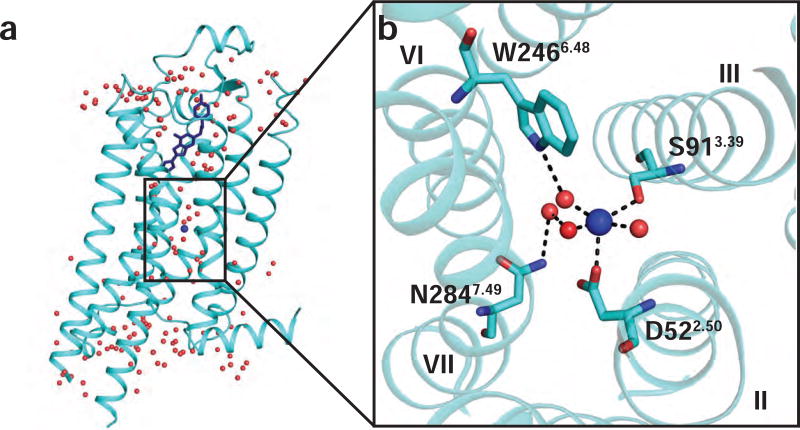
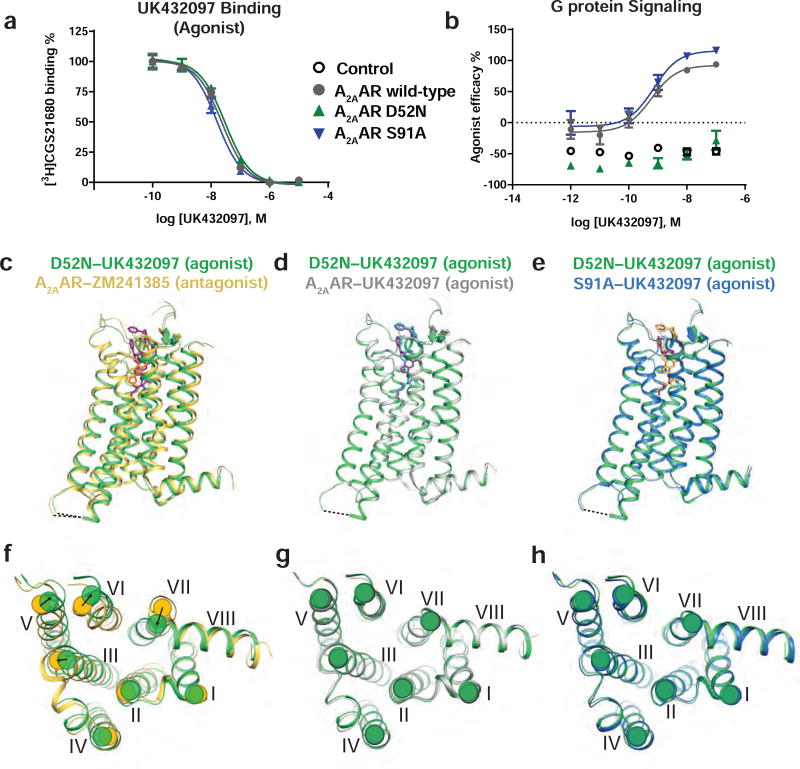
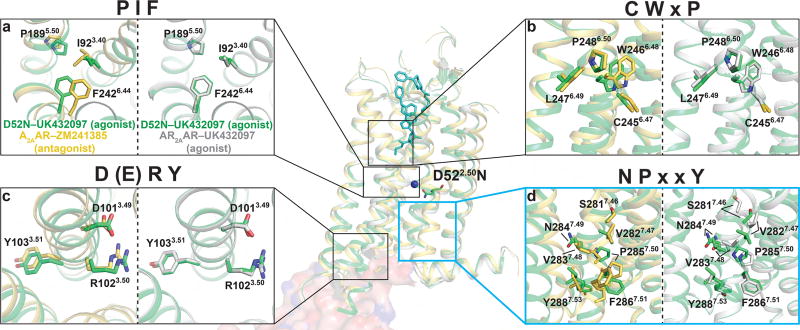
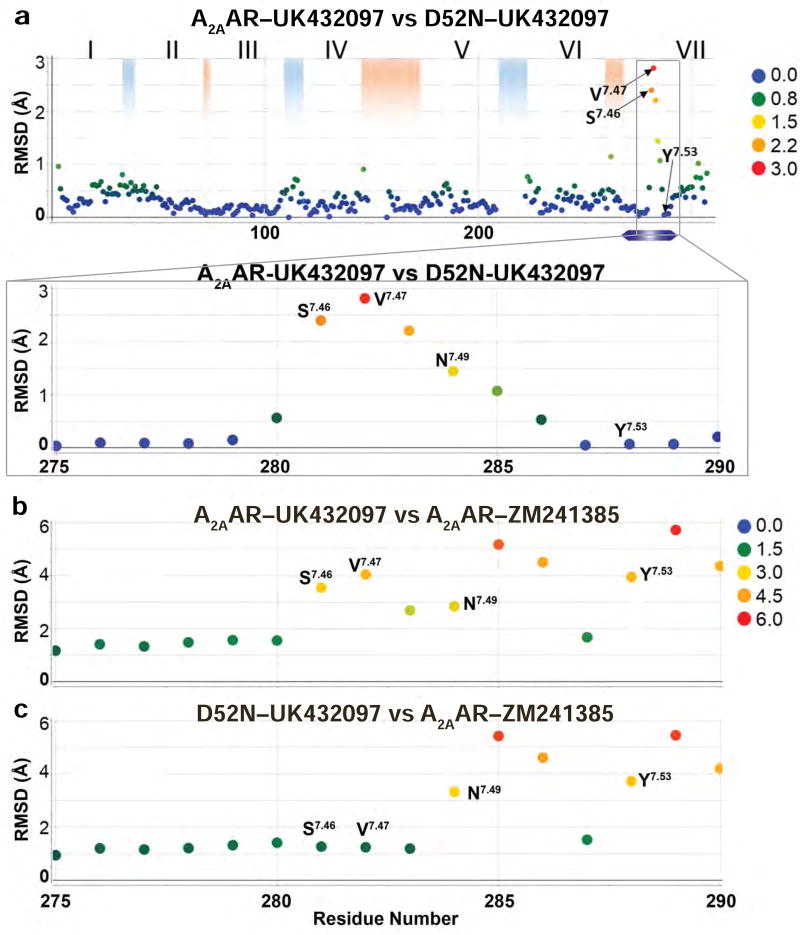
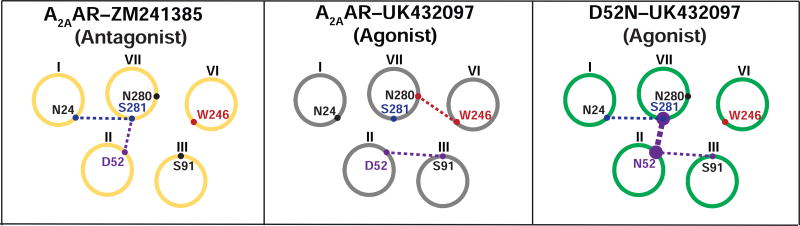
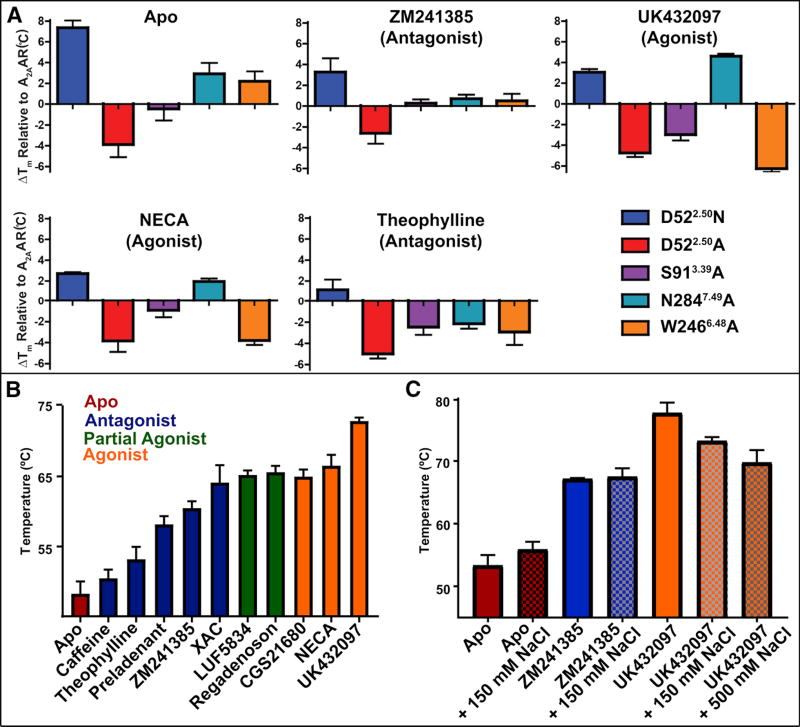
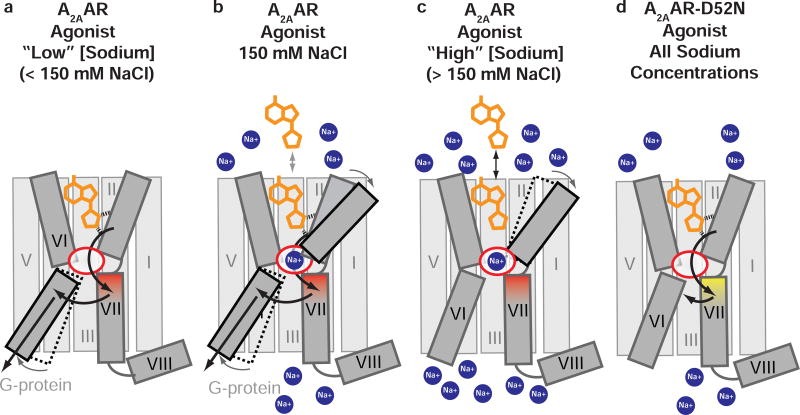
Sodium ions are endogenous allosteric modulators of many G-protein-coupled receptors (GPCRs). Mutation of key residues in the sodium binding motif causes a striking effect on G-protein signaling. We report the crystal structures of agonist complexes for two variants in the first sodium coordination shell of the human A2A adenosine receptor, D522.50N and S913.39A. Both structures present an overall active-like conformation; however, the variants show key changes in the activation motif NPxxY. Changes in the hydrogen bonding network in this microswitch suggest a possible mechanism for modified G-protein signaling and enhanced thermal stability. These structures, signaling data, and thermal stability analysis with a panel of pharmacological ligands provide a basis for understanding the role of the sodium-coordinating residues on stability and G-protein signaling. Utilizing the D2.50N variant is a promising method for stabilizing class A GPCRs to accelerate structural efforts and drug discovery.

Keywords: GPCR; adenosine receptor; allosteric modulators; cell signaling; crystallography; sodium binding; structural biology.


Conflict of interest statement

Declaration of Interests

Authors have no conflicts of interests.

Figures

Figure 1
Figure 1. Allosteric sodium binding pocket and sodium coordinating residues in the 1.8 Å A2AAR crystal structure
(a) Side view of the overall crystal structure of A2AAR in complex with the antagonist ZM241385. A2AAR is shown as cartoon representation and ZM241385 is shown in blue stick representation (PDB ID 4EIY) (Liu et al., 2012). Water molecules are shown as red spheres and sodium is shown as a blue sphere. (b) Expansion of the allosteric sodium pocket. Sodium is shown near the center as a blue sphere and water molecules are shown as red spheres. Residues coordinating with the sodium ion or nearby water molecules are labeled. Dashed lines indicate polar contacts and helices are labeled with Roman numerals.
Figure 2
Figure 2. Functional and structural comparisons of A2AAR with the variants A2AAR–D52N and A2AAR–S91A
(a) UK432097 competition binding with [3H] CGS21680 and (b) cAMP accumulation upon stimulation with UK432097. Data in (a) and (b) are shown as means ± S.D. Experiments were conducted three times, each in triplicate. A2AAR is shown in grey, A2AAR–D52N is shown in green, and A2AAR–S91A is shown in blue. (c–e) Superposition of side views of the overall structure of D52N–UK432097 (green) with (c) A2AAR–ZM241385 (yellow; PDB ID 3EML), (d) A2AAR–UK432097 (grey; PDB ID 3QAK), and (e) S91A–UK432097 (blue). The dashed line between helices V and VI indicates the position of the T4L fusion protein. Ligands are colored as follows: ZM241385 in orange, UK432097 bound to D52N–UK432097 in purple, UK432097 bound to A2AAR in cyan, and UK432097 bound to S91A–UK432097 in yellow. (f–h) Intracellular views of D52N–UK432097 superimposed on (f) A2AAR–ZM241385, (g) A2AAR–UK432097, and (h) S91A–UK432097; with the same coloring scheme used in panels (c–e). Helices are numbered with Roman numerals. In (f), arrows indicate rearragnements in the positions of helices at the intracellular surface between A2AAR–ZM241385 and D52N–UK432097. See also Figures S1 and S2 and Table 2.
Figure 3
Figure 3. Residues in the NPxxY motif of D52N–UK432097 are neither in an entirely inactive or active-like conformation
(a–d) Four conserved structural motifs (i.e. microswitches) labeled according to the amino acid types found in each motif. Within each panel, a superposition of A2AAR–ZM241385 (yellow; PDB ID 3EML) with D52N–UK432097 (green) is on the left, and a superposition of A2AAR–UK432097 (grey; PDB ID 3QAK) with D52N–UK432097 (green) is on the right. Amino acids comprising each structural motif are shown in stick representation and labeled by the Ballesteros-Weinstein nomenclature. Positions of the microswitches in the global structures are indicated by boxes in the middle superposition of all three structures. The location of residue D52N is indicated in the global view of the structure and labeled. Additionally, the binding sites of the orthosteric ligand (UK432097, cyan sticks), sodium (blue sphere), and G protein are shown in the center composite panel, where a surface representation of the mini Gαs and its contacts with A2AAR from the previously published A2AAR–NECA–mini Gαs complex structure (PDB ID 5G35) (Carpenter et al., 2016) are shown. See also Figure S2.
Figure 4
Figure 4. Comparison of the positions of Cα atoms between A2AAR–UK432097, D52N–UK432097, and A2AAR–ZM241385
All three structures were aligned globally and the root-mean-square deviation (RMSD) was calculated between Cα atoms of the same residue number between (a) A2AAR–UK432097 and D52N–UK432097 and (b) A2AAR–UK432097 and A2AAR–ZM241385, and (c) D52N–UK432097 and A2AAR–ZM241385. Residue number is plotted on the horizontal axis and RMSD is plotted on the vertical axis. The observed RMSDs are colored according to the legends in the figure panels. Roman numerals indicate helix numbers, blue shading indicates positions of intracellular loops, and red shading indicates positions of extracellular loops.
Figure 5
Figure 5. Comparison of hydrogen bonding networks in A2AAR–ZM241385, A2AAR–UK432097, and D52N–UK432097
A schematic is presented of cross sectional views of helices I–III, VI, and VII, indicated by circles with Roman numerals. Amino acids involved in hydrogen bonding between helices are indicated by colored dots on each circle and labeled. Dashed lines between helices indicate the presence of a hydrogen bond, and the thickness of the dashed line indicates the number of hydrogen bonds (i.e., two hydrogen bonds between N52 and S281 are observed in D52-UK432097 and only one is observed in A2AAR-ZM241385). See also Figures S3 and S4.
Figure 6
Figure 6. Thermal stability and function of A2AAR and allosteric site variants
(a) Fluorescence thermal shift assays for A2AAR-BRIL and variants in complex with 5 different ligands and for no ligand added (apo). The mean changes in melting temperature (ΔTm) relative to A2AAR are displayed with error bars representing S.E.M. (n = 3) and performed at 150 mM NaCl. Tm values are listed in Table S1 and statistical analysis shown in Figure S5. (b) Tm values calculated from fluorescence thermal shift assays for A2AAR (without a fusion partner protein) for complexes with 10 ligands and apo. Ligands are identified below each column and the assay was performed at 75 mM NaCl. (c) Tm values for A2AAR-BRIL complexes with ligands in the absence (solid bars) and presence (checkered bars) of sodium (150 mM or 500 mM), as indicated. See also Figure S6.
Figure 7
Figure 7. Schematic of effects of a range of sodium concentrations on A2AAR agonist recognition and binding and proposed mechanism of D52N mutation on G protein signaling
A2AAR is shown in grey in complex with an agonist (orange) in the presence of (a) low sodium concentration (< 150 mM), (b) physiologically-relevant sodium concentration (150 mM), and (c) high sodium concentration (> 150 mM). The allosteric sodium pocket is shown as a red oval in the center of the protein. Sodium ions are shown as blue circles. (a) Highlights a hypothetical pathway of signal transduction from the orthosteric ligand binding pocket through the NPxxY motif in helix VII, shaded in red, to the intracellular surface of helix VI. (a–c) Highlights the allosteric effect of sodium on agonist binding. (d) A2AAR–D52N in complex with an agonist and is not affected by sodium concentration. The NPxxY motif is shaded in yellow, reflecting the structural changes observed in the crystal structure of D52N–UK432097, and arrows indicate incomplete transfer of signal from the orthosteric ligand binding pocket.

References

    1. Alexandrov AI, Mileni M, Chien EYT, Hanson MA, Stevens RC. Microscale Fluorescent Thermal Stability Assay for Membrane Proteins. Structure. 2008;16:351–359. - PubMed
    1. Ballesteros JA, Weinstein H. Integrated methods for the construction of three-dimensional models and computational probing of structure-function relations in G proteincoupled receptors. Methods Neurosci. 1995;25:366–428.
    1. Bonneau O, Wyss D, Ferretti S, Blaydon C, Stevenson CS, Trifilieff A. Effect of adenosine A2A receptor activation in murine models of respiratory disorders. Am J Physiol Lung Cell Mol Physiol. 2006;290:L1036–1043. - PubMed
    1. Borroto-Escuela DO, Romero-Fernandez W, García-Negredo G, Correia PA, Garriga P, Fuxe K, Ciruela F. Dissecting the conserved NPxxY motif of the M3 muscarinic acetylcholine receptor: critical role of Asp-7.49 for receptor signaling and multiprotein complex formation. Cell Physiol Biochem. 2011;28:1009–1022. - PubMed
    1. Bouley R, Sun TX, Chenard M, McLaughlin M, McKee M, Lin HY, Brown D, Ausiello DA. Functional role of the NPxxY motif in internalization of the type 2 vasopressin receptor in LLC-PK1 cells. Am J Physiol Cell Physiol. 2003;285:C750–C762. - PubMed

Publication types

MeSH terms

Substances