. 2018 Feb 20;48(2):313-326.e5.
doi: 10.1016/j.immuni.2018.01.008.

B Cell Receptor and CD40 Signaling Are Rewired for Synergistic Induction of the c-Myc Transcription Factor in Germinal Center B Cells

Affiliations

B Cell Receptor and CD40 Signaling Are Rewired for Synergistic Induction of the c-Myc Transcription Factor in Germinal Center B Cells

Wei Luo et al. Immunity. .

Abstract

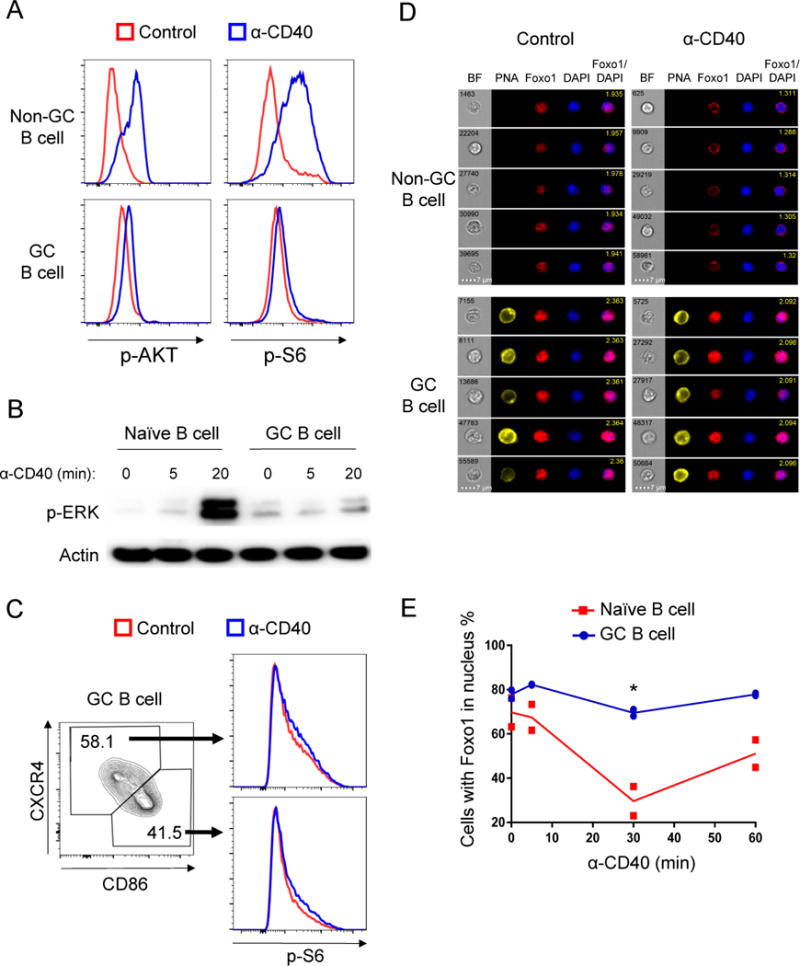
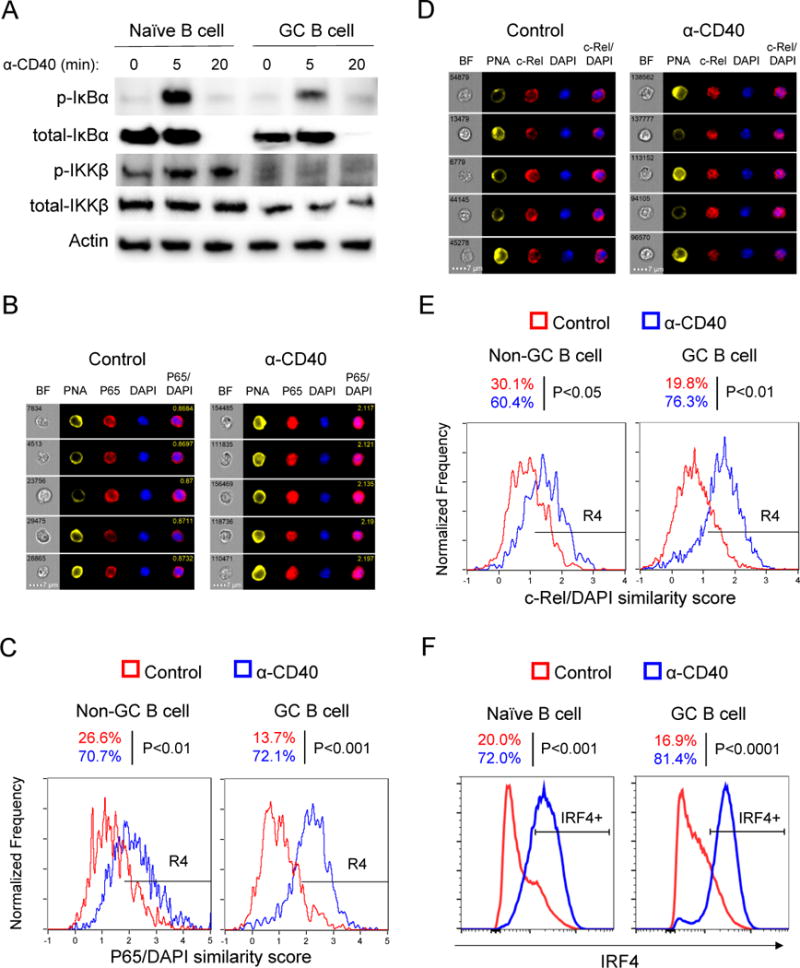
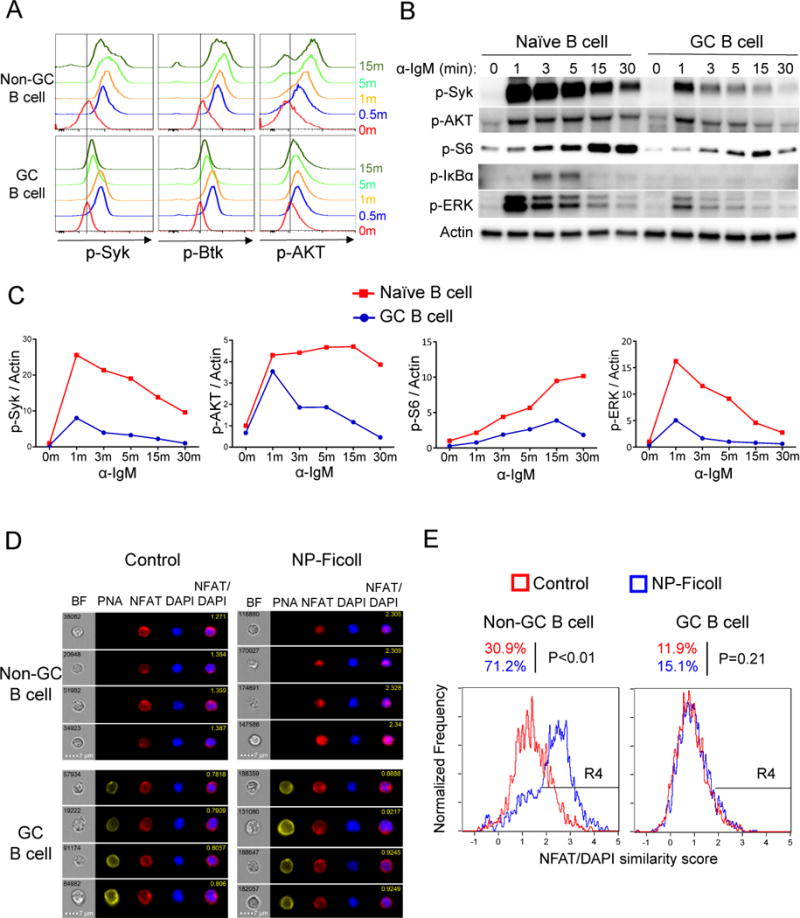
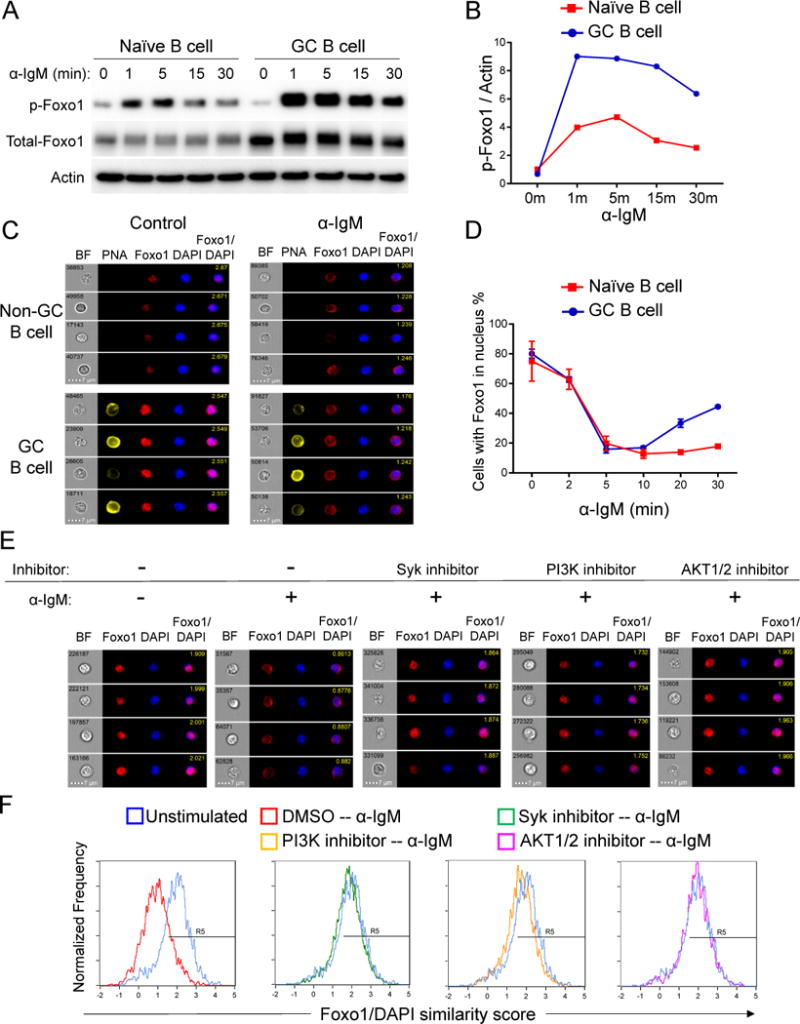
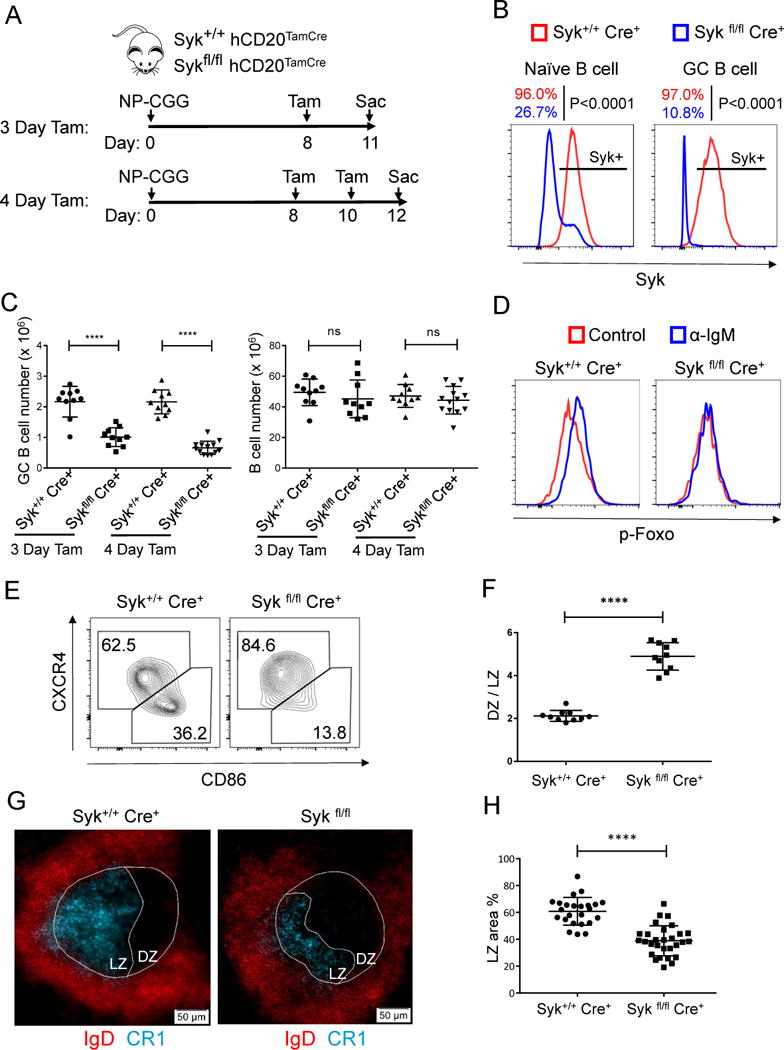
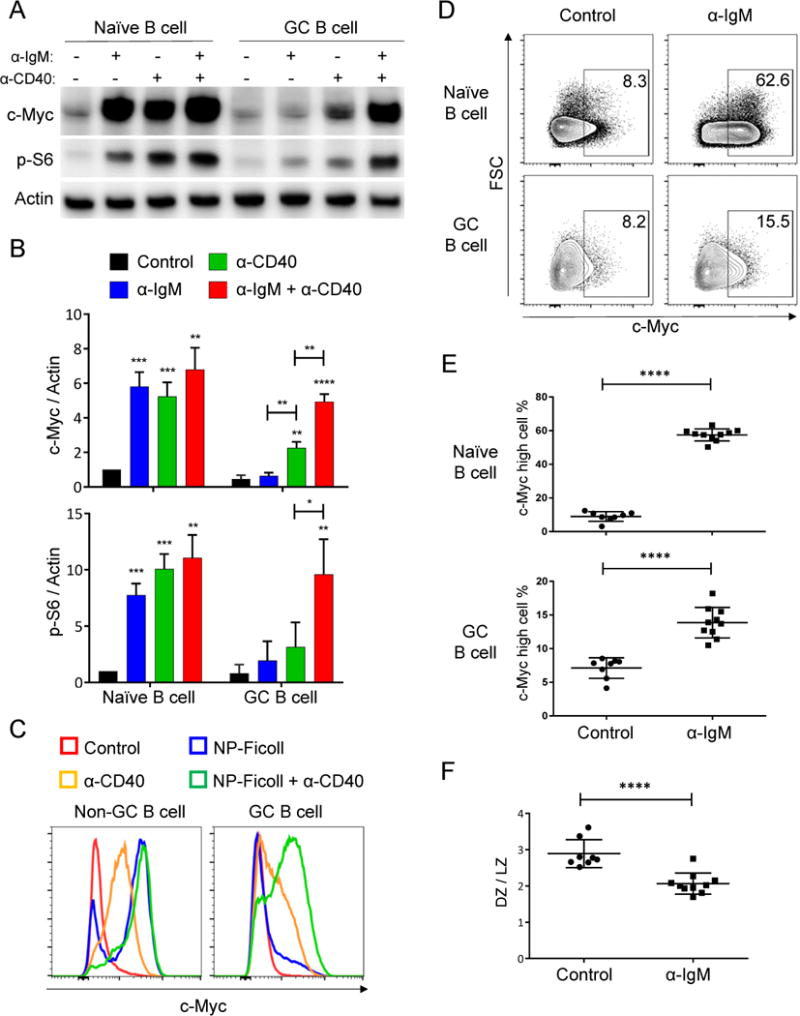
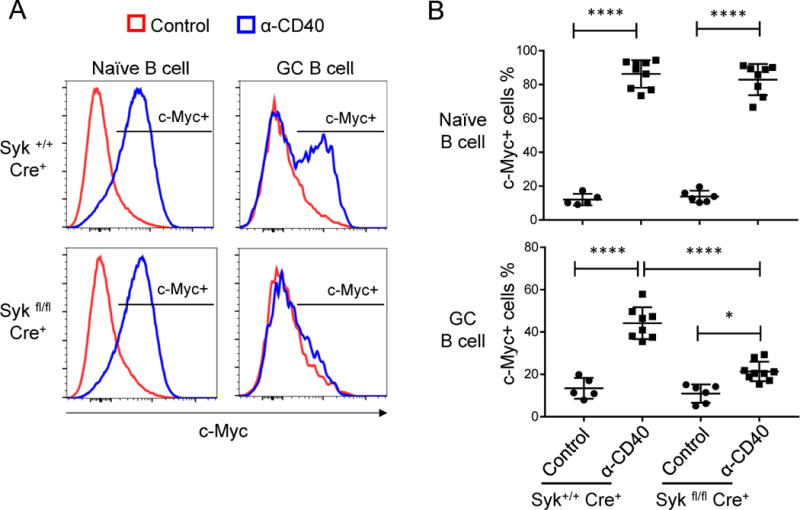
Positive selection of germinal center (GC) B cells is driven by B cell receptor (BCR) affinity and requires help from follicular T helper cells. The transcription factors c-Myc and Foxo1 are critical for GC B cell selection and survival. However, how different affinity-related signaling events control these transcription factors in a manner that links to selection is unknown. Here we showed that GC B cells reprogram CD40 and BCR signaling to transduce via NF-κB and Foxo1, respectively, whereas naive B cells propagate both signals downstream of either receptor. Although either BCR or CD40 ligation induced c-Myc in naive B cells, both signals were required to highly induce c-Myc, a critical mediator of GC B cell survival and cell cycle reentry. Thus, GC B cells rewire their signaling to enhance selection stringency via a requirement for both antigen receptor- and T cell-mediated signals to induce mediators of positive selection.

Keywords: Akt; B cell; B cell receptor; CD40; Foxo1; Myc; Syk; affinity maturation; germinal center.


Figures

Figure 1
Figure 1. AKT and ERK pathways are dampened in GC B cells stimulated by CD40 signals
(A) Splenocytes from day 14 NP-CGG immunized B1-8i mice were stimulated with anti-CD40 antibody or PBS (Control) for 20 min and stained for p-AKT (S473) and p-S6 (S235/236). Live Ig-lambda+ GC B cells (PNA+) and non-GC B cells (PNA) were gated. Histograms show representative examples of at least three independent experiments; spleen cell pools from two mice were tested in each experiment. (B) Magnetic bead-purified naïve B cells and GC B cells were stimulated with anti-CD40 antibody for 0, 5 and 20 minutes, cells were then harvested for western blot. Shown is one experiment representative of three independent experiments. (C) GC B cells were stimulated as described in (A) and were gated on LZ and DZ to compared p-S6. Data represent one of three independent experiments. (D and E) Splenocytes from NP-CGG immunized B1-8i mice were stimulated with anti-CD40 antibody for 0, 5, 30, 60 minutes. The localization of Foxo1 was examined by Amnis Imagestream cytometry. Two independent experiments were performed with cells pooled from two to three mice in each experiment. (D) Representative images of 30 min stimulated non-GC B cells and GC B cells captured by the Imagestream. Object number is shown in BF (Bright field) picture and similarity score is shown in merged picture (Foxo1/DAPI). (E) Histogram showing the fraction of cells with nuclear Foxo1 (high Foxo1/DAPI similarity score). *P≤0.05 See also Figure S1.
Figure 2
Figure 2. CD40 signals specifically activate the NF-κB pathway
(A) Magnetic bead-purified naïve B cells and GC B cells were stimulated with anti-CD40 antibody for different time spans. Cell lysates were examined by western blot. Shown is one experiment representative of three independent experiments. Cells were purified from three or four mice in each experiment. (B-E) Splenocytes from immunized B1-8i or MEG mice were stimulated with anti-CD40 antibody or PBS (Control) for 30 min and localization of NF-κB subunits P65 (B-C) and c-Rel (D-E) was examined by Imagestream. (B and D) Representative images of GC B cells; (C and E) P65/DAPI and c-Rel/DAPI similarity score from Non-GC B cells and GC B cells are plotted, R4 gate represents cells with P65 (C) or c-Rel (E) in the nucleus (high similarity score). Three independent experiments were performed with similar results and similar results were observed in both B1-8i and MEG mouse models. (F) Total B cells from immunized MEG mice were cultured with CD40 antibody or PBS (Control) for 4 hours. IRF4 expression was examined by flow cytometry, gated on naïve or GC B cells. Three independent experiments were performed. See also Figure S1.
Figure 3
Figure 3. BCR signals selectively induce transient activation of Syk and AKT in GC B cells
(A) Total splenocytes pooled from two immunized MEG mice were stimulated with goat anti-IgM for different time periods. Cells were fixed, permeabilized and stained for p-Syk (Y352), p-Btk (Y223) and p-AKT (S473). Live Ig-lambda+ GC B cells (PNA+) and non-GC B cells (PNA) were gated. (B-C) Western blots were performed with bead-purified MEG naïve and GC B cells stimulated with anti-IgM antibody for different durations. Quantitation of western blot data are shown in (C) with signals normalized to actin and further normalized to naïve B cells at time 0 giving a value of 1. (D-E) Splenocytes from immunized B1-8i mice were stimulated with NP-Ficoll or PBS (Control) for 5 min. NFAT nuclear translocation was examined by Imagestream analysis. Representative images are shown in (D), and statistical analysis is shown in (E). R4 gates represent cells with nuclear NFAT translocation (high NFAT/DAPI similarity score). Data are representative results from one of three independent experiments with statistical analysis for all experiments.
Figure 4
Figure 4. BCR signals efficiently phosphorylate and inactivate Foxo1 through the PI3K-AKT pathway in GC B cells
(A) Magnetic bead-purified naïve and GC B cells were stimulated with anti-IgM antibody for indicated time spans, harvested and examined by western blot. Data are from one representative experiment of three independent experiments. Cells were purified from three to four MEG mice in each experiment. (B) Quantitation of western blot data in (A). Signal was normalized to actin and further normalized to naïve B cells at time 0, giving a value of 1. (C and D) Total splenocytes from MEG mice were stimulated with anti-IgM antibody for 0, 2, 5, 10, 20, 30 minutes. Localization of Foxo1 was examined by Imagestream. Two independent experiments were performed. Cells were pooled from 2 to 3 mice in each experiment. (C) Representative images of Non-GC B cells and GC B cells stimulated for 0 (Control) and 5 minutes; (D) Quantitation of cells with Foxo1 in the nucleus based on Foxo1/DAPI similarity score (mean ± SD). (E and F) Splenocytes from immunized MEG mice were treated with or without 5 M Syk inhibitor (BAY61-3606), 10 M PI3K inhibitor (Ly294002) or 5 M AKT1/2 kinase inhibitor for 30 min and then stimulated with anti-IgM antibody for 5 min. Localization of Foxo1 was examined by Amnis Imagestream. Two independent experiments were performed, and splenocytes were pooled from two to three mice in each experiment. (E) Representative images of GC B cells with Foxo1/DAPI similarity score shown in the merged picture; (F) Foxo1/DAPI similarity score is compared between control (DMSO treated with no stimulation) and treated cells. R5 gates represent cells with Foxo1 in nucleus (high Foxo1/DAPI similarity score).
Figure 5
Figure 5. Syk signaling is important in maintaining the GC light zone through inactivation of Foxo1 and is required for GC maintenance
(A) Time line illustration of tamoxifen (Tam) treatment for NP-CGG immunized Syk+/+ hCD20TamCre and Sykfl/fl hCD20TamCre mice. Mice were immunized with NP-CGG and given one dose of tamoxifen orally on day 8 post immunization and analyzed on Day 11 (3 days post tamoxifen); for 4-day tamoxifen treatment, tamoxifen were given on Day 8 and Day 10 post immunization and mice were analyzed on Day 12. (B) Mice were analyzed by flow cytometry for Syk expression levels in naïve and GC B cells 3 days post tamoxifen treatment. Shown is one representative histogram of Syk staining and statistical data represents seven mice from two independent experiments. (C) Splenocytes from (A) were analyzed by flow cytometry. GC B cells were gated as B220+ PNA+ CD95+ cells. At least three independent experiments were performed with total of 10 to 13 mice from each group tested (mean ± SD). ns, not significant; ****P≤ 0.0001. (D) Splenocytes from (A) (3 Day Tam) were stimulated with 20 g/ml anti-IgM antibody for 5 minutes, IgM GC B cells were gated and analyzed for p-Foxo by flow cytometry. Shown are representative histograms for three independent experiments. See also Figure S2B for statistical analysis. (E and F) Light zone (LZ) and dark zone (DZ) GC B cells from (A) (3 Day Tam) were identified by CD86 and CXCR4 staining. (E) Representative flow cytometry analysis of GC B cells; (F) Quantitation of flow cytometry data as the ratio of cells in the DZ to LZ per the gating in (E) (mean ± SD, n=10 for each group). (G-H) Spleen cryosections from (A) (3 Day Tam) were analyzed by immunofluorescent staining for GC (IgD and PNA) and light zone (CR1). (G) Representative images; (H) Statistical analysis of the percentage of LZ area in the GC (mean ± SD). Each dot represents one GC. Three to 5 typical GC from one spleen, and 6 to 8 mice in each group from 3 independent experiments were analyzed. *P≤0.05, **P≤0.01, ***P≤ 0.001, ****P≤0.0001 See also Figure S2
Figure 6
Figure 6. BCR and CD40 signals synergistically induce c-Myc and p-S6 in GC B cells
(A) Naïve and GC B cells were purified from MEG mice and cultured with indicated stimuli for 2 hours (unstimulated as Control), harvested and examined by western blot for c-Myc and p-S6 (S235/236). Data are results from one of three independent experiments. Cells were pooled from three to four mice in each experiment. (B) Quantitation of (A): c-Myc/actin ratio and p-S6/actin ratios were normalized to naïve B cells, with Control given a value of 1. (mean + SD, “ * ” on the bar shows significance compared to Control). (C) Total B cells were purified from immunized B1-8i mice and stimulated in vitro as indicated for 2 hours (unstimulated as Control). Cells were then fixed, permeabilized and examined by flow cytometry for c-Myc expression. One representative example of five independent experiments is shown. Similar results were obtained by using 2.5 μg/ml biotinylated CD40 antibody preincubated with streptavidin. (D and E) Day 10 NP-CGG immunized IgMi mice were injected intravenously with goat anti-IgM or goat IgG isotype control and sacrificed four hours after injection. Splenocytes were analyzed by flow cytometry for c-Myc expression in naïve and GC B cells. (D) Representative flow cytometry data. (E) Quantitation and statistical analysis of c-Myc high cells among naïve or GC B cells from flow cytometry data. (Control: n=8, α-IgM: n=10; each dot represents a single mouse with mean ± SD). (F) LZ and DZ distribution of GC B cells from (D) was analyzed by flow cytometry based on CD86 and CXCR4 expression (mean ± SD). *P≤0.05, **P≤0.01, ***P≤0.001, ****P ≤0.0001 See also Figure S3.
Figure 7
Figure 7. BCR signals are required for optimal c-Myc induction in GC B cells in vivo
(A-B) Syk+/+ hCD20TamCre and Sykfl/fl hCD20TamCre mice were immunized with NP-CGG. One dose of tamoxifen was administrated orally on day 8 post immunization. Mice at day 11 post immunization were injected intravenously with 50 μg of anti-CD40 antibody (FGK) or Isotype control (rat IgG2a) and analyzed 4 hours after injection. c-Myc expression was examined by flow cytometry and cells were gated on naïve B cells (B220+ CD38+ PNA) and GC B cells (B220+ CD38 PNA+). Representative flow cytometry data are shown in (A) and statistical analysis is shown in (B). Data represent three independent experiments with total of 5 to 9 mice from each treatment group (mean ± SD). *P≤0.05, **P≤0.01, ***P≤0.001, ****P≤0.0001 See also Figure S4.

References

    1. Al-Herz W, Bousfiha A, Casanova JL, Chatila T, Conley ME, Cunningham- Rundles C, Etzioni A, Franco JL, Gaspar HB, Holland SM, et al. Primary immunodeficiency diseases: an update on the classification from the international union of immunological societies expert committee for primary immunodeficiency. Frontiers in immunology. 2014;5:162. - PMC - PubMed
    1. Allen CD, Okada T, Cyster JG. Germinal-center organization and cellular dynamics. Immunity. 2007a;27:190–202. - PMC - PubMed
    1. Allen CD, Okada T, Tang HL, Cyster JG. Imaging of germinal center selection events during affinity maturation. Science. 2007b;315:528–531. - PubMed
    1. Calado DP, Sasaki Y, Godinho SA, Pellerin A, Kochert K, Sleckman BP, de Alboran IM, Janz M, Rodig S, Rajewsky K. The cell-cycle regulator c-Myc is essential for the formation and maintenance of germinal centers. Nat Immunol. 2012;13:1092–1100. - PMC - PubMed
    1. Cho SH, Raybuck AL, Stengel K, Wei M, Beck TC, Volanakis E, Thomas JW, Hiebert S, Haase VH, Boothby MR. Germinal centre hypoxia and regulation of antibody qualities by a hypoxia response system. Nature. 2016;537:234–238. - PMC - PubMed

Publication types

MeSH terms