. 2018 Mar 7;26(3):680-694.
doi: 10.1016/j.ymthe.2017.12.020. Epub 2017 Dec 24.

A New Role for the Mitochondrial Pro-apoptotic Protein SMAC/Diablo in Phospholipid Synthesis Associated with Tumorigenesis

Affiliations

A New Role for the Mitochondrial Pro-apoptotic Protein SMAC/Diablo in Phospholipid Synthesis Associated with Tumorigenesis

Avijit Paul et al. Mol Ther. .

Abstract

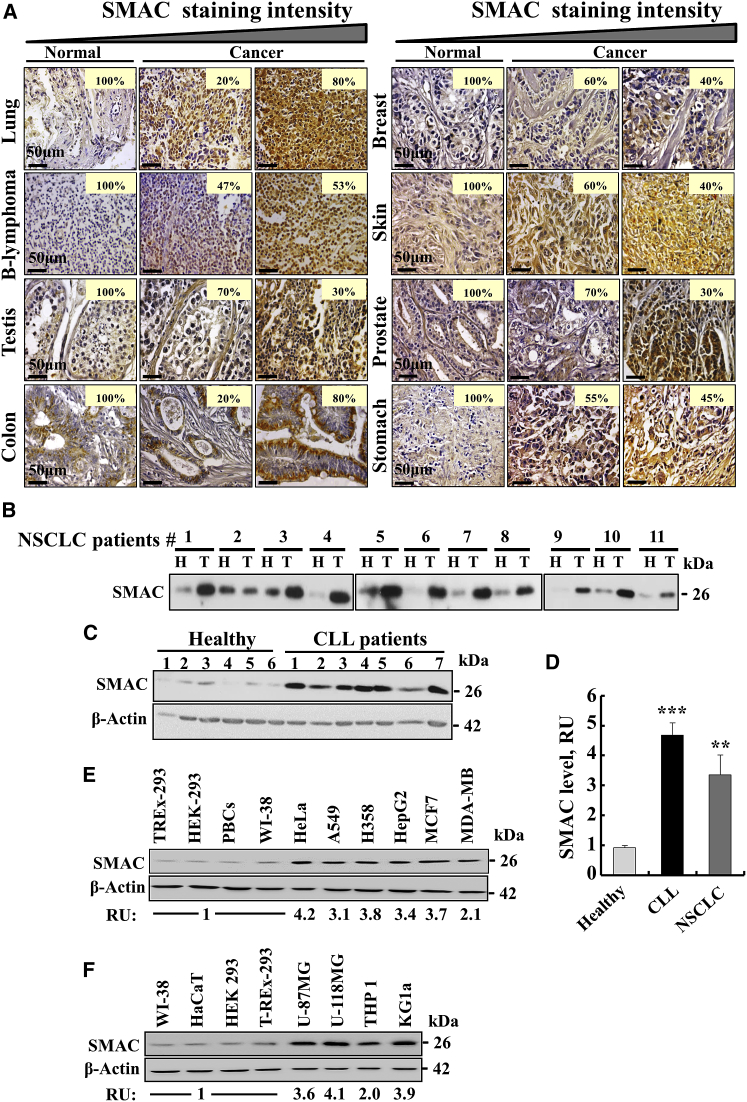
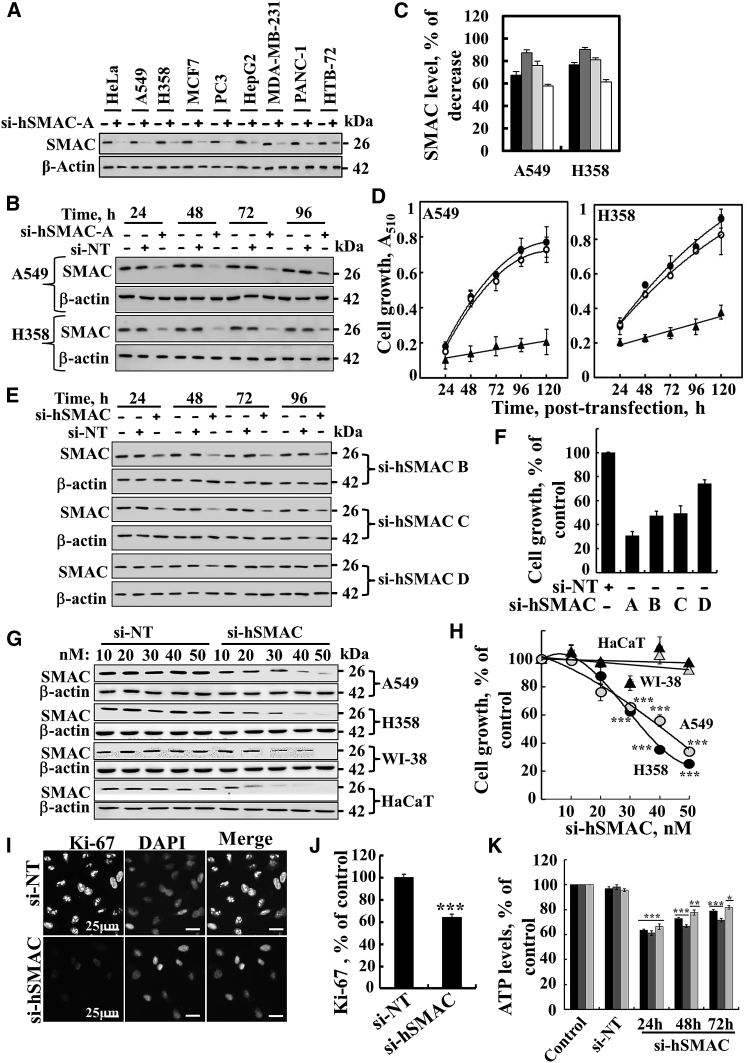
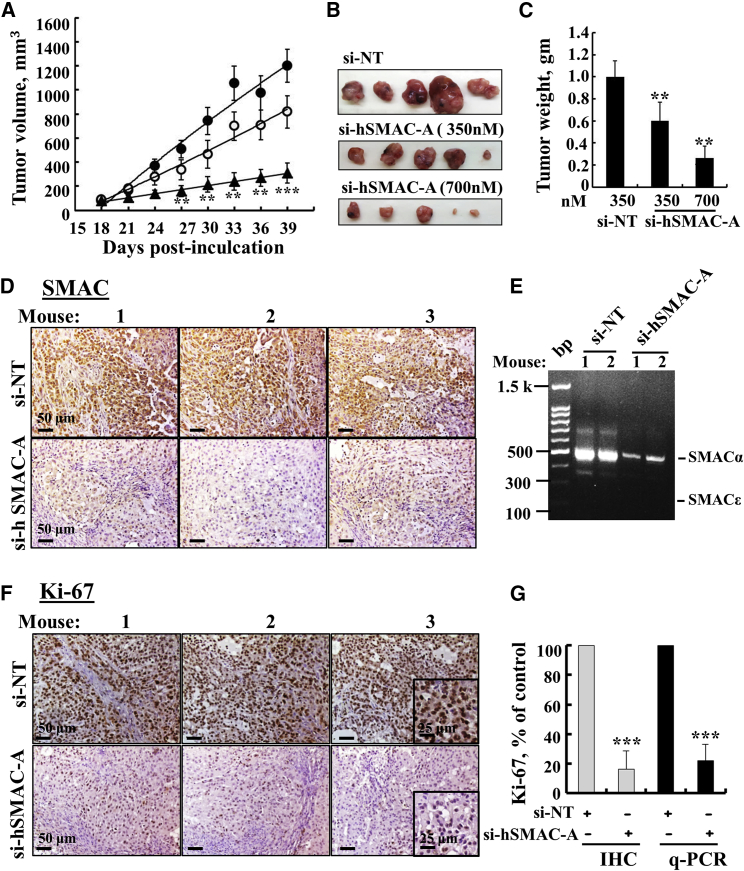
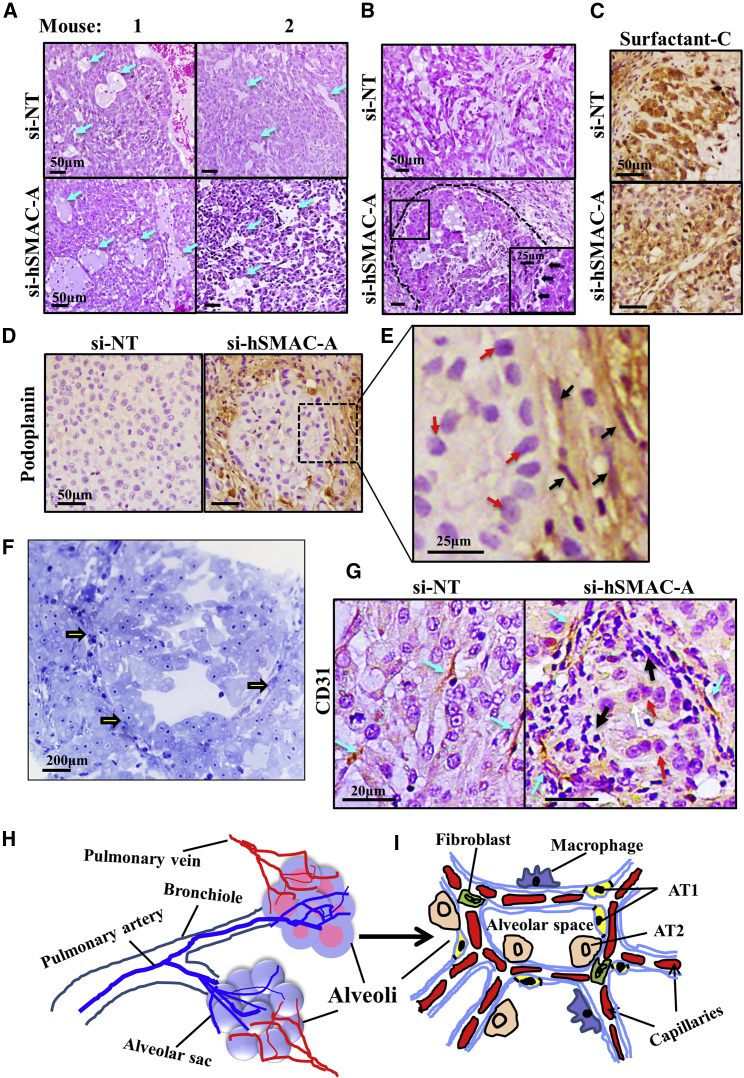
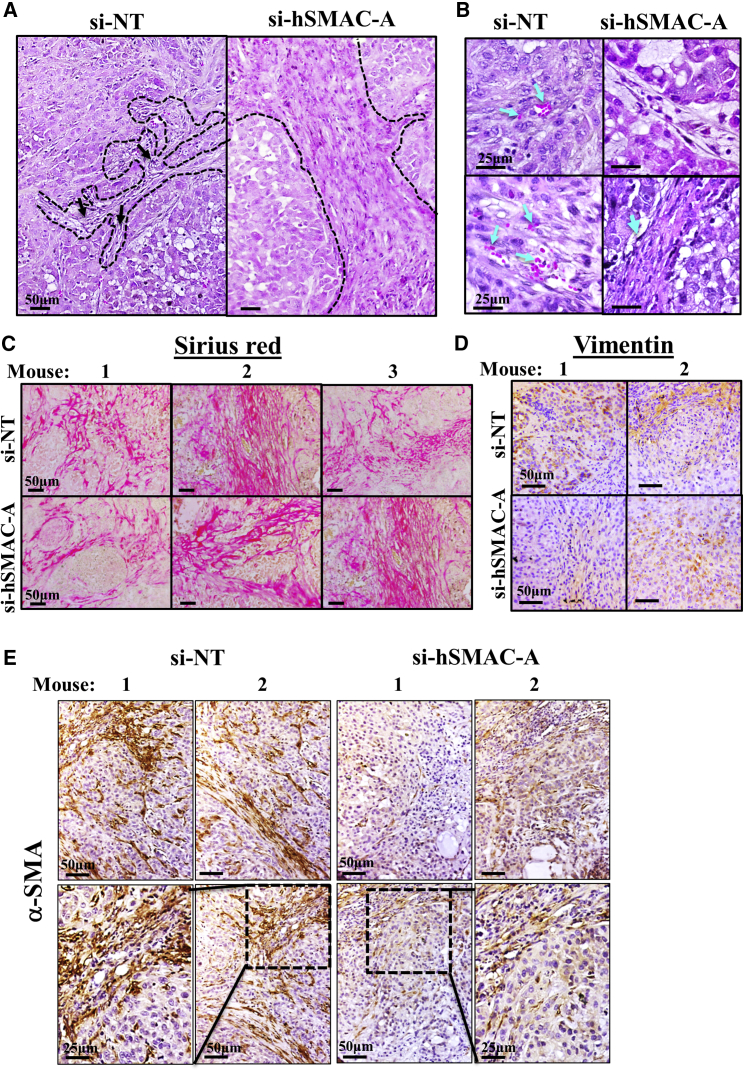
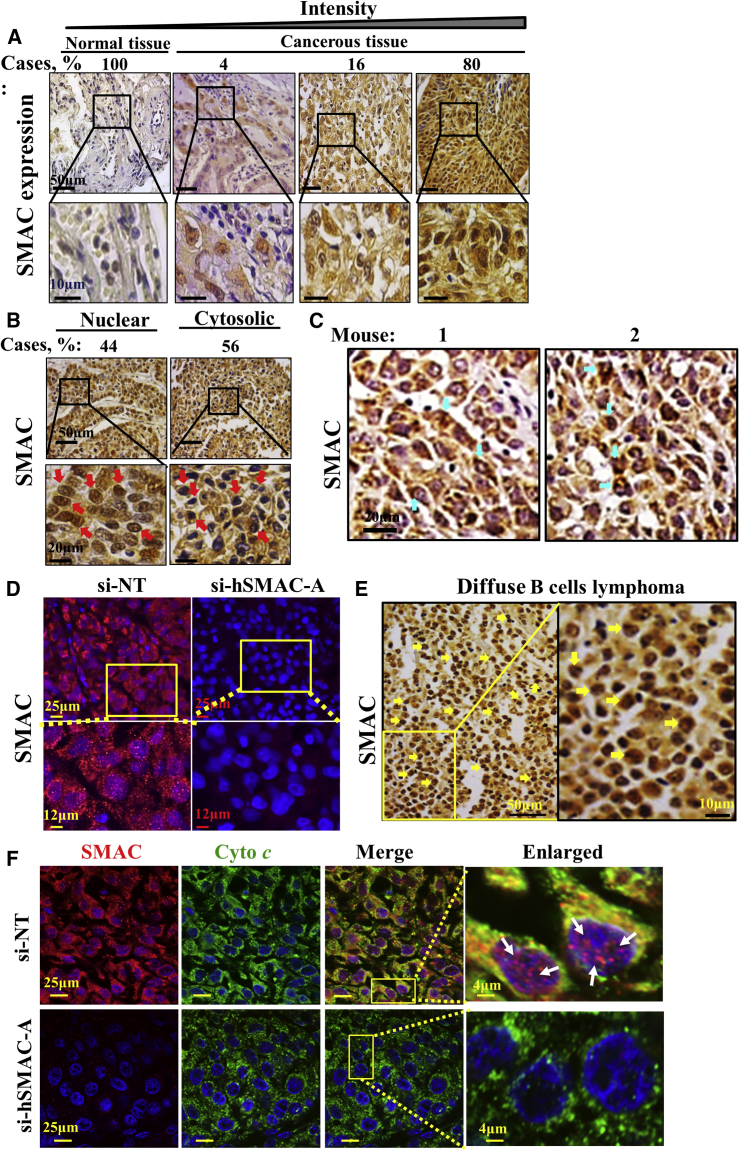
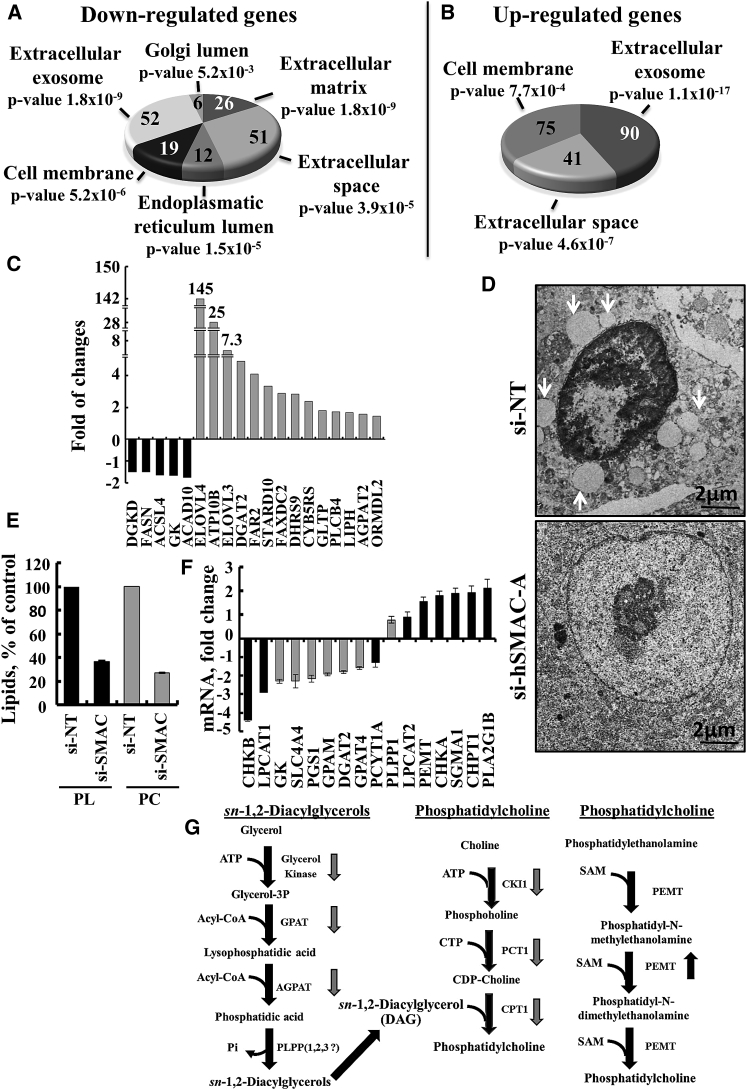
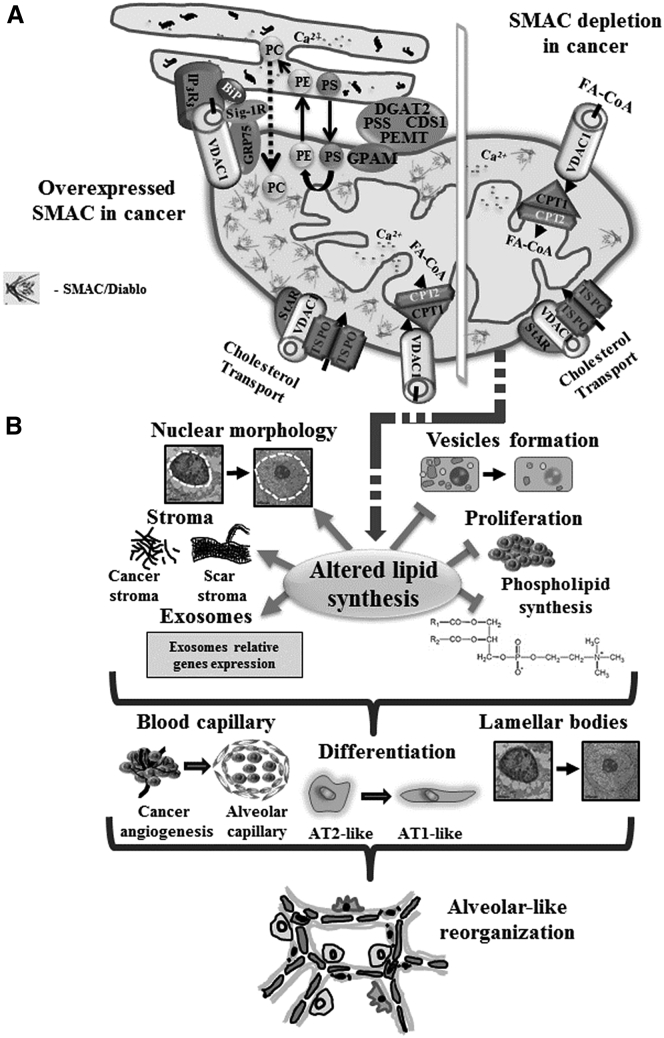
The mitochondrial pro-apoptotic protein SMAC/Diablo participates in apoptosis by negatively regulating IAPs and activating caspases, thus encouraging apoptosis. Unexpectedly, we found that SMAC/Diablo is overexpressed in cancer. This paradox was addressed here by silencing SMAC/Diablo expression using specific siRNA (si-hSMAC). In cancer cell lines and subcutaneous lung cancer xenografts in mice, such silencing reduced cell and tumor growth. Immunohistochemistry and electron microscopy of the si-hSMAC-treated residual tumor demonstrated morphological changes, including cell differentiation and reorganization into glandular/alveoli-like structures and elimination of lamellar bodies, surfactant-producing organs. Next-generation sequencing of non-targeted or si-hSMAC-treated tumors revealed altered expression of genes associated with the cellular membrane and extracellular matrix, of genes found in the ER and Golgi lumen and in exosomal networks, of genes involved in lipid metabolism, and of lipid, metabolite, and ion transporters. SMAC/Diablo silencing decreased the levels of phospholipids, including phosphatidylcholine. These findings suggest that SMAC/Diablo possesses additional non-apoptotic functions related to regulating lipid synthesis essential for cancer growth and development and that this may explain SMAC/Diablo overexpression in cancer. The new lipid synthesis-related function of the pro-apoptotic protein SMAC/Diablo in cancer cells makes SMAC/Diablo a promising therapeutic target.

Keywords: SMAC/Diablo; apoptosis; cancer; mitochondria; phospholipid synthesis.


Figures

Figure 1
Figure 1
SMAC/Diablo Is Overexpressed in Various Cell Lines and Types of Tumors (A) Representative IHC staining of SMAC/Diablo in normal (n = 5) and cancerous (n = 20) tissue samples from tissue microarray slides (US Biomax) containing normal and cancer sections from lung, B-lymphoma, testes, colon, breast, skin, prostate, and stomach. Case % represents the percentages of patient samples that stained for SMAC/Diablo at the intensities presented in the scale at the top of the figure. (B) Representative immunoblot staining of tissue lysates of healthy (H) and tumor (T) tissues with anti-SMAC/Diablo antibodies, with each pair of samples (H, T) being derived from the same patient lung. (C) Representative immunoblots showing SMAC/Diablo expression in PBMCs derived from CLL patients or healthy donors. As a loading control, actin levels were probed using anti-β-actin antibodies. (D) Quantitative analysis of immunoblots of SMAC/Diablo expression levels in PBMCs from CLL patients, as compared to healthy donors (means ± SEM, n = 10) and in the NSCLC tumor, in comparison to healthy tissue from the same patient (means ± SEM, n = 11), presented as fold increase. (E and F) SMAC/Diablo expression levels in different cell lines, with the levels in the cancer cells being presented relative to those in the non-cancerous cells (bottom of the blot). **p < 0.01; ***p < 0.001.
Figure 2
Figure 2
Silencing with si-hSMAC-A Inhibits Cell Growth (A) The indicated cancer cell lines were transfected with si-hSMAC-A (50 nM), and 48 hr post-transfection, levels of SMAC/Diablo in the cells were evaluated by immunoblotting. β-actin was used as a loading control. (B) A549 and H358 cells were transfected with si-NT or si-hSMAC-A, and at the indicated time, cells were harvested and analyzed for SMAC/Diablo levels by immunoblotting. β-actin was used as a loading control. In (C), quantitative analysis of the immunoblot was carried out (presented as % of decreased expression) for all cell lines at 24 (black bar), 48 (light gray bar), 72 (dark gray bar), and 96 hr (white bar) post-transfection (means ± SEM, n = 3). (D) A549 and H358 cells were untreated (filled circle) or transfected with si-NT (open circle) or si-hSMAC-A (50 nM) (filled triangle), and cell growth was assayed at the indicated times using the SRB method (means ± SEM, n = 3). (E) A549 cells were transfected with si-NT or si-hSMAC B, C, or D (50 nM), and at the indicated times, cells were harvested and analyzed for SMAC/Diablo levels by immunoblotting. β-actin was used as a loading control. (F) Bar graph represents inhibition of growth of A549 cells treated with si-NT or si-hSMAC B, C, or D (50 nM) (means ± SEM, n = 3). (G and H) The A549, H358, HaCaT, and WI-38 cell lines were transfected with the indicated concentrations (10–50 nM) of si-NT or si-hSMAC-A. After 48 hr, SMAC/Diablo levels in the cells were analyzed by immunoblotting (G), and cell growth was assayed (H) (means ± SEM, n = 3). (I) si-NT- or si-hSMAC-A (50 nM)-treated A549 cells were analyzed for Ki-67 expression using specific antibodies, while nuclei were stained with DAPI. (J) Quantitative analysis of Ki-67-positive cells (means ± SEM, n = 3). (K) Quantitative analysis of Ki-67 staining intensity performed using ImageJ software (means ± SEM, n = 3). ***p < 0.001.
Figure 3
Figure 3
si-hSMAC Inhibits Tumor Growth of Lung Cancer Xenografts (A) A549 cells were inoculated into nude mice (3 × 106 cells/mouse). Tumor volumes were monitored, and on day 18, mice with similar average volumes (75–90 mm3) were divided into three groups (means ± SEM, n = 5). Xenografts were injected with si-NT (filled circle; 350 nM) or si-hSMAC-A (350 nM [open circle] or 700 nM [filled triangle]). The sizes of the xenografts were measured, and average tumor volumes were calculated and are presented as means ± SEM, **p ≤ 0.01; ***p ≤ 0.001. Representative photographs (B) and weights (C) of dissected tumors from mouse A549 cell xenografts after treatment with si-NT or si-hSMAC-A (means ± SEM, n = 5). (D) Representative sections from si-NT- and si-hSMAC-A-TTs stained with anti-SMAC/Diablo antibodies. (E) Expression of α- and ε-SMAC/Diablo isoforms in RNA isolated from si-NT- and si-hSMAC-A-TTs was determined using qPCR and specific primers. (F) Representative sections from si-NT- and si-hSMAC-A-TTs stained with anti-Ki-67 antibodies. (G) Quantitative analysis of Ki-67-positive cells in IHC (gray bars) and mRNA (black bars) levels in si-NT-and si-hSMAC-A-TTs (means ± SEM, n = 3). ***p ≤ 0.001.
Figure 4
Figure 4
Morphological Changes Induced in Tumors Treated with si-hSMAC (A) Representative sections from si-NT- and si-hSMAC-A-TTs stained with H&E. (B) Enlarged images of representative sections from si-NT- and si-hSMAC-A-TTs stained with H&E, showing glandular-like clusters surrounded by a chain of cells (black arrows) in si-hSMAC-A-TTs. (C–E) Sections from si-NT- and si-hSMAC-A-TTs stained with anti-prosurfactant C (C) or anti-podoplanin antibodies (D). (E) Enlarged image of representative section from si-hSMAC-A-TTs stained with anti-podoplanin antibodies showing cells with elongated nuclei, AT1-like cells (black arrows), and non-stained cells, with AT2-like cells presenting big circular nuclei (red arrows). (F) Photomicrograph of si-hSMAC-A-treated tumor stained with toluidine blue. Arrows indicate glandular-like clusters surrounded by a chain of cells. (G) Representative sections from si-NT- and si-hSMAC-A-TTs stained with anti-CD31 antibodies. Blue arrows indicate alveolar-like capillaries. Black and red arrows indicate AT1-like and AT2-like cells, respectively. (H and I) A schematic presentation of a cross-section through alveoli, with major cell types indicated.
Figure 5
Figure 5
Staining of Stromal Markers in si-NT-TTs and si-hSMAC-A-TTs Representative sections from si-NT-TTs and si-hSMAC-A-TTs stained with H&E showing stromal structures (A) and vascular formation with red blood cells (blue arrows) in si-NT-TTs but not si-hSMAC-TTs (B). Representative sections from si-NT-TTs and si-hSMAC-A-TTs stained with Sirius red (C), vimentin (D), and anti-α-smooth muscle actin (SMA) antibodies (E).
Figure 6
Figure 6
Nuclear and Mitochondrial Localization of SMAC/Diablo (A) IHC staining of SMAC/Diablo expression in normal and cancerous lung tissues from tissue microarray slides (US Biomax). The percentage indicates the proportion of samples (n = 70) stained with the indicated intensity. (B) Representative IHC images showing nuclear localization of SMAC/Diablo in lung cancer tissue. (C) Representative sections from si-NT-TTs and si-hSMAC-A-TTs derived from A549 cells stained with anti-SMAC/Diablo antibodies. Blue arrows point to positive immunostaining of the SMAC/Diablo in nuclei. (D) Immunofluorescent SMAC/Diablo and DAPI staining of representative sections from si-NT-TTs and si-hSMAC-A-TTs. (E) Representative IHC staining of B-lymphoma from tissue microarray slides stained with anti-SMAC/Diablo antibodies. Yellow arrows point to positive immunostaining of the protein in nuclei. (F) Representative immunofluorescence staining of sections from si-NT-TTs and si-hSMAC-A-TTs showing co-localization of SMAC/Diablo (red) and cytochrome c (green) in the mitochondria and of SMAC/Diablo, with DAPI (blue) staining of nuclei. White arrows in the enlarged image point to SMAC in the nucleus.
Figure 7
Figure 7
Differentially Expressed Genes and Subcellular Morphological Alterations Induced by Reductions in SMAC/Diablo Levels NGS data analysis showing selected downregulated (A) and upregulated (B) genes associated with the extracellular matrix, including cell-secreted collagen and proteoglycans, exosomes, and proteins in the endoplasmic reticulum and Golgi lumen associated with vesicle formation. The number of genes and p values are indicated for each category. (C) Changes (as revealed by NGS) in the expression of genes associated with lipid transport, synthesis, and degradation in si-hSMAC-A-TTs, represented as fold change, relative to their expression in si-NT-TTs (means ± SEM, n = 3). (D) Representative electron microscopic images of si-NT- and si-hSMAC-A-treated A549 xenograft sections. Arrows points to lamellar bodies. (E) The levels of PC and phospholipids (PL) in si-hSMAC-A-TTs, relative to si-NT-TTs (means ± SEM, n = 3), determined as described in the Supplemental Materials and Methods. (F) Changes in the expression of mRNA (qPCR) of enzymes associated with phosphatidylcholine synthesis in si-hSMAC-A-TTs, relative to si-NT, presented as fold change (means ± SEM, n = 3). (G) Schematic representation of diacylglycerols (a) and phosphatidylcholine synthesis (b and c) pathways, with down- and upregulated genes identified by arrows.
Figure 8
Figure 8
Schematic Representation of the Effects of SMAC/Diablo Depletion on Tumor Morphology and Properties (A) A schematic representation of mitochondria in lung cancer cells is provided, with proposed functions of overexpressed SMAC/Diablo in the regulation and maintenance of phospholipid synthesis highlighted. The major site of phospholipid synthesis is at ER-mitochondria contact sites (MAM), shown with key proteins indicated. These include the inositol 3 phosphate receptor type 3 (IP3R3), the sigma 1 receptor (Sig1R) (a reticular chaperone), binding immunoglobulin protein (BiP), the ER HSP70 chaperone, glucose-regulated protein 75 (GRP75), and others. Key enzymes of lipid biosynthesis, such as diacylglycerol O-acyltransferase 2 (DGAT2), phosphatidylethanolamine N-methyltransferase (PEMT), phosphatidyl serine synthase (PSS), and phosphatidate cytidylyltransferase 1 (CDS1), are all present in high concentrations at MAMs,, indicating a role for this structure in lipid biosynthesis and trafficking. Glycerol-3-phosphate acyltransferase 1, mitochondrial (GPAM), is located in the outer mitochondrial membrane (OMM) at the MAM. Phosphatidylserine (PS) is produced in the ER but needs to be transferred to the mitochondria, where it is converted into phosphatidylethanolamine (PE). PE is then translocated back to the ER, where it is converted into phosphatidylcholine (PC). Also indicated are the transfer of acyl-CoA across the OMM via VDAC1 to the IMS, where they are converted into acylcarnitine by CPT1a for further processing by β-oxidation, and the cholesterol transport complex composed of Star, VDAC1, and TSPO. (B) SMAC/Diablo depletion using specific si-SMAC leads to a decrease in vesicle formation and inhibition of cell proliferation and phospholipid synthesis. SMAC/Diablo depletion also alters nuclear morphology, stromal structure, and cancer microenvironment, and the expression of genes associated with the cell membrane, exosomes, and ER- and Golgi-related proteins. These lead to changes in blood capillary organization, AT2-like cells’ differentiation into AT1-like cells, and reduced lamellar body formation. Finally, these alterations lead to morphological changes reflected in the formation of glandular/alveoli-like structures.

Comment in

  • Diablo: A Double-Edged Sword in Cancer?
    Arbiser JL. Arbiser JL. Mol Ther. 2018 Mar 7;26(3):678-679. doi: 10.1016/j.ymthe.2018.02.004. Epub 2018 Feb 20. Mol Ther. 2018. PMID: 29472100 Free PMC article. No abstract available.

References

    1. Verhagen A.M., Ekert P.G., Pakusch M., Silke J., Connolly L.M., Reid G.E., Moritz R.L., Simpson R.J., Vaux D.L. Identification of DIABLO, a mammalian protein that promotes apoptosis by binding to and antagonizing IAP proteins. Cell. 2000;102:43–53. - PubMed
    1. Du C., Fang M., Li Y., Li L., Wang X. Smac, a mitochondrial protein that promotes cytochrome c-dependent caspase activation by eliminating IAP inhibition. Cell. 2000;102:33–42. - PubMed
    1. Deng Y., Lin Y., Wu X. TRAIL-induced apoptosis requires Bax-dependent mitochondrial release of Smac/DIABLO. Genes Dev. 2002;16:33–45. - PMC - PubMed
    1. Shiozaki E.N., Shi Y. Caspases, IAPs and Smac/DIABLO: mechanisms from structural biology. Trends Biochem. Sci. 2004;29:486–494. - PubMed
    1. Verhagen A.M., Vaux D.L. Cell death regulation by the mammalian IAP antagonist Diablo/Smac. Apoptosis. 2002;7:163–166. - PubMed

Publication types

MeSH terms

Substances