. 2018 Mar 28;6(3):301-313.e3.
doi: 10.1016/j.cels.2017.12.014. Epub 2018 Jan 27.

A Landscape of Metabolic Variation across Tumor Types

Affiliations

A Landscape of Metabolic Variation across Tumor Types

Ed Reznik et al. Cell Syst. .

Abstract

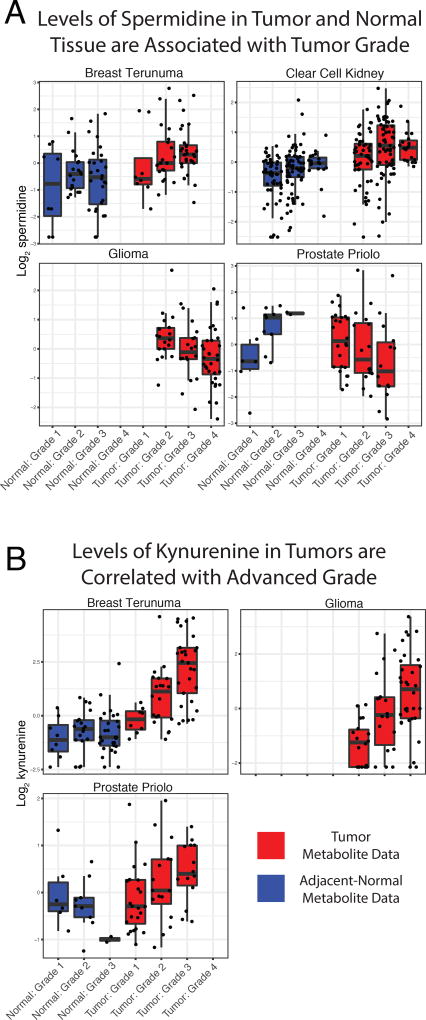
Tumor metabolism is reorganized to support proliferation in the face of growth-related stress. Unlike the widespread profiling of changes to metabolic enzyme levels in cancer, comparatively less attention has been paid to the substrates/products of enzyme-catalyzed reactions, small-molecule metabolites. We developed an informatic pipeline to concurrently analyze metabolomics data from over 900 tissue samples spanning seven cancer types, revealing extensive heterogeneity in metabolic changes relative to normal tissue across cancers of different tissues of origin. Despite this heterogeneity, a number of metabolites were recurrently differentially abundant across many cancers, such as lactate and acyl-carnitine species. Through joint analysis of metabolomic data alongside clinical features of patient samples, we also identified a small number of metabolites, including several polyamines and kynurenine, which were associated with aggressive tumors across several tumor types. Our findings offer a glimpse onto common patterns of metabolic reprogramming across cancers, and the work serves as a large-scale resource accessible via a web application (http://www.sanderlab.org/pancanmet).

Keywords: cancer metabolism; clinical data; genomics; meta-analysis; metabolomics; tumor.


Figures

Figure 1
Figure 1. Metabolomics data (928 samples, 7 cancer types, 11 studies) analyzed in this study
Data from eleven distinct metabolomics studies were aggregated. Due to incomplete coverage of the metabolome, many metabolites were profiled in a small proportion of studies. The number of tumor/normal samples varied from study to study. All but one study conducted on gliomas contained normal samples. In some, but not all cases, tumor/adjacent-normal tissue samples were collected from the same patient (i.e. “matched” or “paired” samples, terms used interchangeably). This matched data is indicated in Supplementary Table 2.
Figure 2
Figure 2. Workflow for the aggregation and comparison of metabolite profiles across studies
Metabolomics data collected in different laboratories is difficult to directly compare. Our approach is to analyze data from each metabolomics dataset separately (e.g. comparing tumor to normal samples) and then aggregate these results across cancer types. Typically, for each metabolite, abundance is reported relative to the median of all measurements of a metabolite within a study. Comparisons between different metabolites profiled in the same study is not directly possible (leftmost red oval). Furthermore, comparisons between the same metabolite profiled across different studies is not possible (topmost red oval). Throughout our analysis, we frequently examine the change in abundance of a single metabolite across different subsets of tissue samples (e.g. tumor/normal samples) from the same study (green oval). Correlative analysis with variables of interest (e.g. clinical data) is also feasible.
Figure 3
Figure 3. Differential metabolite abundances in tumor versus normal across cancer types
(A and B) In total, 10/11 studies contained adjacent-normal tissue for comparison and were included in this analysis (in total, 482 tumor samples and 378 normal samples). Analysis was done without regard to whether tumor/normal samples were paired. (A) Proportion of metabolites in each study which were differentially abundant in tumor vs. normal samples (BH-corrected p-value < 0.05). (B) The frequency of differential abundance across all metabolites. Most metabolites are rarely differentially abundant, in part because they may only be measured in a small number of studies. A small number of metabolites are often differentially abundant. (C) Variability of metabolite levels for each study. MAD ratio distributions show the inherent variability of metabolite levels; distributions shifted to the right of zero show a greater degree of variability in tumors compared to normal tissue, while those distributions shifted to the left show less. A total of 343 pairs of tumor/normal samples from 8 studies (Bladder, Breast Terunuma, Breast Tang, Kidney, Pancreatic Kamphorst, Pancreatic Zhang1, Pancreatic Zhang2, Prostate Priolo, and Prostate Sreekumar) were used.
Figure 4
Figure 4. Differential abundance across all cancer types
Blue circles indicate metabolites depleted in tumors relative to normal tissue, red circles indicate metabolites increased in tumors relative to normal tissue). Only metabolites differentially abundant in 6 or more studies are displayed.
Figure 5
Figure 5. Central carbon metabolism across cancer types
(A) Differential abundance (tumor vs. normal) in glycolysis and the TCA cycle across many cancer types. Bars indicate whether the metabolite was higher/lower/unchanged in tumor samples compared to normal tissue; the absence of a bar means the data was missing. BRCA-T: breast data from (Tang et al., 2014), PAAD-H1/2: pancreatic data from (Zhang et al., 2013), PRAD-P: prostate data from (Priolo et al., 2014). Data from 10/11 studies (LGG excluded for no normal samples, in total, 482 tumor samples and 378 normal samples). (B) Sorted log2 ratio of lactate levels in matched tumor/normal samples from 5 cancer types. Approximately 26% of samples have less lactate in tumors compared to normal tissue. In both (A) and (B), analysis was done without regard to whether tumor/normal samples were paired. (C) Frequency of elevation for each metabolite across all matched tumor-normal pairs (343 pairs in total). Kynurenine is elevated in 85% of matched samples.
Figure 6
Figure 6. Metabolic correlation with tumor progression
A total of 638 of the tissue samples had some type of associated clinical data (392 tumors and 246 normal tissues from 7 studies, including Breast Terunuma, Breast Tang, Kidney, Glioma, Ovarian, Prostate Priolo, and Prostate Sreekumar). Analysis was done without regard to whether tumor/normal samples were paired. Meta-analysis identified 174 metabolites whose abundance in tumors was significantly associated to tumor grade in 1 or more metabolomics studies. (A) Spermidine, a polyamine involved in cell proliferation, had a significant association with tumor grade across four different cancer types (breast, kidney, brain, and prostate cancer). (B) Association of kynurenine levels with tumor grade across several cancers; kynurenine is part of the tryptophan degradation pathway with pro-apoptotic effects on immune cells.

References

    1. Belladonna ML, Puccetti P, Orabona C, et al. Immunosuppression via tryptophan catabolism: the role of kynurenine pathway enzymes. Transplantation. 2007;84(1 Suppl):S17–20. - PubMed
    1. Casero RA, Marton LJ. Targeting polyamine metabolism and function in cancer and other hyperproliferative diseases. Nature Reviews Drug Discovery. 2007;6(5):373–390. - PubMed
    1. Cerami EG, Gross BE, Demir E, et al. Pathway Commons, a web resource for biological pathway data. Nucleic acids research. 2011;39(Database issue):D685–90. - PMC - PubMed
    1. Chang C-H, Qiu J, O’Sullivan D, et al. Metabolic Competition in the Tumor Microen-vironment Is a Driver of Cancer Progression. Cell. 2015;162(6):1229–41. - PMC - PubMed
    1. Chen Y, Guillemin GJ. Kynurenine pathway metabolites in humans: disease and healthy States. International journal of tryptophan research : IJTR. 2009;2:1–19. - PMC - PubMed