. 2018 Feb 2;9(1):485.
doi: 10.1038/s41467-018-02939-0.

Replication confers β cell immaturity

Affiliations

Replication confers β cell immaturity

Sapna Puri et al. Nat Commun. .

Abstract

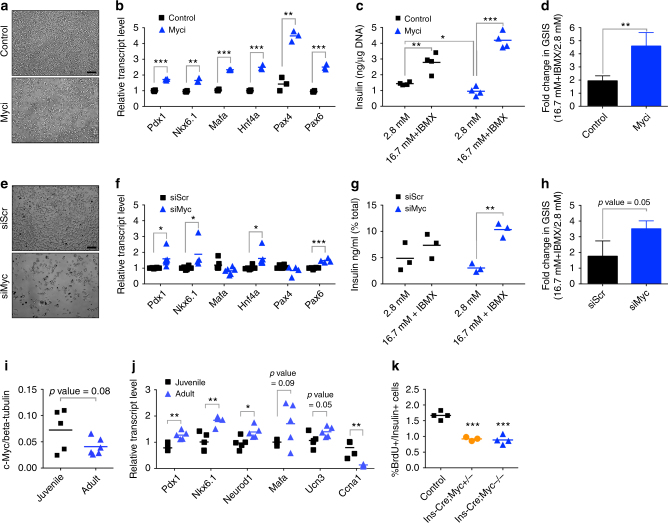
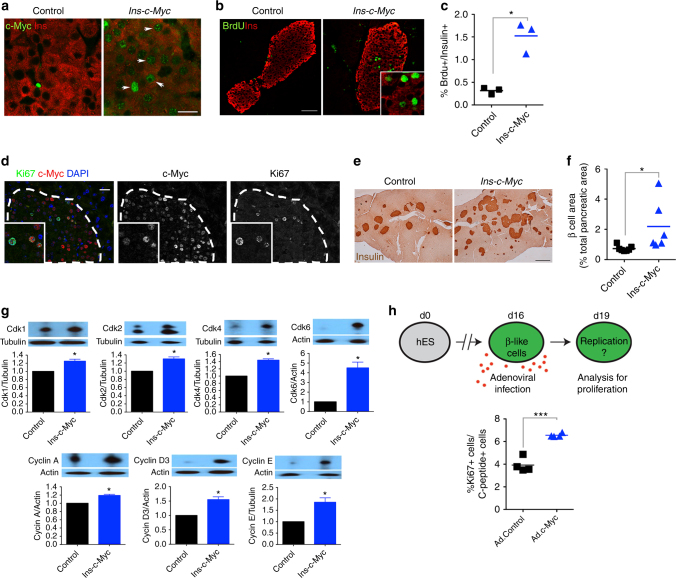
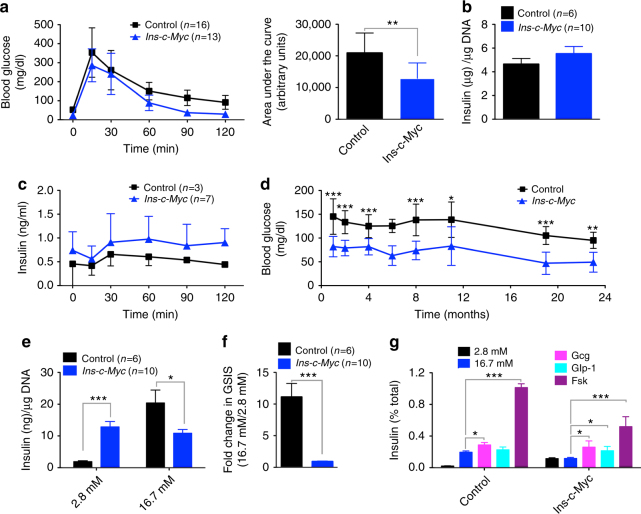
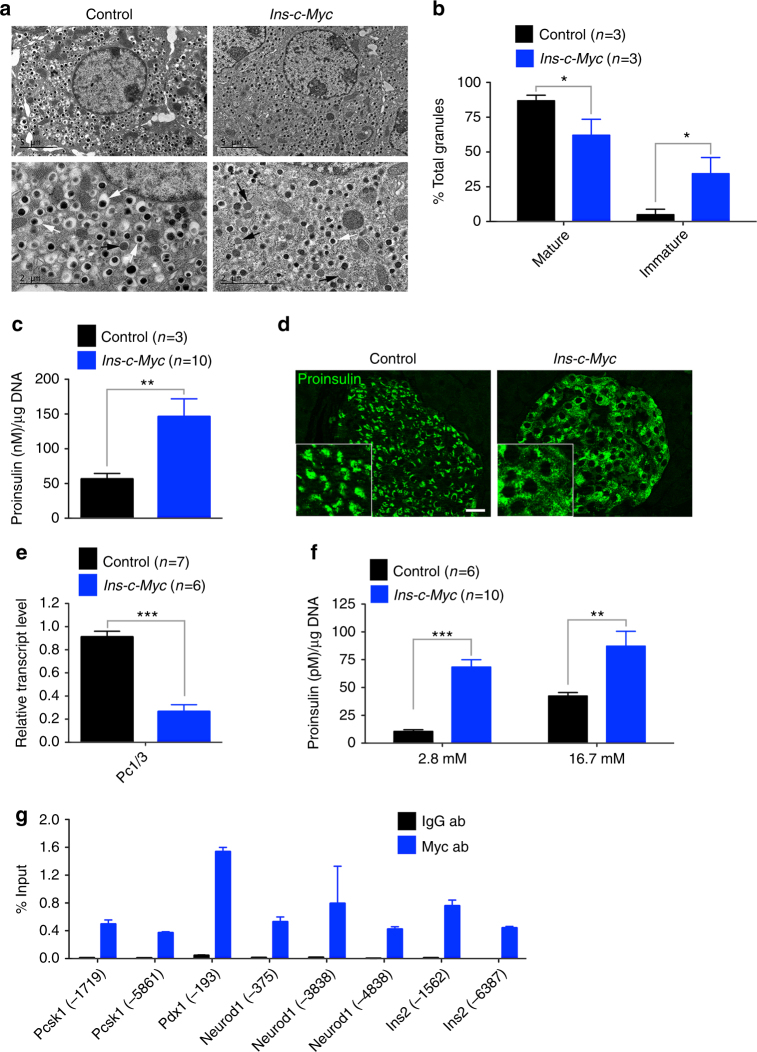
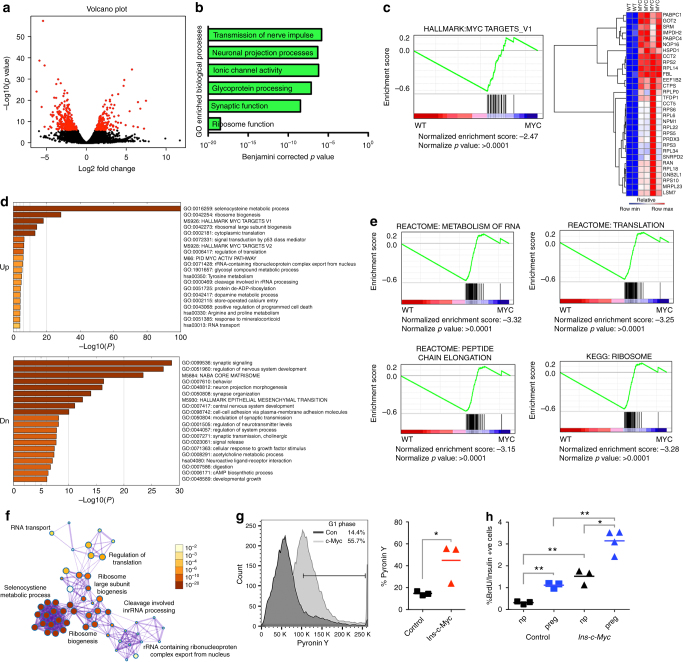
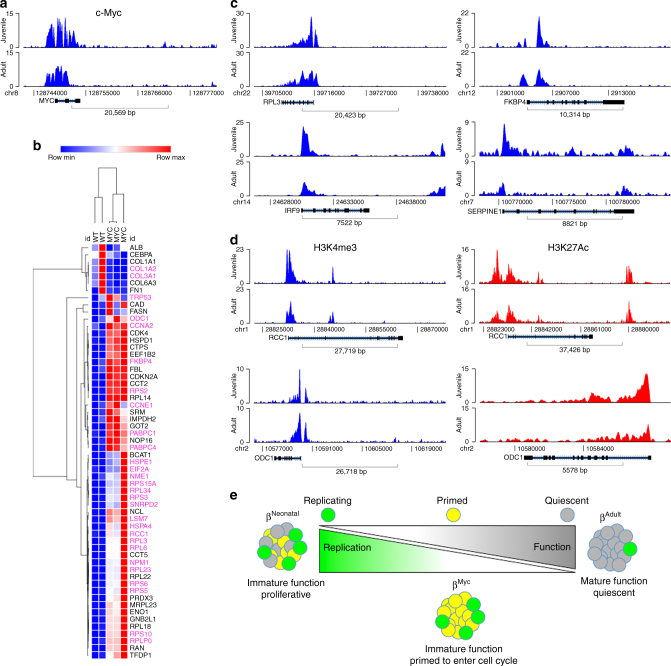
Pancreatic β cells are highly specialized to regulate systemic glucose levels by secreting insulin. In adults, increase in β-cell mass is limited due to brakes on cell replication. In contrast, proliferation is robust in neonatal β cells that are functionally immature as defined by a lower set point for glucose-stimulated insulin secretion. Here we show that β-cell proliferation and immaturity are linked by tuning expression of physiologically relevant, non-oncogenic levels of c-Myc. Adult β cells induced to replicate adopt gene expression and metabolic profiles resembling those of immature neonatal β that proliferate readily. We directly demonstrate that priming insulin-producing cells to enter the cell cycle promotes a functionally immature phenotype. We suggest that there exists a balance between mature functionality and the ability to expand, as the phenotypic state of the β cell reverts to a less functional one in response to proliferative cues.


Conflict of interest statement

The authors declare no competing financial interests.

Figures

Fig. 1
Fig. 1
c-Myc plays a role in β-cell proliferation and function. a Cell density of INS-1 cells upon Myc inhibition with 40 µM Myci for 2 days as compared to control (DMSO) treatment. Scale bar, 100 μm. b Quantitative PCR to detect gene expression of key β-cell regulatory transcription factors upon Myc inhibition (Myci, 40 µM) after 2 days of inhibitor treatment, n = 3 per group. **p < 0.005, ***p < 0.0005, Student’s t test. c Control (DMSO, n = 4) or Myci-treated (40 µM, 3 days, n = 4) INS-1 cells were subjected to glucose-stimulated insulin secretion (GSIS) under basal (2.8 mM glucose) followed by stimulatory (16.7 mM with 100 µM IBMX) conditions. *p < 0.05, **p < 0.005, ***p < 0.0005, Student’s t test. d Fold change in GSIS in INS-1 cells treated with Myci (n = 4) as compared to controls (n = 4). Error bars indicate ± SD. **p < 0.005, Student’s t test. e Cell density of INS-1 cells transfected with siMyc as compared to control samples transfected with a scrambled siRNA (siScr) for 5 days. Scale bar, 100 μm. f Quantitative PCR analysis of INS-1 cells to evaluate gene expression of several β-cell transcription factors upon reduction of c-Myc (siScr, n = 6, siMyc, n = 4–6). *p < 0.05, ***p < 0.0005, Student’s t test. g Secretory response in INS-1 cells depleted of c-Myc (siMyc) as compared to control (siScr) cells. n = 3 per group. **p < 0.005, Student’s t test. h GSIS measured in INS-1 cells with siMyc as compared to siScr samples. n = 3 per group. Error bars indicate ± SD, p = 0.05, Student’s t test. i Western blot analysis of Myc levels in juvenile (3 weeks old, n = 5) islets versus adult (3 months old, n = 6) islets from wild-type mice. p = 0.08, Student’s t test. j Quantitative PCR of β-cell maturation genes in adult islets (3 months old, n = 5) as compared to juvenile (3-weeks-old islets, n = 5) along with a cell cycle gene. *p < 0.05, **p < 0.005, Student’s t test. k BrdU incorporation (expressed as %BrdU per Insulin + ve cells) in p16 pups to quantify actively replicating β cells in the transgenic (Ins-Cre;Myc+/−, n = 3 or Ins-Cre;Myc−/−, n = 4) animals as compared to control (n = 4) littermates. ***p < 0.0005, Student’s t test
Fig. 2
Fig. 2
c-Myc stabilization increases β-cell replication. a Nuclear accumulation of c-Myc (green) in transgenic β cells (Insulin, red). Scale bar, 15 μm. Image shown is representative of at least three biological replicates. b BrdU (green) staining in Ins-c-Myc β cells (Insulin, red). Scale bar, 50 μm. c Quantification of BrdU incorporation in Ins-c-Myc animals (n = 3) as compared to controls (n = 3). *p < 0.05, Student’s t test. d c-Myc expressing β cells co-stained with Ki67 in transgenic mice. Scale bar, 20 μm. Insulin staining (e) and islet mass quantification (f) in Ins-c-Myc mice (n = 6) as compared to controls (n = 7). Scale bar, 100 μm. *p < 0.05, Student’s t test. g Quantification of the seven signature proteins in Ins-c-Myc islets. n = 3 per group, error bars indicate ± SD, *p < 0.05, Student’s t test. All animals were three months old and were not administered TAM. h Cartoon summarizing experimental approach to test the effect of c-Myc on proliferation of hESC-derived β-like cells. Adenoviral infection was used to deliver either control (Ad. Control) or c-Myc (Ad.c-Myc) to hESC-derived β-like cells, and Ki67 staining quantified. n = 4. ***p < 0.0005, Student’s t test
Fig. 3
Fig. 3
Imprecise glucose regulation in mice with stabilized c-Myc in β cells. a Glucose tolerance tests on three-month-old mice Ins-c-Myc animals (n = 13) as compared to littermate controls (n = 16). The corresponding area under the curve is noted. Error bars indicate ± SD. **p < 0.005, Student’s t test. b Total insulin content in islets from transgenic (red bar, n = 10) and control (black bar, n = 6) animals. Error bars indicate ± SEM. c In vivo IPGTT on the transgenic (n = 7) and controls (n = 3) mice. Error bars indicate ± SD. d Measurement of glycemia under fed conditions in Ins-c-Myc and control animals. Numbers of control and transgenic animals analyzed at 1, 2, 4, 6, 8, 11, 19, and 23 months were: 22, 21; 27, 27; 22, 20; 6, 2; 5, 7; 5, 6; 17, 18; and 6, 5 respectively. Error bars indicate ± SD. *p ≤ 0.05, **p < 0.005, ***p < 0.0005, Student’s t test. e In vitro glucose stimulated insulin secretion in islets from transgenic (red bars, n = 10) and control (black bars, n = 6) animals at basal (2.8 mM), and high (16.7 mM) glucose levels. Error bars indicate ± SEM. *p ≤ 0.05, ***p < 0.0005, Student’s t test. f Stimulation index of insulin secretion in transgenic islets (red bar, n = 10) as compared to controls (black bar, n = 6). Error bars indicate ± SEM. ***p < 0.0005, Student’s t test. g In vitro glucose stimulated insulin secretion in islets from 6-month-old transgenic (n = 3) and control (n = 3) in the presence of basal glucose (2.8 mM), high glucose (16.7 mM), glucagon (10 nM), Glp-1 (100 nM) or forskolin (100 μM). Error bars indicate ± SEM. *p ≤ 0.05, ***p < 0.0005, Student’s t test
Fig. 4
Fig. 4
Accumulation of features of immaturity in c-Myc-expressing β cells. a Electron microscopy shows accumulation of classical mature insulin granules with a dark core surrounded by a clear halo (white arrows) in control islets. Immature granules have a less dense core and poorly defined halo (black arrows). Top panel, scale bar: 5 μm, lower panel, scale bar: 2 μm. b Quantification of mature and immature granules in control (black bars, n = 3) and transgenic (red bars, n = 3) samples. Error bars indicate ± SD. *p < 0.05, Student’s t test. c Total proinsulin content in islets isolated from control (black bar, n = 6) and transgenic (red bar, n = 10) animals. Error bars indicate ± SEM. **p < 0.005, Student’s t test. d Immunostaining for proinsulin reveals a diffuse distribution of proinsulin-containing vesicles in the transgenic islets. Scale bar: 20 μm. e Quantitative PCR to determine the level of Pc1/3 in transgenic islets (red bar, n = 6) as compared to control islets (black bar, n = 7). Error bars indicate ± SD. ***p < 0.0005, Student’s t test. f Proinsulin secretion from transgenic (red bars, n = 10) versus control (black bars, n = 6) islets under basal (2.8 mM) and stimulatory (16.7 mM) glucose conditions. Error bars indicate ± SEM. **p < 0.005, ***p < 0.0005, Student’s t test. g Chromatin immunoprecipitation analysis to assess the recruitment of Myc to upstream canonical binding sites in the genes shown on Ins-c-Myc islets (n = 2). IgG was used as the negative control. Data are shown as percent of input. Error bars indicate ± SD
Fig. 5
Fig. 5
Global changes in β cells with stabilized c-Myc lead to an immature phenotype. a Volcano plot of transgenic (Ins-c-Myc) islets as compared to controls, with genes that are significantly (p value < 1e−06) changed marked in red. b Gene ontology analysis shows significant changes in cell growth processes, with the most significant change in “Ribosome Function” in transgenic islets. c Hallmark c-Myc targets that were highly significantly enriched in the transgenic samples identified using gene set enrichment analysis (GSEA). d Pathways differentially upregulated or downregulated in transgenic islets as compared to controls. e GSEA analysis of differentially expressed genes shows enrichment of genes involved in RNA and protein synthesis in the transgenic (myc) samples as compared to the controls (WT). f Metascape analysis shows significant overlap between RNA and protein synthesis pathways in the transgenic islet samples. Color-coding denotes p values. g Pyronin Y staining of islets isolated from Ins-c-Myc and control animals. n = 3 per group. *p < 0.05, Student’s t test. h BrdU incorporation was quantified in control (squares) and Ins-c-Myc (triangles) animals at 3 months of age either not pregnant (black) or at 14.5 days of gestation (blue). n = 3 per group. *p < 0.05, **p < 0.005, Student’s t test
Fig. 6
Fig. 6
Analysis of human ChIP data reveals activated marks on c-Myc targets in juvenile samples. a H3K4Me3 ChIP-peak distribution across the c-Myc promoter in β cells isolated from a juvenile (5 years) and an adult (48 years) donor. b RNA-seq data demonstrating levels of several c-Myc targets in islets from Ins-c-Myc and control animals. Genes marked in purple show differential H3K4 trimethylation marks in the juvenile donor samples as compared to the adult sample. c H3K4Me3 ChIP-peak distribution in RPL3, IRF9, FKBP4, and SERPINE1 genes in a juvenile (5 years) and adult (48 years) sample. d H3K4Me3 and HeK27Ac marks in the juvenile (5 years and 0.8 years respectively) samples as compared to the adult (48 years and 66 years respectively) samples of c-Myc target genes RCC1 and ODC1. e Schematic representing a key role of c-Myc is the early stages of life, at a time of increased proliferation and immature function within β cells. With age, a reduction in c-Myc occurs concomitant with acquisition of maturation features and loss of replicative capacity. In the Ins-c-Myc animals, β cells continue to express c-Myc well into adulthood and throughout life, leading to a persistence of replicative capacity, and a failure of the cells to undergo maturation, thus leading to dysregulated glucose levels

References

    1. Meier JJ, et al. Beta-cell replication is the primary mechanism subserving the postnatal expansion of beta-cell mass in humans. Diabetes. 2008;57:1584–1594. doi: 10.2337/db07-1369. - DOI - PMC - PubMed
    1. Blum B, et al. Functional beta-cell maturation is marked by an increased glucose threshold and by expression of urocortin 3. Nat. Biotechnol. 2012;30:261–264. doi: 10.1038/nbt.2141. - DOI - PMC - PubMed
    1. Jermendy A, et al. Rat neonatal beta cells lack the specialised metabolic phenotype of mature beta cells. Diabetologia. 2011;54:594–604. doi: 10.1007/s00125-010-2036-x. - DOI - PMC - PubMed
    1. Martens GA, et al. Functional characteristics of neonatal rat β cells with distinct markers. J. Mol. Endocrinol. 2014;52:11–28. doi: 10.1530/JME-13-0106. - DOI - PubMed
    1. Klochendler A, et al. The genetic program of pancreatic β-cell replication in vivo. Diabetes. 2016;65:2081–2093. doi: 10.2337/db16-0003. - DOI - PMC - PubMed

Publication types