. 2018 Feb 2;8(1):2223.
doi: 10.1038/s41598-018-20673-x.

Propagation-based phase-contrast synchrotron imaging of aortic dissection in mice: from individual elastic lamella to 3D analysis

Affiliations

Propagation-based phase-contrast synchrotron imaging of aortic dissection in mice: from individual elastic lamella to 3D analysis

Gerlinde Logghe et al. Sci Rep. .

Abstract

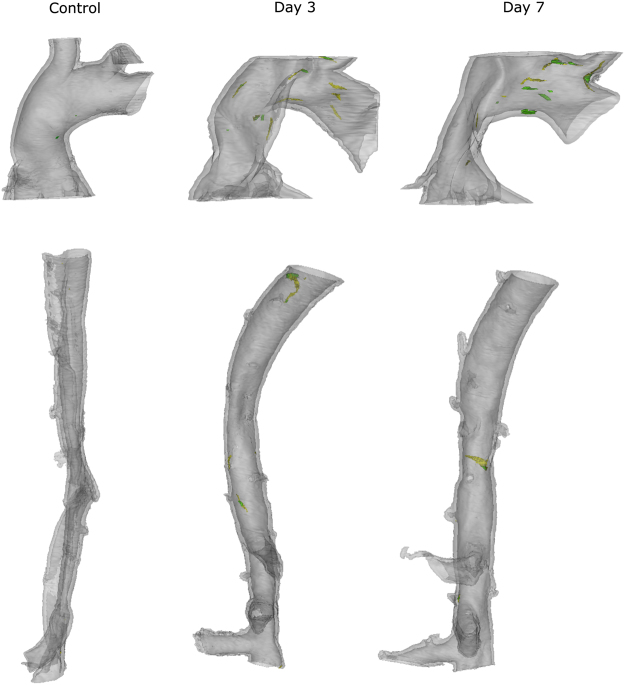
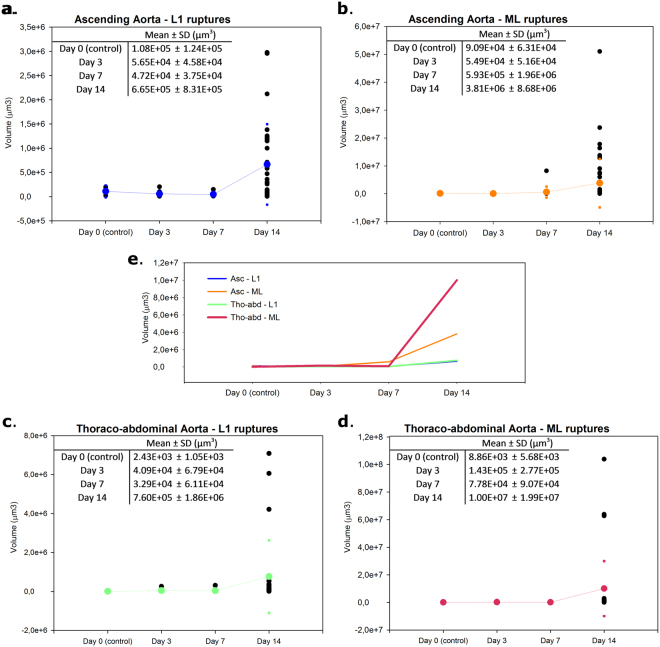
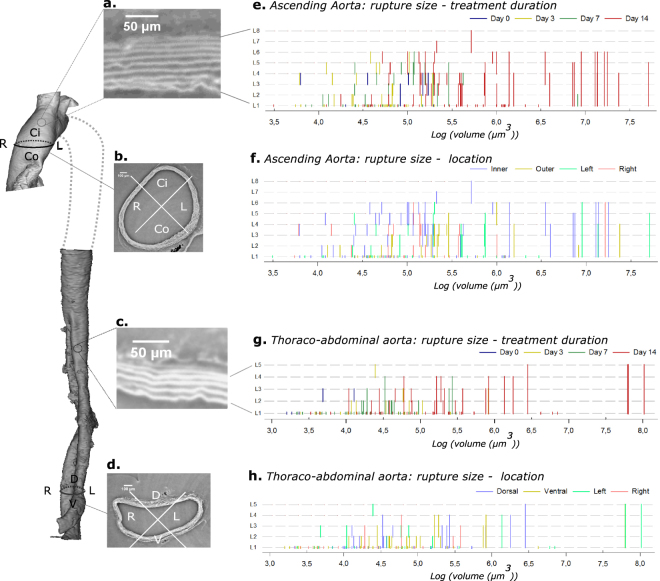
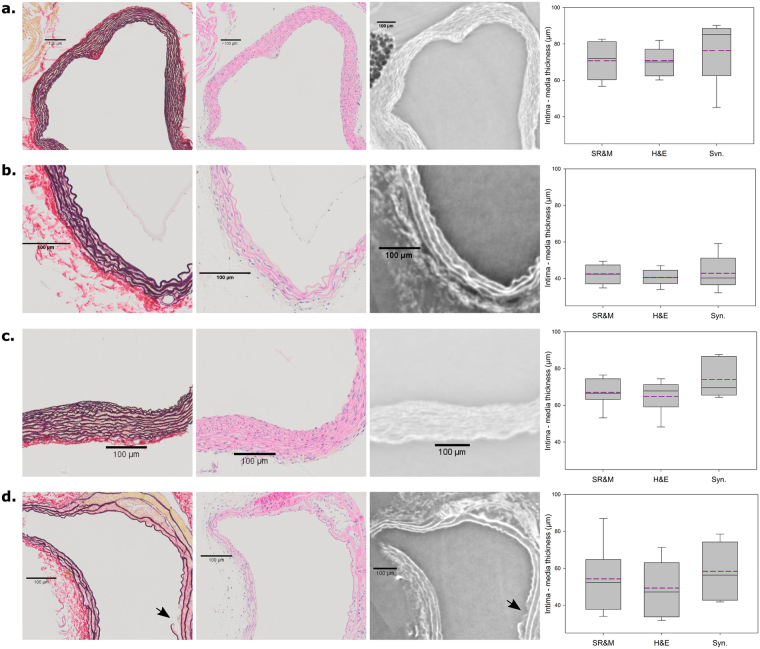
In order to show the advantage and potential of propagation-based phase-contrast synchrotron imaging in vascular pathology research, we analyzed aortic medial ruptures in BAPN/AngII-infused mice, a mouse model for aortic dissection. Ascending and thoraco-abdominal samples from n = 3 control animals and n = 10 BAPN/AngII-infused mice (after 3, 7 and 14 days of infusion, total of 24 samples) were scanned. A steep increase in the number of ruptures was already noted after 3 days of BAPN/AngII-infusion. The largest ruptures were found at the latest time points. 133 ruptures affected only the first lamella while 135 ruptures affected multiple layers. Medial ruptures through all lamellar layers, leading to false channel formation and intramural hematoma, occurred only in the thoraco-abdominal aorta and interlamellar hematoma formation in the ascending aorta could be directly related to ruptures of the innermost lamellae. The advantages of this technique are (i) ultra-high resolution that allows to visualize the individual elastic lamellae in the aorta; (ii) quantitative and qualitative analysis of medial ruptures; (iii) 3D analysis of the complete aorta; (iv) high contrast for qualitative information extraction, reducing the need for histology coupes; (v) earlier detection of (micro-) ruptures.


Conflict of interest statement

The authors declare that they have no competing interests.

Figures

Figure 1
Figure 1
3D presentation representation of ascending (top) and thoraco-abdominal (bottom) aorta of control animal (J3), day 3 (ascending sample = J5, thoraco-abdominal sample = J4) and day 7 (J7). Grey transparent = media, yellow = L1 rupture, green = ML rupture.
Figure 2
Figure 2
3D presentation of ascending (top) and thoraco-abdominal (bottom) aorta of day 14 animals. Grey transparent = media, yellow = L1 rupture, green = ML rupture, brown transparent = hematoma, purple = false lumen.
Figure 3
Figure 3
Scatter plots of volumes (in µm3) of the L1 and ML ruptures for ascending and thoraco-abdominal aortic samples. Volumes are depicted as black dots, mean and SD values are in blue (Ascending aorta – L1 ruptures, panel (a), orange (Ascending aorta – ML ruptures, panel (b), green (Thoraco-abdominal aorta – L1 ruptures, panel (c) and pink (Thoraco-abdominal – ML ruptures, panel (d). Panel (e) depicts the mean value of the L1 and ML ruptures at the different time points.
Figure 4
Figure 4
Overview of results. On the left, the resulting 3D figures of both the ascending and thoraco-abdominal aorta are shown (control mouse J3). The side panels show a portion of the pre-processed phase-contrast images (axial view). Panels (a) and (c) show a detailed portion of these images, clearly showing the individual elastic lamellae (L1-L8 for the ascending part, L1-L5 for the thoraco-abdominal part). Panels (b) and (d) show the 4 quadrants (L: left, R: right, Ci: inner curvature, Co: outer curvature, D: dorsal, V: ventral) for ascending and thoraco-abdominal portion of the aorta. On the right side, the relationship between the size of ruptures (logarithmic scale of mask volume, x-axis) and the affected medial layers (y-axis) is shown. The ruptures are grouped according to treatment in panel (f and g) (control (day 0) = dark blue, day 3 = yellow, day 7 = green, day 14 = red) and according to quadrant in panels (f and h) (Ci = blue, Co = yellow, dorsal = blue, ventral = yellow, left = green, right = red).
Figure 5
Figure 5
Comparison of histological staining with synchrotron scans. Left: H&E staining, middle: SR&M staining, right: synchrotron image, far right: boxplots representing the intima-media thickness (µm) measured in the SR&M, H&E and synchrotron scans (syn.). Panel (a): control (J3, ascending), panel (b): day 3 (J4, thoraco-abdominal), panel (c): day 7 (J8, ascending) and panel (d): day 14 (J12 thoraco-abdominal). The dark pink in the H&E plot of panel (d) represents an interlamellar hematoma. In the SR&M stainings, collagen is red and the elastic fibers are blue/black. Scale bar represents 100 µm. the black arrow in panel (d) shows a L1 rupture. In the boxplots minimum and maximum (horizontal lines), median, first and third quartile are shown. The purple dashed line represents the mean value of thickness.
Figure 6
Figure 6
Segmentation of L1 and ML ruptures. Masks (L1 ruptures: yellow, ML ruptures: green) were created by manually segmenting the ruptures in selected axial slices) and using the Mimics interpolation tool to create the mask on the intermediate axial slices (dashed line between slices).Online resource 1 Synchrotron acquisitions of ascending aorta of sample J2 (control animal).

References

    1. Corvera JS. Acute aortic syndrome. Ann. Cardiothorac. Surg. 2016;5:188–193. doi: 10.21037/acs.2016.04.05. - DOI - PMC - PubMed
    1. Humphrey JD, Holzapfel GA. Mechanics, mechanobiology, and modeling of human abdominal aorta and aneurysms. J. Biomech. 2012;45:805–814. doi: 10.1016/j.jbiomech.2011.11.021. - DOI - PMC - PubMed
    1. Osada, H., Kyogoku, M., Ishidou, M., Morishima, M. & Nakajima, H. Aortic dissection in the outer third of the media: what is the role of the vasa vasorum in the triggering process? 43, 82–88 (2013). - PubMed
    1. Daugherty A, Cassis LA. Mouse Models of Abdominal Aortic Aneurysms. Arterioscler. Thromb. Vasc. Biol. 2004;24:429–434. doi: 10.1161/01.ATV.0000118013.72016.ea. - DOI - PubMed
    1. Trachet B, et al. Angiotensin II infusion into ApoE-/- mice: a model for aortic dissection rather than abdominal aortic aneurysm? Cardiovasc. Res. 2017;113:1230–1242. doi: 10.1093/cvr/cvx128. - DOI - PubMed

Publication types

MeSH terms

LinkOut - more resources