. 2018 Feb 2;9(1):483.
doi: 10.1038/s41467-018-02928-3.

Direct effects of transcranial electric stimulation on brain circuits in rats and humans

Affiliations

Direct effects of transcranial electric stimulation on brain circuits in rats and humans

Mihály Vöröslakos et al. Nat Commun. .

Abstract

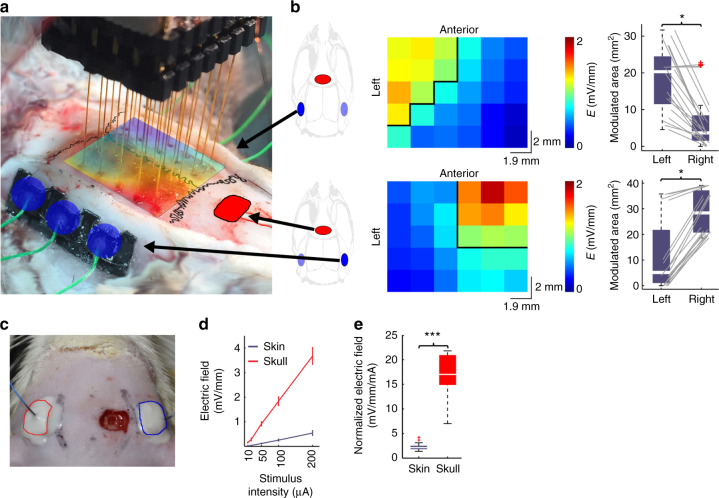
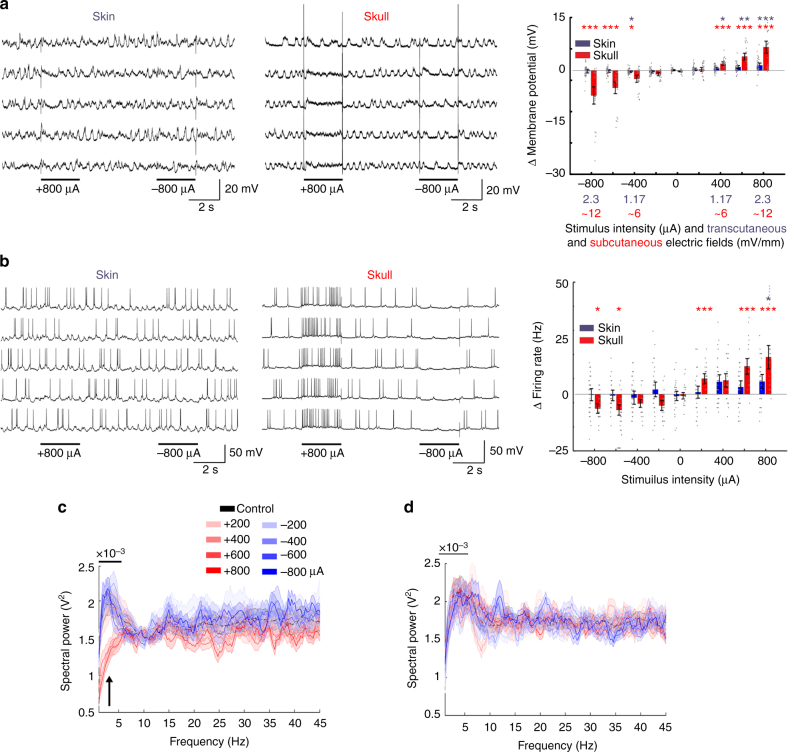
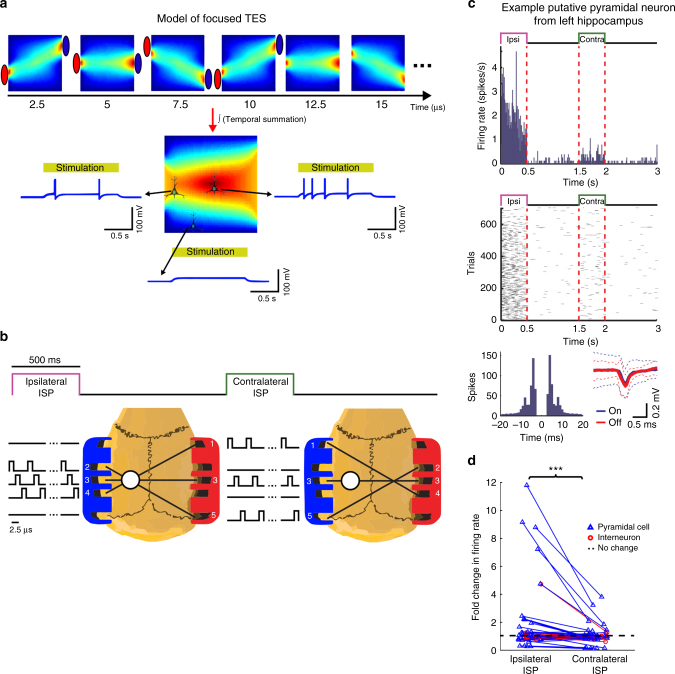
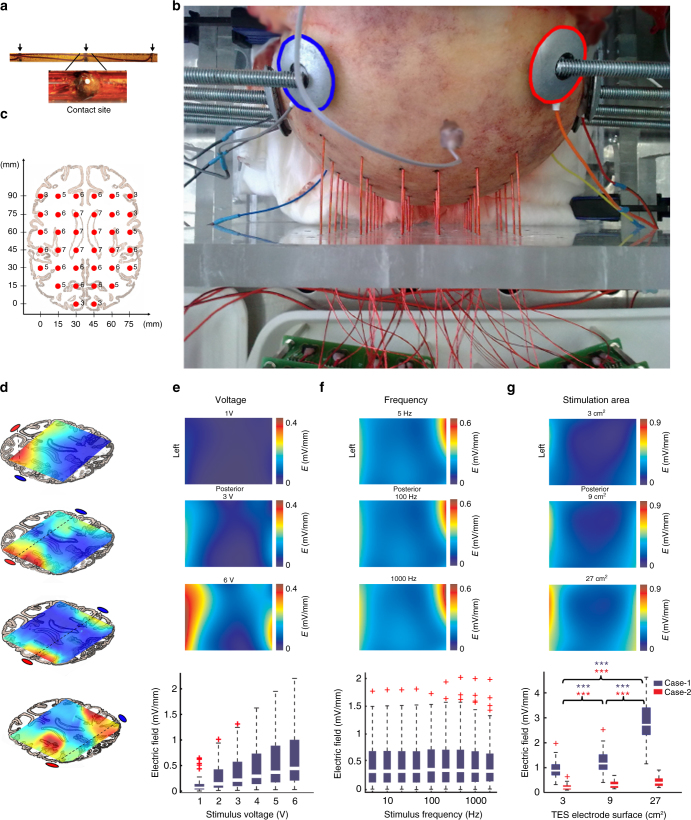
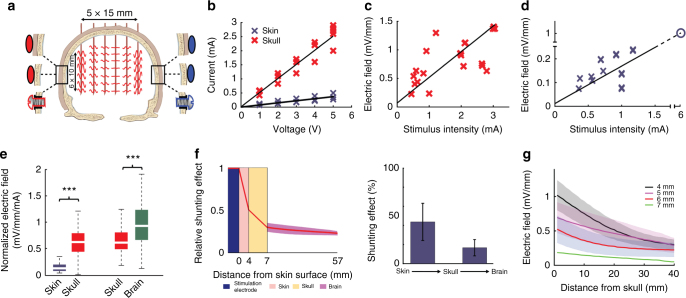
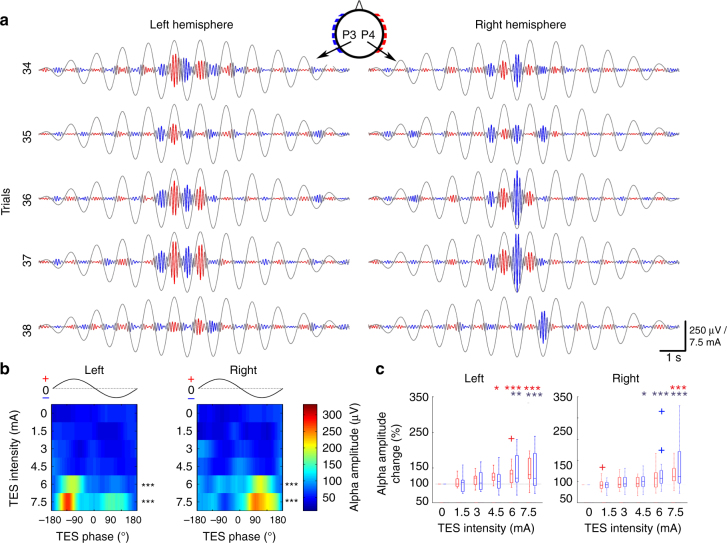
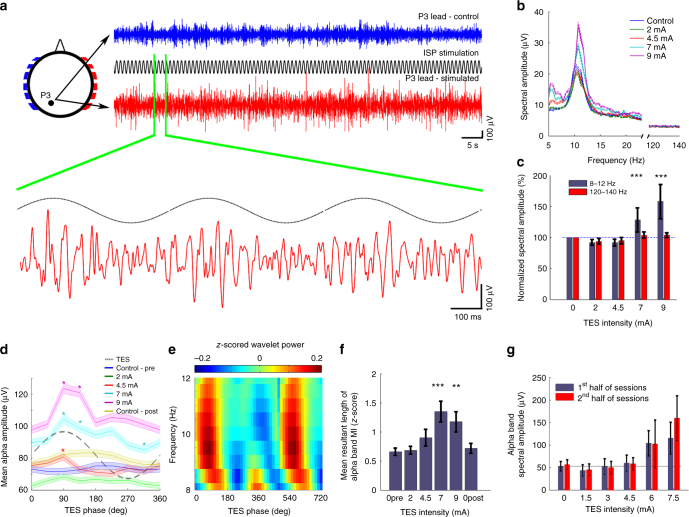
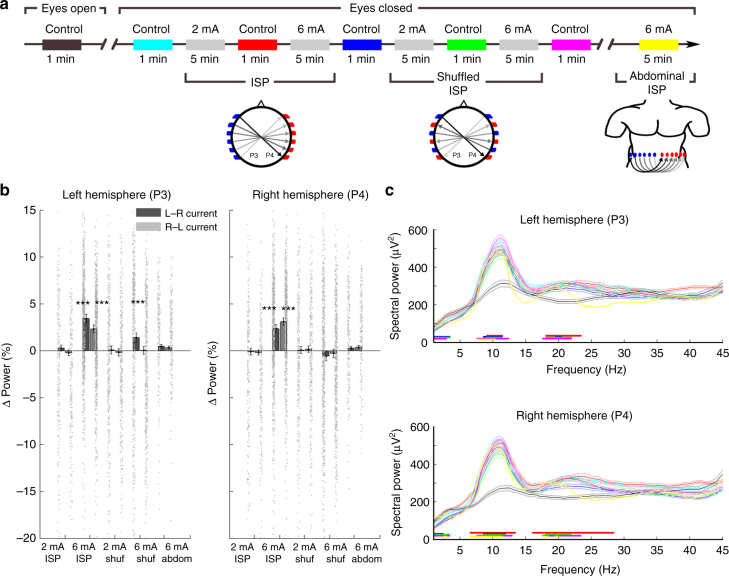
Transcranial electric stimulation is a non-invasive tool that can influence brain activity; however, the parameters necessary to affect local circuits in vivo remain to be explored. Here, we report that in rodents and human cadaver brains, ~75% of scalp-applied currents are attenuated by soft tissue and skull. Using intracellular and extracellular recordings in rats, we find that at least 1 mV/mm voltage gradient is necessary to affect neuronal spiking and subthreshold currents. We designed an 'intersectional short pulse' stimulation method to inject sufficiently high current intensities into the brain, while keeping the charge density and sensation on the scalp surface relatively low. We verify the regional specificity of this novel method in rodents; in humans, we demonstrate how it affects the amplitude of simultaneously recorded EEG alpha waves. Our combined results establish that neuronal circuits are instantaneously affected by intensity currents that are higher than those used in conventional protocols.


Conflict of interest statement

A.B. is the founder and owner of Amplipex and Evobrain LLCs, which manufacture biosignal amplifiers and stimulator devices. A patent application about the ISP method has been filed by A.B. and G.B. The remaining authors declare no competing financial interests.

Figures

Fig. 1
Fig. 1
Intracerebral electric field distribution and magnitude during subcutaneous or transcutaneous stimulation. a Intraoperative photograph of the measurement of intracerebral electric fields by a 6-by-5 electrode matrix in an anesthetized rat. Red: cathodal, blue: anodal gel electrodes glued onto the skull surface. The spline interpolated map of the measured intracerebral gradients shown in b (bottom) is superimposed on the skull surface. b Map of the measured intracerebral gradients in the horizontal plane. The boundary where the gradients are >1 mV/mm is marked by black lines (applied intensity: 100 µA). Right, boxplots with whiskers indicate group results (full data set is superimposed in gray). Proper placement of the stimulating electrodes can restrict the extent of the effective electric field gradients to either the left (upper plot) or the right (lower plot) hemisphere (P = 0.04 and 0.02; n = 20 in 4 rats each, Mann–Whitney U-test). c Photograph of scalp stimulation electrodes and the small hole in the skull through which intracellular recordings were made. d, e Transcutaneous stimulation at the same stimulus intensities generated several-fold weaker electric fields compared to subcutaneous stimulation (P < 0.005, n = 20 in 4 rats)
Fig. 2
Fig. 2
Modulating neuronal activity by subcutaneous or transcutaneous stimulation. a Subthreshold membrane potential changes of cortical neurons by transcutaneous and subcutaneous direct current stimuli. Vm was held below spiking by intracellularly injected hyperpolarizing current. Five representative trials are shown for each arrangement. Right panel, group effects (n = 40 trials from 8 neurons of 3 rats for transcutaneous and n = 25 trials from 5 neurons of 4 rats for subcutaneous experiments). Note linear changes of Vm with changing polarity and amplitude of forced fields (R = 0.86, P < 0.005 for transcutaneous and R = 0.97, P < 0.005 for subcutaneous stimulation, n = 13 trials, each; asterisks mark significant differences against control condition, n = 25/40 for subcutaneous/transcutaneous trials). For each stimulus intensity, the generated electric field strengths are shown at the bottom of the plot in blue and red for transcutaneous and subcutaneous stimuli, respectively. b Same as a but for affected spiking frequency by applied fields (R = 0.80, P = 0.007 for transcutaneous and R = 0.95, P < 0.005 for subcutaneous stimulation, n = 13, each; asterisks mark significant pairwise differences against control condition, n = 25/35 for subcutaneous/transcutaneous trials). c, d Changes of Vm power spectra in response to subcutaneous (c, n = 30 trials) and transcutaneous (d, n = 35 trials) stimuli. Note the lack of a significant effect with transcutaneous stimulation and prominent decrease of delta power (1–5.4 Hz) at +600 and +800 µA conditions compared to control (arrow; P < 0.005, n = 30 power value pairs at each frequency bin from 6 animals; Mann–Whitney U-test with Bonferroni correction)
Fig. 3
Fig. 3
Intersectional Short Pulse (ISP) stimulation can spatially focus induced fields. a Leaky integrate-and-fire neuron model cartoon to demonstrate the concept of ISP stimulation. Stimulus current is delivered sequentially through three independent electrode pairs generating a continuously changing intracerebral gradient pattern. Neuronal cell membranes can integrate these patterns due to their relatively slow membrane time constant (10 ms). Consequently, neurons at the cross-section of the current flow axes integrate all three stimuli, and become more strongly entrained than neurons located outside the focus. b Experimental protocol to measure the efficacy of ISP. White circle marks the craniotomy for the example left hippocampal neuron shown in c. The contralateral craniotomy is not displayed for simplicity. 3D-printed gel electrode holders (anode = left; cathode = right) were attached to the temporal bones bilaterally with five electrodes on each side. Three electrode pairs were programmed to target the ISP beams on either the left or the right hemisphere (serving as ISPipsi and ISPcontra conditions for the example in c, respectively). Each electrode pair was pulsed for 2.5 µs and the pulses cycled through the three pairs for 500 ms followed by non-stimulated 1-s control periods. This sequence was repeated to alternatingly stimulate the right or left hemisphere. The idealized beam crossings shown here may be modified by the inhomogeneity of brain structures and ventricles. c Response of an example neuron. The putative pyramidal cell from the left hippocampus was strongly excited by the ipsilateral focal stimulation, as shown by peristimulus time histograms (top panels) and raster plots (middle panels). ISP stimulation did not affect isolation of single units as demonstrated by the similar autocorrelograms and identical spike waveforms during stimulation and control periods. d Fold-changes of normalized firing rates of the significantly modulated cells from the left (n = 32 units) and from the right hippocampus (n = 23 units) show lateralized effect of the ISP stimulation (P = 0.001; ISPipsilateral vs. ISPcontralateral Wilcoxon signed rank test)
Fig. 4
Fig. 4
Measuring induced intracerebral electric fields in human cadavers. a Photomicrograph of the custom-made multicontact electrodes used in the cadaver experiments. b Photograph of the skull with drilled holes and inserted electrodes. A needle electrode in the sagittal plane on the forehead served as reference for the recordings. Ag/AgCl electrodes, marked by blue and red circles for negative and positive polarity, respectively, were fixed to the skull by conductive gel and secured by rubber-lined washers fixed to the plexiglass frame by threaded rods. c Stereotaxic coordinates of the electrode shanks. Numbers denote the number of recording sites for each electrode shank. Electrode tips (and adjacent sites) were positioned at the same depth to sample distinct horizontal planes. The depth coverage of our electrodes was 3–7 cm (depending on the number of contact sites). d The effect of different stimulation electrode configurations on the distribution of voltage gradients displayed on a single horizontal slice. Position of the stimulating electrodes determines the location of maximal intracranial effect. Voltage gradients were calculated the same way as in Fig. 1b. eg Effect of stimulus intensity, frequency, and electrode size on intracerebral voltage gradients, respectively. Top three panels denote example gradient maps in the horizontal plane, bottom graphs show population data. e Electric field strength is a linear function of applied stimulus intensity (R = 0.52; P < 0.001; n = 48 gradient values in two different arrangements in 4 cadavers). f Stimulus frequency between 5 and 1000 Hz has a minor effect on intracerebral gradients (one-way ANOVA; F(8, 891) = 0.0667, P = 0.99, mean ± 2 SD is shown, n = 900 gradient values in 5 cadavers). g Increasing electrode size increases the magnitude of electric fields in a constant voltage mode, as the aggregate resistance decreases (n = 60 from 2 cadavers, P < 0.001 for all conditions)
Fig. 5
Fig. 5
Skin and subcutaneous soft tissue diffuses scalp-applied current in cadaver brains. a Schematic of the experimental arrangement for transcutaneous, subcutaneous, and epidural stimulation. Example signal traces recorded in a coronal plane. Note the phase reversal of sinusoid voltage traces between the two sides. b Both transcutaneous and subcutaenous stimulation show intensity-independent linear (ohmic) properties (n = 81 in four different arrangements in 10 cadavers, R = 0.92, P < 0.001 for subcutaneous, and n = 14 in 6 cadavers, R = 0.86, P < 0.001 for transcutaneous stimulation; raw data and fitted line are shown), which allows the calculation of voltage–current relationship. c, d Subcutaneous stimulation (c, R = 0.56, P < 0.001, n = 29 in 10 cadavers) elicited several-fold larger intracerebral gradients compared to transcutaneous stimulation (d, R = 0.8, P < 0.001, n = 16 in 6 cadavers). Extrapolation from the measured data indicates that approximately 6 mA transcutaneous current can induce 1 mV/mm intracerebral electric field (circle). Raw data and fitted lines are shown. e Ratios of induced intracerebral fields and stimulus amplitude in trancutaneous vs. subcutaneous (P < 0.001, n = 36 in two different arrangements in 6 cadavers), and subcutaneous vs. epidural stimulation (P < 0.001, n = 60 in 3 cadavers). f 58 ± 7% of the applied current is shunted by skin and soft tissue and a further 16 ± 8% is attenuated by the serial resistance of the skull. g Effect of skull thickness on induced fields (n = 64 in 8 cadavers)
Fig. 6
Fig. 6
ISP stimulation of the scalp phasically modulates ongoing brain oscillations in human subjects. a Five consecutive example trials demonstrating alpha amplitude increase for high-intensity ISP stimulation. Alpha-band filtered EEG signals are color coded based on the instantaneous ISP phase for better visibility; blue and red colors denote stimulus trough (right-to-left currents) and peak (left-to-right currents), respectively. Gray sinusoids denote the ISP stimulus epoch with an increasing–decreasing amplitude. b Phase modulation of the alpha amplitude by ISP stimulation for the entire session from the same subject as shown in a, showing intensity-dependent alpha amplitude increase (mean across phases are tested in n = 45 trials against 0 mA condition, P < 0.001 for 6 and 7.5 mA). Note the alternating phase modulation of the left and right hemisphere-derived EEG signals at 6 and 7.5 mA intensities. Color maps show the phase-dependent median alpha amplitudes. c Population analysis for the left and right hemispheres, respectively, revealed an intensity-dependent effect. Alpha amplitudes at stimulus peaks and troughs were generally unchanged for stimulus intensities below 4.5 mA. In response to anodal currents in the same hemisphere, phasic modulation was significant at 4.5, 6, and 7.5 mA. In response to cathodal stimulation in the contralateral hemisphere, significant effects were observed only at 7.5 mA (right hemisphere) or 6 and 7.5 mA (left hemisphere)
Fig. 7
Fig. 7
High intensity ISP stimulation of the scalp phasically modulates ongoing alpha waves in human subjects. a Blue, control EEG trace; red, EEG trace during 7 mA stimulation (eyes closed in each condition). A 3-s magnified segment of EEG trace at P3 lead is also shown. Note the absence of signal saturation. The 1 Hz modulation of the baseline was removed. b Single session example of power spectra of EEG traces during increasing ISP intensities at 1 Hz. Power spectra were calculated in 10-s long windows, then averaged. c Quantification of ISP stimulation-induced increase in alpha band power in a single session. The control frequency band (120–140 Hz) showed no significant change (n = 405–408 stimulus cycles; Palphaband = 0.37, 0.42, <0.001, <0.001; Pcontrol = 1.38, 1.38, 0.31, 0.62 for 2, 4.5, 7, 9 mA; all vs. 0 mA). d Single session example of alpha wave amplitudes as a function of the phase of 1 Hz ISP sinusoid stimulation. Asterisks denote phase bins significantly different from the mean (one-way ANOVA; P < 0.05 at F(7, 3140) = 3.033 for 4.5 mA, F(7, 3136) = 6.96 for 7 mA, and F(7, 3160) = 14.37 for 9 mA; asterisks show significant (P < 0.05) phase-intensity combinations of the post-hoc t-tests against the phase bins of the control condition. e Single session example wavelet map (9 mA, 1 Hz ISP) shows ISP phase modulation of the alpha band power. f Alpha band power modulation of wavelet decomposed EEG by 1 Hz ISP stimulation phase (n = 16, 10, 8, 18, 10, and 12 sessions; P = 0.98, 0.041, <0.001, 0.019, and 0.17 for ‘0pre’, 2, 4.5, 7, 9, and ‘0post’ intensities in 3 subjects; two-sample Kolmogorov–Smirnov test). g ISP stimulation-induced increase of alpha power was stable throughout the recording epochs, as shown by the similar values during the first and second halves of the stimulation sessions (n = 23 trials from a single subject, P = 0.96, 0.79, 0.44, 0.44, 0.74, and 0.11 for 0, 1.5, 3, 4.5, 6, and 7.5 mA intensities, respectively)
Fig. 8
Fig. 8
Comparison of ISP and shuffled ISP stimulation on the EEG of human subjects. a Testing sequence of the experimental protocol. ISP stimulation used the same arrangement as in Fig. 5. During shuffled ISP, adjacent stimulation electrodes were stimulated with opposite polarity. While shuffled ISP increases local current flow in the scalp, the alternating directions of the induced electric fields at the focus area are expected to cancel, ideally resulting in a zero current in the brain. b Group results shown separately for the left and right hemispheres. Six mA current ISP stimulation increased alpha power in both hemispheres. Shuffled ISP exerted only a unilateral and weaker effect. Intensities at 2 mA were ineffective. Abdominal stimulation (6 mA ISP protocol) did not exert a significant effect on alpha power (n = 809 epochs; power difference values for each conditions from 6 subjects, one-sample t-test with Bonferroni correction). c Spectral power comparison between eyes open control and eyes closed control periods. Horizontal lines indicate significant changes from the eyes open condition (P < 0.05; n = 125 epochs for the eyes open, 144, 117, 126, 127, 148 epochs for the consecutive eyes closed, and 211 epochs for the abdominal ISP conditions; Mann–Whitney U-test with Bonferroni correction). Color coding of the conditions is the same as in a

Comment in

References

    1. Anastassiou CA, Montgomery SM, Barahona M, Buzsaki G, Koch C. The effect of spatially inhomogeneous extracellular electric fields on neurons. J. Neurosci. 2010;30:1925–1936. doi: 10.1523/JNEUROSCI.3635-09.2010. - DOI - PMC - PubMed
    1. Jefferys JGR. Nonsynaptic modulation of neuronal-activity in the brain—electric currents and extracellular ions. Physiol. Rev. 1995;75:689–723. doi: 10.1152/physrev.1995.75.4.689. - DOI - PubMed
    1. Ranck JB. Which elements are excited in electrical stimulation of mammalian central nervous system: a review. Brain Res. 1975;98:417–440. doi: 10.1016/0006-8993(75)90364-9. - DOI - PubMed
    1. Berenyi a, Belluscio M, Mao D, Buzsaki G. Closed-loop control of epilepsy by transcranial electrical stimulation. Science. 2012;337:735–737. doi: 10.1126/science.1223154. - DOI - PMC - PubMed
    1. Reato D, et al. Transcranial electrical stimulation accelerates human sleep homeostasis. PLoS. Comput. Biol. 2013;9:e1002898. doi: 10.1371/journal.pcbi.1002898. - DOI - PMC - PubMed

Publication types