. 2018 Feb 2;8(1):2254.
doi: 10.1038/s41598-018-20485-z.

Broad impact of extracellular DNA on biofilm formation by clinically isolated Methicillin-resistant and -sensitive strains of Staphylococcus aureus

Affiliations

Broad impact of extracellular DNA on biofilm formation by clinically isolated Methicillin-resistant and -sensitive strains of Staphylococcus aureus

Shinya Sugimoto et al. Sci Rep. .

Abstract

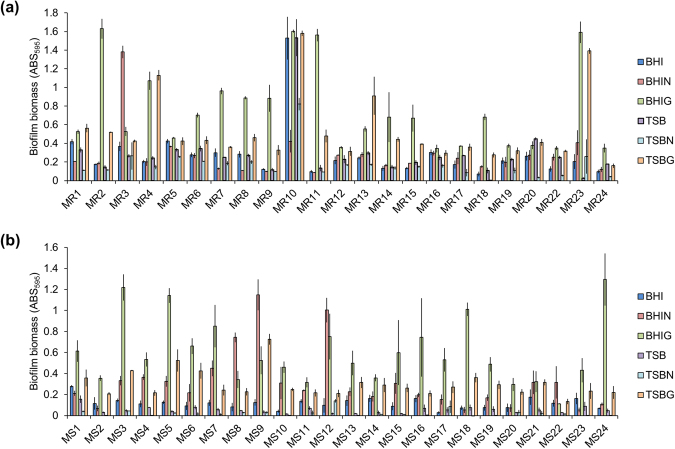
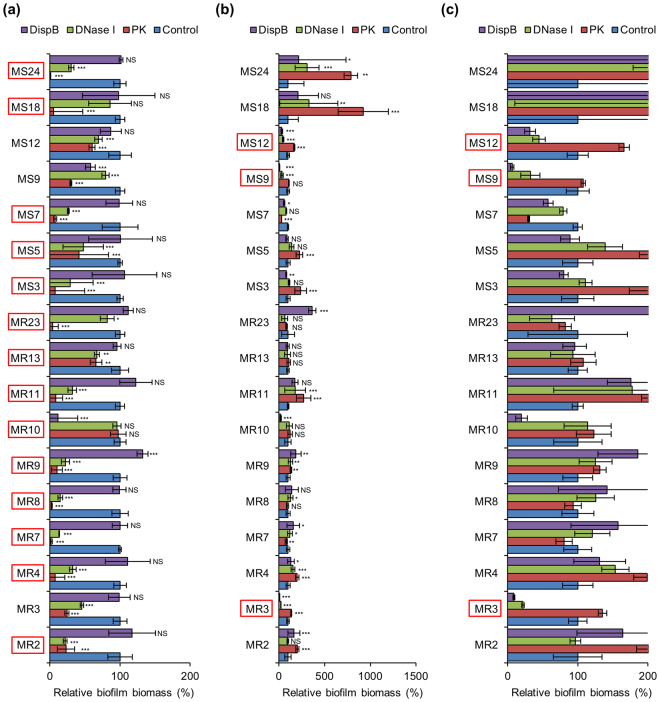
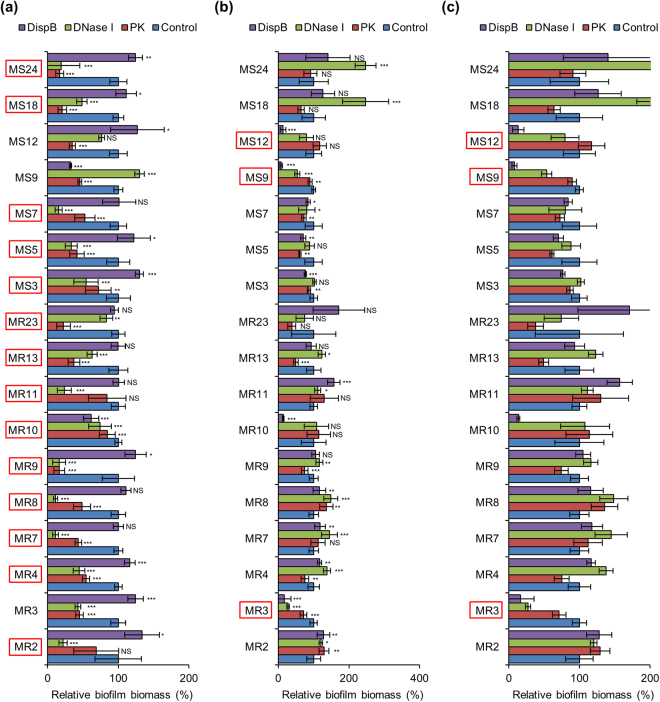
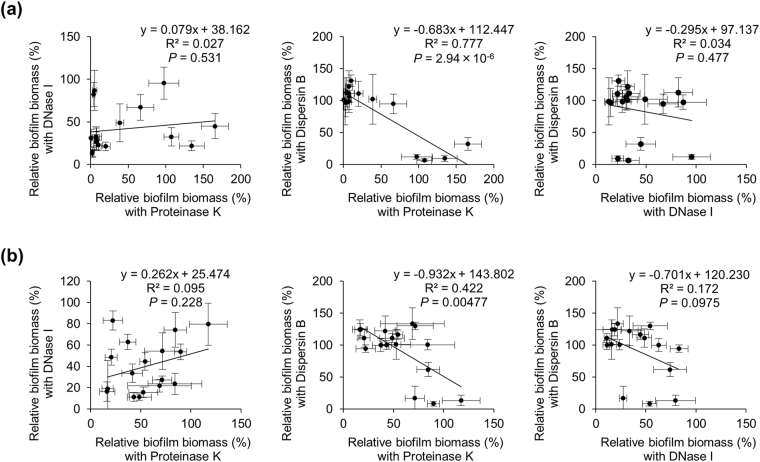
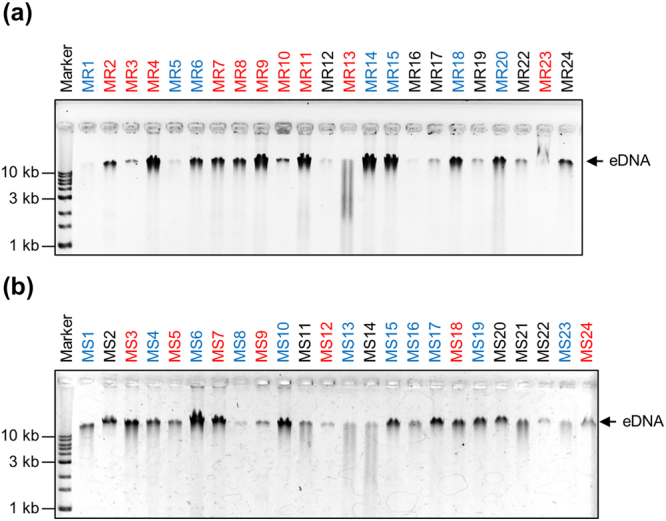
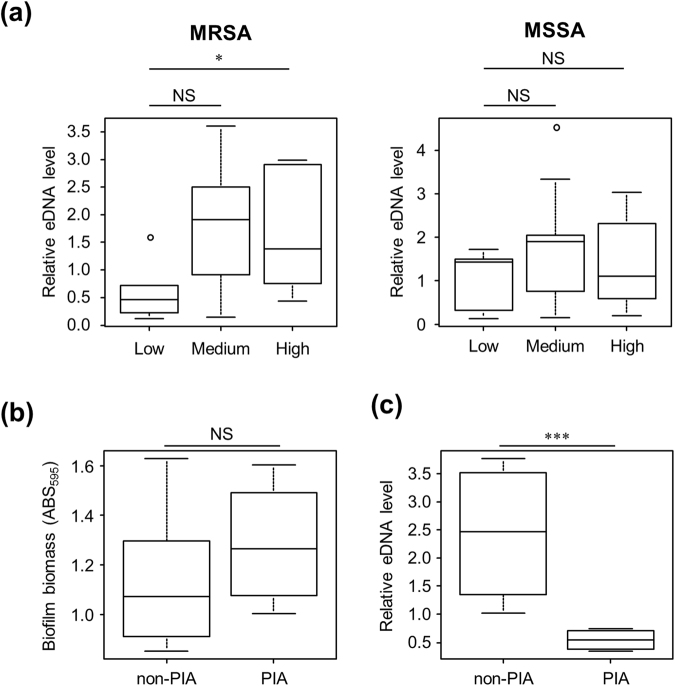
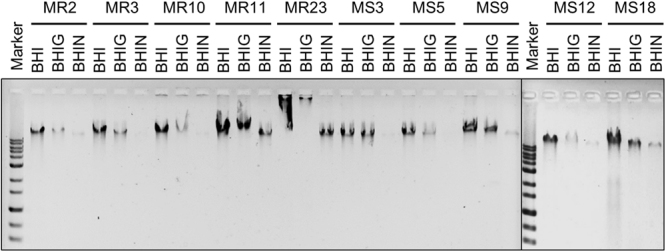
Staphylococcus aureus is a major causative agent for biofilm-associated infections. Inside biofilms, S. aureus cells are embedded in an extracellular matrix (ECM) composed of polysaccharide-intercellular adhesins (PIA), proteins, and/or extracellular DNA (eDNA). However, the importance of each component and the relationship among them in biofilms of diverse strains are largely unclear. Here, we characterised biofilms formed by 47 S. aureus clinical isolates. In most (42/47) of the strains, biofilm formation was augmented by glucose supplementation. Sodium chloride (NaCl)-triggered biofilm formation was more prevalent in methicillin-sensitive S. aureus (15/24) than in methicillin-resistant strain (1/23). DNase I most effectively inhibited and disrupted massive biofilms, and Proteinase K was also effective. Anti-biofilm effects of Dispersin B, which cleaves PIA, were restricted to PIA-dependent biofilms formed by specific strains and showed significant negative correlations with those of Proteinase K, suggesting independent roles of PIA and proteins in each biofilm. ECM profiling demonstrated that eDNA was present in all strains, although its level differed among strains and culture conditions. These results indicate that eDNA is the most common component in S. aureus biofilms, whereas PIA is important for a small number of isolates. Therefore, eDNA can be a primary target for developing eradication strategies against S. aureus biofilms.


Conflict of interest statement

Seiji Hori has received speaker’s honoraria from Daiichi Sankyo Co., Ltd. (Tokyo, Japan).

Figures

Figure 1
Figure 1
Biofilm biomass of various clinically isolated S. aureus strains under different culture conditions. Biofilms of the indicated strains of (a) MRSA and (b) MSSA were formed in the indicated media at 37 °C for 24 h. Y-axes represent biofilm biomass determined by measuring absorbance of CV-stained biofilms at 595 nm. Data are represented as mean ± standard deviation from at least three independent experiments.
Figure 2
Figure 2
Inhibition of biofilm formation by ECM-degrading enzymes. Biofilms of the high-biofilm producing S. aureus strains were formed in BHIG (except for MR13 that was cultured in TSBG) (a) and BHIN (b) supplemented with Proteinase K, DNase I, and Dispersin B or non-supplemented (control). Biofilm biomass was quantified after 24 h. (c) For easier evaluation, the range of the X-axis of b was adjusted. All strains marked with red squares were cultured in the optimal medium for biofilm formation (Fig. 1). X-axes represent the percentage of biofilm biomass determined by measuring absorbance of CV-stained biofilms at 595 nm. Controls were defined as 100%. Data are represented as mean ± standard deviation from at least three independent experiments. *P < 0.05; **P < 0.01; ***P < 0.001; NS, not significant.
Figure 3
Figure 3
Dispersal of biofilms by ECM-degrading enzymes. Biofilms formed for 24 h in BHIG (except for MR13 that was cultured in TSBG) (a) and BHIN (b) were treated with or without the indicated enzymes at 37 °C for 2 h. (c) For easier evaluation, the range of the X-axis of b was adjusted. The residual biofilms were quantified. All strains marked with red squares were cultured in the optimal medium for biofilm formation (Fig. 1). X-axes represent the percentage of biofilm biomass determined by measuring absorbance of CV-stained biofilms at 595 nm. Controls were defined as 100%. Data are represented as mean ± standard deviation from at least three independent experiments. *P < 0.05; **P < 0.01; ***P < 0.001; NS, not significant.
Figure 4
Figure 4
Correlation of anti-biofilm activities among enzymes. (a) The means and standard deviations from biofilm inhibition assay (Fig. 2) were plotted using the data under the optimal biofilm conditions. Correlations of biofilm biomasses formed in the presence of the indicated enzymes are shown. (b) The means and standard deviations from biofilm destruction assay (Fig. 3) were plotted using the data under the optimal biofilm conditions. Correlations of biofilm biomasses after treatment with the indicated enzymes are shown. The correlation coefficient (R2) was determined by fitting the data as a linear model using Microsoft Excel 2010.
Figure 5
Figure 5
eDNA profiles in the ECM of S. aureus strains. eDNA was analysed by agarose gel electrophoresis (AGE) in extracted ECM from the indicated (a) MRSA and (b) MSSA strains cultured in the optimal medium for each strain. Molecular markers are shown at the extreme left of the gels. Strain names written in black, blue, and red represent low, medium, and high biofilm producers, respectively. All strains were cultured in the optimal medium required for biofilm formation as described in Fig. 1.
Figure 6
Figure 6
Relationship between Methicillin-resistance, eDNA level, biofilm-forming capacity, and PIA-dependency of biofilm formation. eDNA in the extracted ECM of the MRSA and MSSA strains were quantified. Band intensities on agarose gels (Fig. 5) were estimated. (a) Relationship between biofilm-forming capacity and eDNA level was analysed in MRSA and MSSA. The strains were categorised into three groups: low, medium, and high biofilm producers. (b) Relationship between biofilm-forming capacity and biofilm PIA-dependency was analysed in the biofilm high producers. The strains were categorised into two groups: PIA-independent (non-PIA) and -dependent (PIA) biofilm producers. (c) Relationship between eDNA level and PIA-dependency of biofilm formation was analysed in the biofilm high producers. The line in each box plot represents the median eDNA level of the indicated groups. ○, outlying values; *P < 0.05; ***P < 0.001; NS, not significant.
Figure 7
Figure 7
Effects of glucose and NaCl on production of eDNA. The indicated strains of MRSA and MSSA were cultured in BHI, BHIG, and BHIN media, and levels of eDNA in the extracted ECM were analysed by AGE as described in Fig. 5.

References

    1. Hall-Stoodley L, Costerton JW, Stoodley P. Bacterial biofilms: from the natural environment to infectious diseases. Nat. Rev. Microbiol. 2004;2:95–108. doi: 10.1038/nrmicro821. - DOI - PubMed
    1. Flemming HC, et al. Biofilms: an emergent form of bacterial life. Nat. Rev. Microbiol. 2016;14:563–575. doi: 10.1038/nrmicro.2016.94. - DOI - PubMed
    1. Flemming HC, Wingender J. The biofilm matrix. Nat. Rev. Microbiol. 2010;8:623–6233. doi: 10.1038/nrmicro2415. - DOI - PubMed
    1. Boles BR, Horswill AR. Staphylococcal biofilm disassembly. Trends Microbiol. 2011;19:449–455. doi: 10.1016/j.tim.2011.06.004. - DOI - PMC - PubMed
    1. Lister JL, Horswill AR. Staphylococcus aureus biofilms: recent developments in biofilm dispersal. Front. Cell Infect. Microbiol. 2014;4:178. doi: 10.3389/fcimb.2014.00178. - DOI - PMC - PubMed

Publication types

MeSH terms