. 2018 Feb 2;8(1):2309.
doi: 10.1038/s41598-018-20558-z.

A multidrug ABC transporter with a taste for GTP

Affiliations

A multidrug ABC transporter with a taste for GTP

Cédric Orelle et al. Sci Rep. .

Abstract

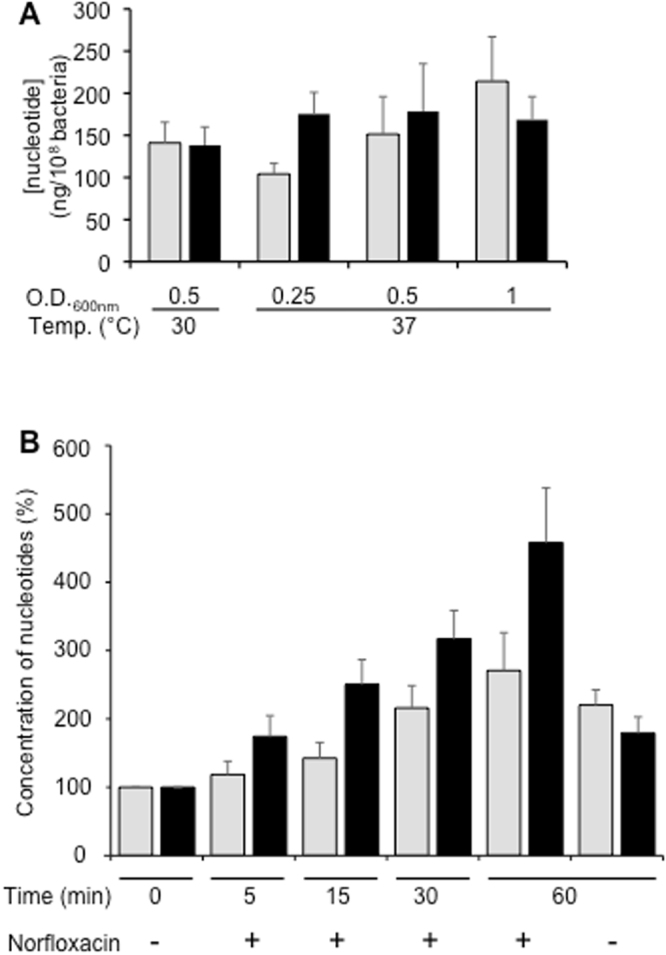
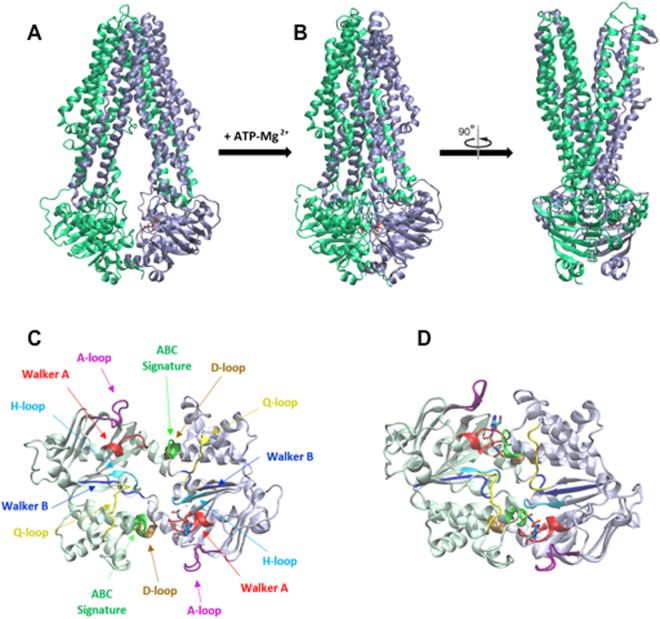
During the evolution of cellular bioenergetics, many protein families have been fashioned to match the availability and replenishment in energy supply. Molecular motors and primary transporters essentially need ATP to function while proteins involved in cell signaling or translation consume GTP. ATP-Binding Cassette (ABC) transporters are one of the largest families of membrane proteins gathering several medically relevant members that are typically powered by ATP hydrolysis. Here, a Streptococcus pneumoniae ABC transporter responsible for fluoroquinolones resistance in clinical settings, PatA/PatB, is shown to challenge this concept. It clearly favors GTP as the energy supply to expel drugs. This preference is correlated to its ability to hydrolyze GTP more efficiently than ATP, as found with PatA/PatB reconstituted in proteoliposomes or nanodiscs. Importantly, the ATP and GTP concentrations are similar in S. pneumoniae supporting the physiological relevance of GTP as the energy source of this bacterial transporter.


Conflict of interest statement

The authors declare that they have no competing interests.

Figures

Figure 1
Figure 1
Hoechst transport of PatA/PatB and BmrC/BmrD. Hoechst 33342 (1 µM) was added to inside-out vesicles containing overexpressed wild-type PatA/PatB (50 µg of total proteins; panels A and B) or wild-type BmrC/BmrD (200 µg of total proteins; panels C and D) and transport activities were monitored at 25 °C (A and C) or 37 °C (B and D) upon addition of 2 mM ATP (black traces) or 2 mM GTP (red traces), as indicated by the arrows. Data were normalized to 100%. As a control, the inactive Lys to Ala Walker-A double mutants was also used (green and blue traces, in the presence of ATP and GTP, respectively) for PatA/PatB (panels A and B) or BmrC/BmrD (panels C and D). The insets are cropped SDS-PAGE of E. coli membrane vesicles showing the level of overexpressed wild-type (wt) or double mutants (K/A) for PatA/PatB (panel A) or BmrC/BmrD (panel C; positions are indicated by arrowheads on the right). Original (uncropped) SDS-PAGE are shown in Fig. S2. The sizes of the molecular weight markers (MW) are also indicated of the left (in kDa). A representative experiment of ten (panels A and B) and three independent experiments (panels C and D) is shown here. Depending on the membrane batches, the Hoechst transport specifically catalyzed by PatA/PatB at 37 °C (i.e. corrected from the basal transport displayed by the inactive mutant) is, at least, always 4 fold better when fueled with GTP as compared to ATP.
Figure 2
Figure 2
Doxorubicin transport of PatA/PatB and BmrC/BmrD. The experimental conditions were similar to those used in Fig. 1 except that 2 µM of Doxorubicin was added to inside-out vesicles containing overexpressed wild-type PatA/PatB (panels A and B, 50 and 100 µg of total proteins, respectively) or wild-type BmrC/BmrD (panels C and D, 200 µg of total proteins) and transport activity was monitored at 25 °C (A and C) or 37 °C (B and D) upon addition of 2 mM ATP (black traces) or 2 mM GTP (red traces), as indicated by the arrows. Data were normalized to 100%. The inactive Lys to Ala Walker-A double mutants were also used (green and blue traces, in the presence of ATP and GTP, respectively). The initial jump of fluorescence following nucleotide addition is due to the nucleotide inner effect filter at the wavelength used here. A representative experiment of triplicates is shown here.
Figure 3
Figure 3
Effect of nucleotide concentration on the Hoechst transport activity of PatA/PatB. 1 µM Hoechst was added to inside-out vesicles containing overexpressed wild-type PatA/PatB or PatA/PatB Walker A double mutant (50 µg of total membrane protein each). The initial transport rates were measured just after the addition of ATP (white dots) or GTP (black dots) at 25 °C (A) or 37 °C (B) and the values obtained for the wild-type were corrected by those obtained with the double mutant. A representative experiment of two separate experiments is shown here. Triplicates were realized for each nucleotide concentration using the same batch of inside-out vesicles preparation and the error bars represent the standard deviation of the mean.
Figure 4
Figure 4
NTPase activities of PatA/PatB reconstituted into proteoliposomes. The ATPase and GTPase activities of purified PatA/PatB reconstituted into proteoliposomes were measured at 37 °C and are shown in black and white symbols, respectively. Data are the average of two separate experiments, each of them being performed with a different batch of purified PatA/PatB. Error bars represent the standard deviation of the mean. The fitted parameters obtained with GraFit 7.0 are Vmax 356 ± 39 nmol/min/mg proteins, KM 2.83 ± 0.5 mM and nH 1.73 ± 0.34 for the ATPase activity and Vmax 2660 ± 279 nmol/min/mg proteins, KM 2.64 ± 0.46 mM and nH1.74 ± 0.33 for the GTPase activity.
Figure 5
Figure 5
Effect of the temperature on NTP hydrolysis activities of PatA/PatB reconstituted into nanodiscs. Hydrolysis activity of PatA/PatB (4 µg) incorporated into nanodiscs was measured at 340 nm upon addition of 4 mM ATP (grey bars) or 4 mM of GTP (black bars). Error bars represent the standard deviation of the mean for three independent measurements. (A) Nanodiscs were prepared from E. coli lipids and NTPase activities were determined at the indicated temperatures. (B) Nanodiscs were prepared from S. pneumoniae lipids and NTPase activities were determined at 30 °C and 37 °C with or without 4 mM orthovanadate.
Figure 6
Figure 6
Intracellular concentrations of ATP and GTP. (A) S. pneumonia were grown in TH medium at 30 °C or 37 °C until the indicated absorbance then rapidly filtered and frozen in liquid nitrogen before nucleotides extraction. Concentrations of ATP (grey bars) and GTP (black bars) were determined by mass spectrometry and were expressed in ng per 108 bacteria. Error bars represent the standard deviation of the mean for five separate experiments. (B) S. pneumonia were grown in TH medium at 37 °C and when the absorbance at 600 nm reached 0.25, they were exposed to 16 µg/mL of norfloxacin for the indicated period of time. Nucleotide concentrations were measured in control cultures before exposition to norfloxacin (T0) and after 60 min without exposition (T60 −). Bacteria were prepared as above and concentrations of ATP (grey bars) and GTP (black bars) were determined by mass spectrometry and expressed in % of the non-treated control (T0). The error bars represent the standard deviation of the mean for three (non-treated samples) or four (treated samples) separate experiments.
Figure 7
Figure 7
Structural models of PatA/PatB in the inward- and outward-facing conformations. The inward- and outward-facing models of PatA (ice blue) and PatB (green) are respectively based on the crystal structure of TM287/TM288 (PDB code 3QF4) with one AMP-PNP (Adenylylimidodiphosphate) bound to one NBD (A), and the crystal structure of Sav1866 (PDB code 2ONJ). In the latter, the two NBDs are closely packed with two bound AMP-PNP sandwiched at their interface (B). The NBDs viewed from the top are in the inward-facing conformation (C) or outward-facing conformation (D). Conserved motifs are colored in red (Walker A), blue (Walker B), green (ABC signature), purple (A-loop), brown (D-loop), cyan (H-loop) and yellow (Q-loop). The figure was prepared using VMD 1.9.3. All the structures are represented in the new cartoon mode and nucleotides are shown in licorice representation in atom coloring mode.

References

    1. Geourjon C, et al. A common mechanism for ATP hydrolysis in ABC transporter and helicase superfamilies. Trends Biochem Sci. 2001;26:539–544. doi: 10.1016/S0968-0004(01)01907-7. - DOI - PubMed
    1. Caetano-Anolles G, Kim HS, Mittenthal JE. The origin of modern metabolic networks inferred from phylogenomic analysis of protein architecture. Proceedings of the National Academy of Sciences of the United States of America. 2007;104:9358–9363. doi: 10.1073/pnas.0701214104. - DOI - PMC - PubMed
    1. Saraste M, Sibbald PR, Wittinghofer A. The P-loop–a common motif in ATP- and GTP-binding proteins. Trends Biochem Sci. 1990;15:430–434. doi: 10.1016/0968-0004(90)90281-F. - DOI - PubMed
    1. Leipe DD, Koonin EV, Aravind L. Evolution and classification of P-loop kinases and related proteins. J Mol Biol. 2003;333:781–815. doi: 10.1016/j.jmb.2003.08.040. - DOI - PubMed
    1. Park J, Lappe M, Teichmann SA. Mapping protein family interactions: intramolecular and intermolecular protein family interaction repertoires in the PDB and yeast. J Mol Biol. 2001;307:929–938. doi: 10.1006/jmbi.2001.4526. - DOI - PubMed

Publication types

MeSH terms

Substances

LinkOut - more resources