. 2018 Apr;92(4):1507-1524.
doi: 10.1007/s00204-018-2170-7. Epub 2018 Feb 3.

Cell death mechanisms of the anti-cancer drug etoposide on human cardiomyocytes isolated from pluripotent stem cells

Affiliations

Cell death mechanisms of the anti-cancer drug etoposide on human cardiomyocytes isolated from pluripotent stem cells

Harshal Nemade et al. Arch Toxicol. 2018 Apr.

Abstract

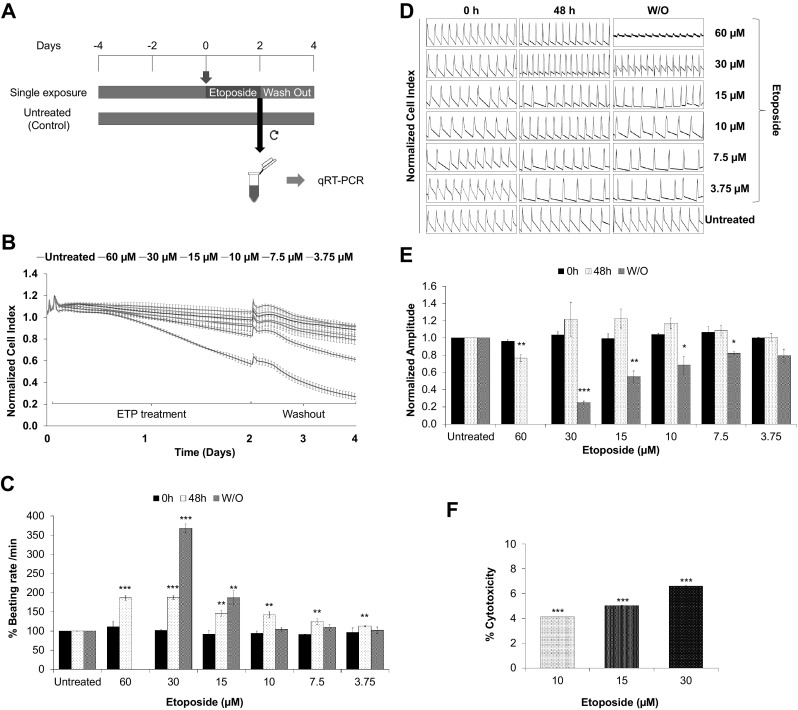
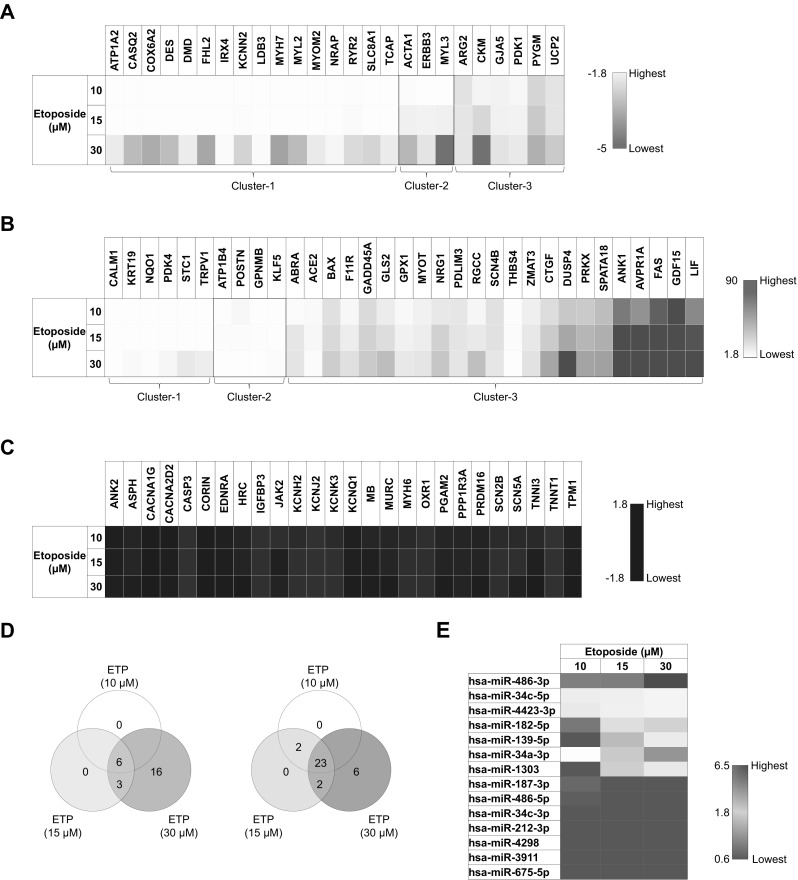
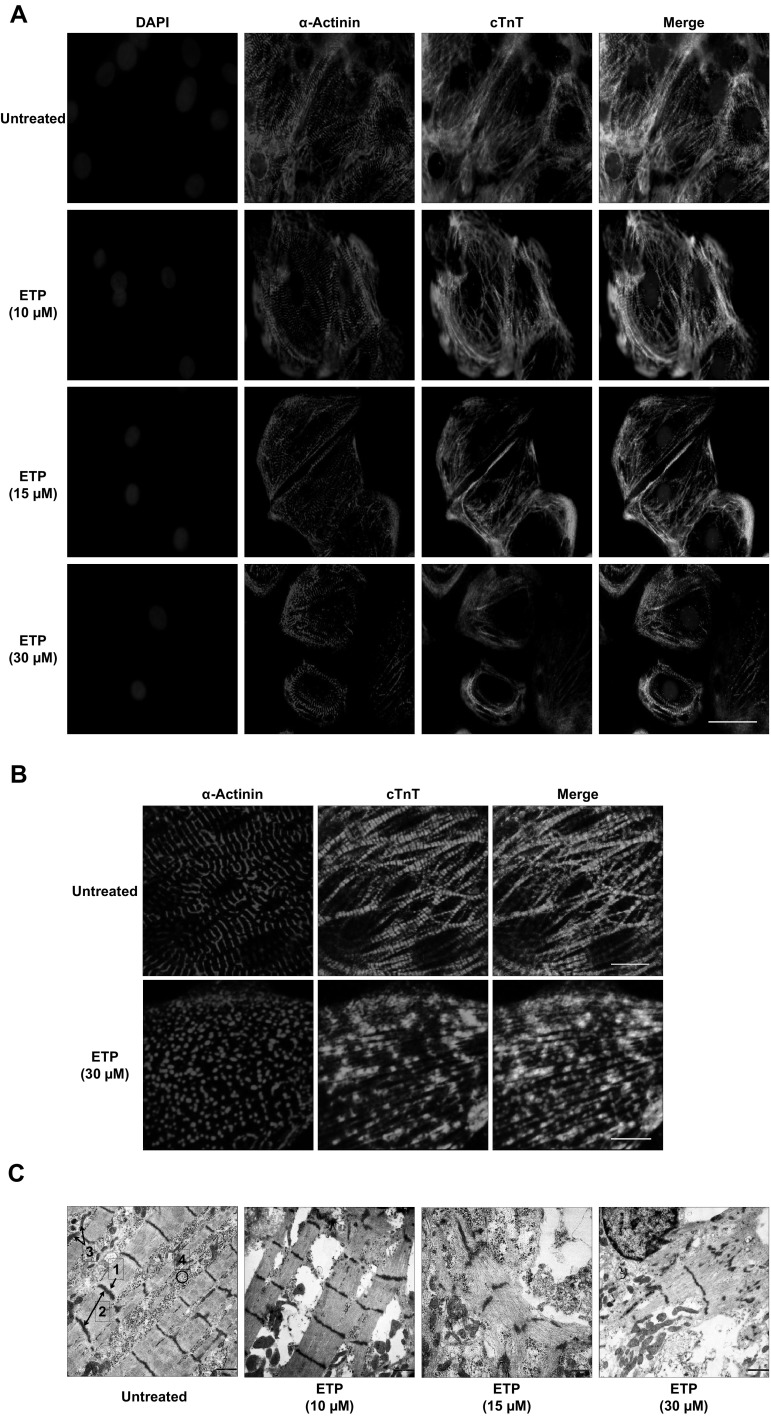
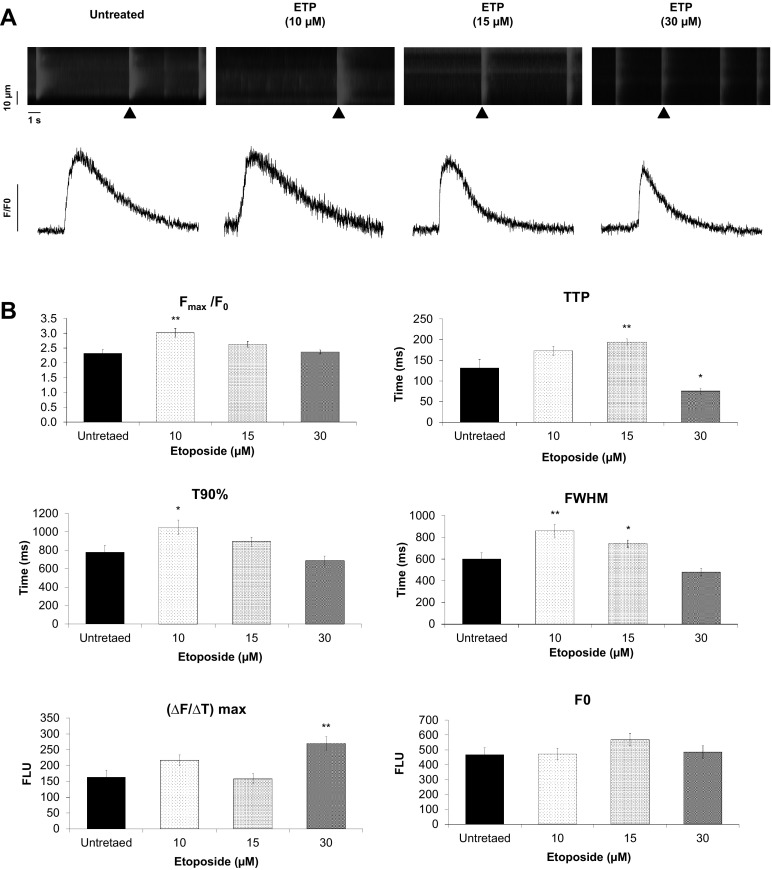
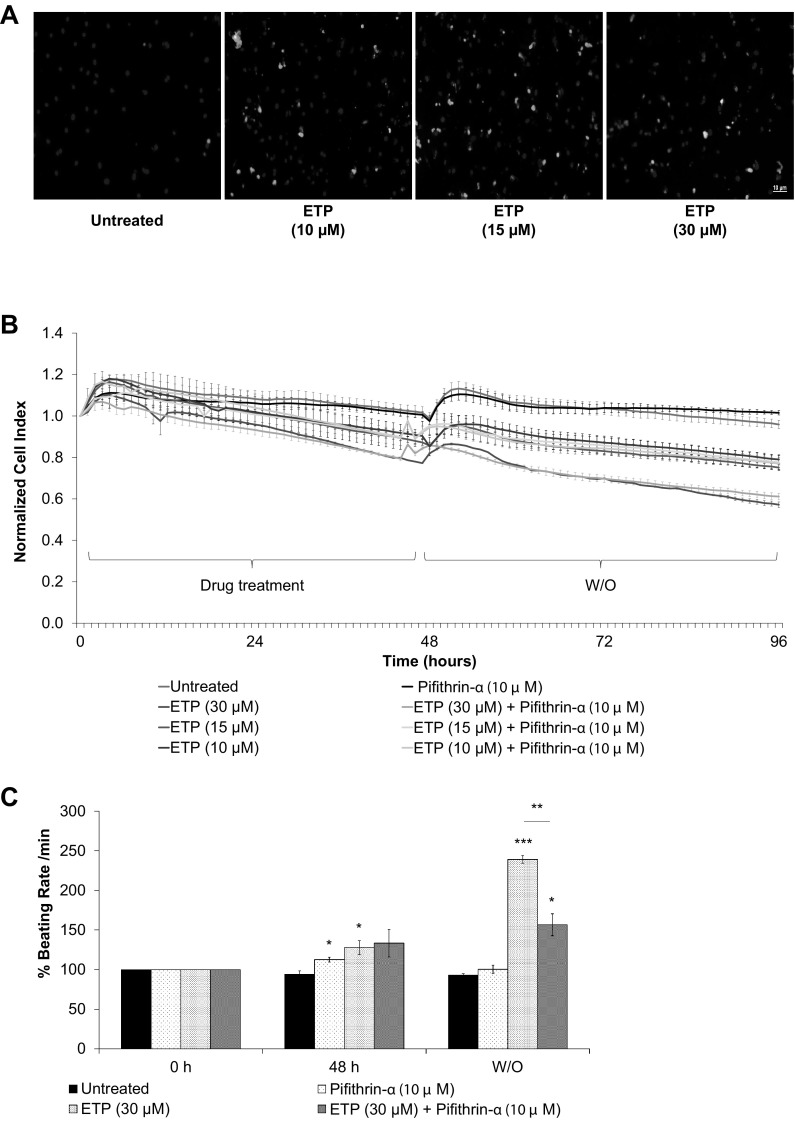
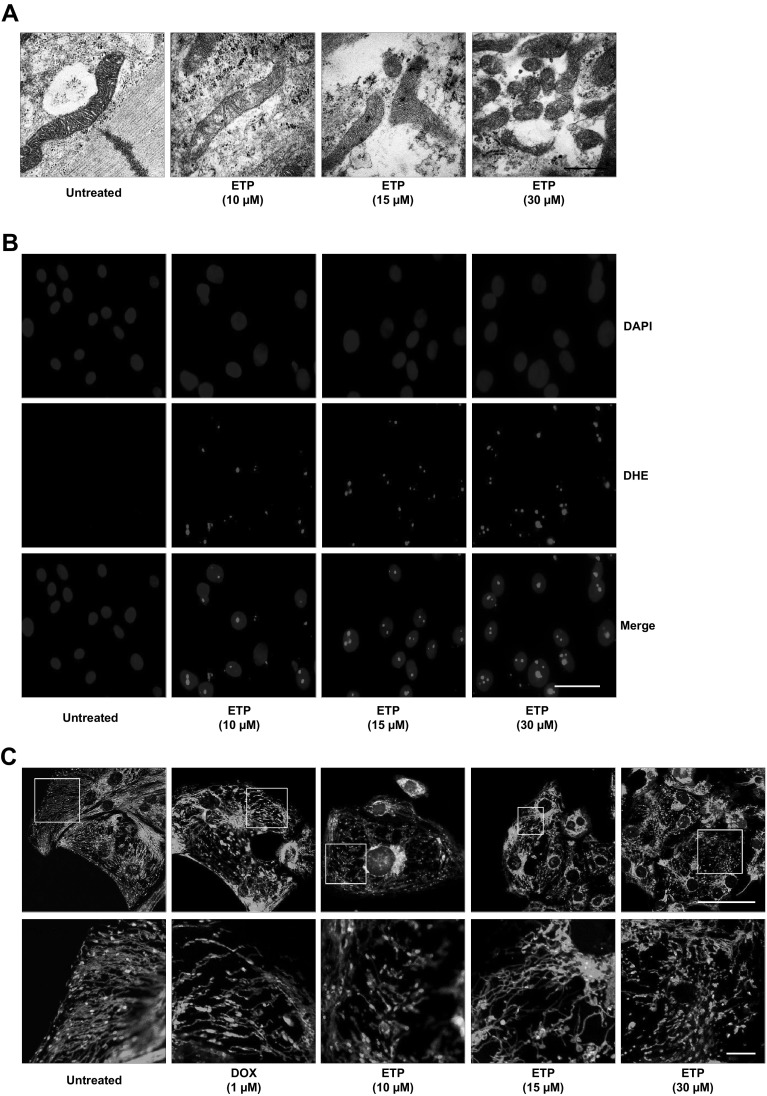
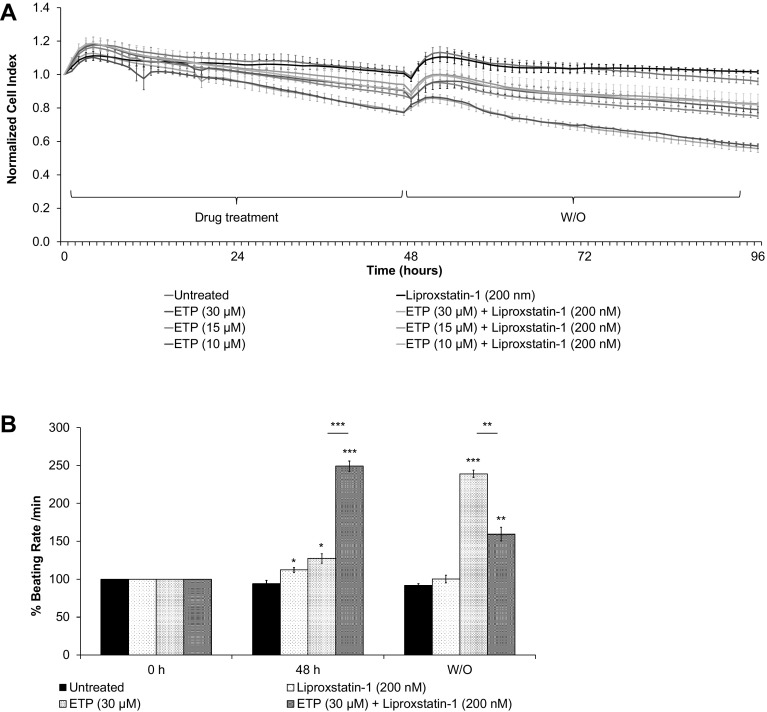
Etoposide (ETP) and anthracyclines are applied for wide anti-cancer treatments. However, the ETP-induced cardiotoxicity remains to be a major safety issue and the underlying cardiotoxic mechanisms are not well understood. This study is aiming to unravel the cardiotoxicity profile of ETP in comparison to anthracyclines using physiologically relevant human pluripotent stem cell-derived cardiomyocytes (hPSC-CMs). Using xCELLigence real-time cell analyser (RTCA), we found that single high dose of ETP induces irreversible increase in hPSC-CMs beating rate and decrease in beating amplitude. We also identified 58 deregulated genes consisting of 33 upregulated and 25 downregulated genes in hPSC-CMs after ETP treatment. Gene ontology (GO) and pathway analysis showed that most upregulated genes are enriched in GO categories like positive regulation of apoptotic process, regulation of cell death, and mitochondria organization, whereas most downregulated genes were enriched in GO categories like cytoskeletal organization, muscle contraction, and Ca2+ ion homeostasis. Moreover, we also found upregulation in 5 miRNAs (has-miR-486-3p, has-miR-34c-5p, has-miR-4423-3p, has-miR-182-5p, and has-miR-139-5p) which play role in muscle contraction, arginine and proline metabolism, and hypertrophic cardiomyopathy (HCM). Immunostaining and transmission electron microscopy also confirmed the cytoskeletal and mitochondrial damage in hPSC-CMs treated with ETP, as well as noticeable alterations in intracellular calcium handling and mitochondrial membrane potential were also observed. The apoptosis inhibitor, Pifithrin-α, found to protect hPSC-CMs from ETP-induced cardiotoxicity, whereas hPSC-CMs treated with ferroptosis inhibitor, Liproxstatin-1, showed significant recovery in hPSC-CMs functional properties like beating rate and amplitude after ETP treatment. We suggest that the damage to mitochondria is a major contributing factor involved in ETP-induced cardiotoxicity and the activation of the p53-mediated ferroptosis pathway by ETP is likely the critical pathway in ETP-induced cardiotoxicity. We also conclude that the genomic biomarkers identified in this study will significantly contribute to develop and predict potential cardiotoxic effects of novel anti-cancer drugs in vitro.

Keywords: Apoptosis; Calcium; Cardiomyocytes; Cardiotoxicity; Human pluripotent stem cells; Non-animal testing; Safety assessment.


Conflict of interest statement

The authors declare no conflict of interest.

Figures

Fig. 1
Fig. 1
Single high dose of etoposide induces arrhythmic beating and cytotoxicity in hiPSC-CMs. a Schematic representation and experimental setup of the in vitro cardiotoxicity test model. For functional studies, the synchronously beating hiPSC-CMs in the E-plate Cardio 96 were exposed to ETP (single high-dose exposure) for 48 h. After exposure, the ETP was washed out and the cells were further incubated for 48 h. The effects of ETP on hPSC-CMs functional characteristics were monitored by the xCELLigence RTCA Cardio system. For qRT-PCR studies, RNA from ETP-treated and untreated control cells were harvested at day 2. be Functional studies of ETP-treated hiPSC-CMs. The representative graphs display, b normalized CI values showing ETP-induced cytotoxicity (n = 3, error bars represent ± SEM), c % beating rate alterations induced by single dose of ETP in hiPSC-CMs (n = 3, error bars represent ± SEM) (t test, *p < 0.05, **p < 0.01, ***p < 0.001), d representative 12 s beating traces of hiPSC-CMs before, during and after the ETP treatment, e normalized amplitude showing significant drop after ETP treatment (n = 3, error bars = ± SEM) (t test, *p < 0.05, **p < 0.01, ***p < 0.001). f ETP-induced cytotoxicity was assessed by LDH leakage assay. The graph shows % cytotoxicity induced by ETP compared to untreated control (n = 3, error bars represent ± SEM) (t test, *p ≤ 0.05, **p ≤ 0.01, ***p ≤ 0.001)
Fig. 2
Fig. 2
Etoposide deregulates cluster of genomic and miRNA biomarkers in hiPSC-CMs. Heat maps showing ETP-induced deregulation of genomic and miRNA markers in CMs. a Represents genes downregulated after ETP treatment (n = 3, fold change ≤ − 1.8). b Represents genes upregulated after ETP treatment (n = 3, fold change ≥ 1.8). c Represents genes with no significant change in expression level after ETP treatment (n = 3). d Venn diagram showing commonly deregulated genes in groups with different ETP concentrations (n = 3). e Represents deregulated miRNA markers (n = 3)
Fig. 3
Fig. 3
Etoposide induces cytoskeletal disorganization in hiPSC-CMs. a, b Immunostaining of cardiac sarcomeric α-actinin (α-Actinin) and cardiac troponin T (cTnT) in untreated and ETP-treated hiPSC-CMs. Nuclei are stained with DAPI. Scale bar represents 50, 5 µm. c Represents TEM images of untreated and ETP-treated hiPSC-CMs. Scale bar represents 5000 nm. (1, Z-line; 2, sarcomere; 3, mitochondria; 4, myofibril bundles)
Fig. 4
Fig. 4
Etoposide causes alterations in calcium handling in hiPSC-CMs. a Confocal line-scan images showing changes in intracellular [Ca2+]i in a Rhod-2, AM loaded hiPSC-CM. The images show alterations in spontaneous whole-cell Ca2+ transients in response to ETP treatment (upper panel). Scale bar represents, time − 1 s and distance − 10 µm. Representative tracings of spontaneous Ca2+ transients (black arrow head) in hiPSC-CMs from untreated and ETP-treated groups (lower panel). b Graphs representing Ca2+ transient parameters measured from hiPSC-CMs treated with ETP. F/F0, Ca2+ transient amplitude where F0 is the averaged background-corrected resting fluorescence intensity; TTP, time-to-peak; T90%, 90% recovery of Fmax; [ΔFT]max, the maximum steepness; FWHM, full-width at half-maximum. (n = 25, error bars represent ± SEM) (t test, *p ≤ 0.05, **p ≤ 0.01)
Fig. 5
Fig. 5
Etoposide upregulates apoptosis signaling in hiPSC-CMs. a Fluorescent images showing live cells (blue), apoptotic cells (green), and necrotic cells (red) in hiPSC-CMs after ETP treatment for 48 h. Scale bar represents 10 µm. b, c hiPSC-CMs were co-treated with ETP and 10 µM Pifithrin-α for 48 h. Real-time data of hPSC-CMs cell index and beating rate were obtained using xCELLigence RTCA system. Representative graphs display normalized CI and % beating rate values, respectively, showing Pifithrin-α had significant effect in preventing ETP-induced cardiotoxicity (n = 3, error bars represent ± SEM) (t test, *p ≤ 0.05, ***p ≤ 0.001) (see also Fig. S2A). (Color figure online)
Fig. 6
Fig. 6
Etoposide induces mitochondrial damage, increased ROS production and loss of mitochondrial membrane potential (mψ) in hiPSC-CMs. a TEM images showing morphological alterations in mitochondrial membrane and cristae structures in hiPSC-CMs treated with ETP compared to untreated CMs. Scale bar represents 500 nm. b Fluorescent images showing increase DHE staining in hiPSC-CMs treated with ETP compared to untreated CMs, indicating net increase in ROS production. Nuclei are stained with DAPI which also show increased nuclear size after ETP treatment. Scale bar represents 20 µm. c Determination of mitochondrial membrane potential through JC-1 staining. Mitochondria of hiPSC-CMs after incubation with JC-1 dye, illustrating the heterogeneity in mitochondrial membrane potential in the same cell. The mitochondria membrane potential was found to be interrupted after DOX (positive control) and ETP treatment, as evidenced by reduction in the JC-1 red fluorescence signal. In addition hPSC-CMs treated with 30 µm ETP for 48 h showed increased mitochondrial fragmentation further supporting the TEM data. Scale bar represents 20 µm (upper panel), 5 µm (lower panel)
Fig. 7
Fig. 7
Liproxstatin-1 improves cardiomyocytes functional properties after etoposide treatment. The hiPSC-CMs were co-treated with ETP and 200 nM Liproxstatin-1 (ferroptosis inhibitor) for 48 h. Real-time data of hPSC-CMs cell index, beating rate, and beating amplitude were obtained using xCELLigence RTCA system. Representative graphs display a normalized CI and b % beating rate values, respectively, showing even though Liproxstatin-1 had no significant effect in preventing ETP-induced cytotoxicity; it significantly improved hPSC-CMs ability to recover from ETP-induced alterations in beating rate and beating amplitude (n = 3, error bars represent ± SEM) (t test, *p ≤ 0.05, **p ≤ 0.01, ***p ≤ 0.001) (see also Fig. S3A)

References

    1. Arola OJ, Saraste A, Pulkki K, Kallajoki M, Parvinen M, Voipio-Pulkki L-M. Acute doxorubicin cardiotoxicity involves cardiomyocyte apoptosis. Cancer Res. 2000;60:1789–1792. - PubMed
    1. Benov L, Sztejnberg L, Fridovich I. Critical evaluation of the use of hydroethidine as a measure of superoxide anion radical. Free Radic Biol Med. 1998;25:826–831. doi: 10.1016/S0891-5849(98)00163-4. - DOI - PubMed
    1. Bernard P, Cellarier G, Cremades S, Gisserot O, De Jaureguiberry JP. Early myocardial infarction associated with chemotherapy for testicular cancer. Rev Med Interne. 2006;27:497–498. doi: 10.1016/j.revmed.2006.01.009. - DOI - PubMed
    1. Canobbio L, Fassio T, Gasparini G, Caruso G, Barzan L, Comoretto R, Brema F, Villani F. Cardiac arrhythmia: possible complication from treatment with cisplatin. Tumori. 1986;72:201–204. - PubMed
    1. Chan FK, Moriwaki K, De Rosa MJ. Detection of necrosis by release of lactate dehydrogenase activity. Methods Mol Biol. 2013;979:65–70. doi: 10.1007/978-1-62703-290-2_7. - DOI - PMC - PubMed

MeSH terms