. 2018 Feb 8;172(4):706-718.e15.
doi: 10.1016/j.cell.2018.01.008. Epub 2018 Feb 1.

Dopamine Secretion Is Mediated by Sparse Active Zone-like Release Sites

Affiliations

Dopamine Secretion Is Mediated by Sparse Active Zone-like Release Sites

Changliang Liu et al. Cell. .

Abstract

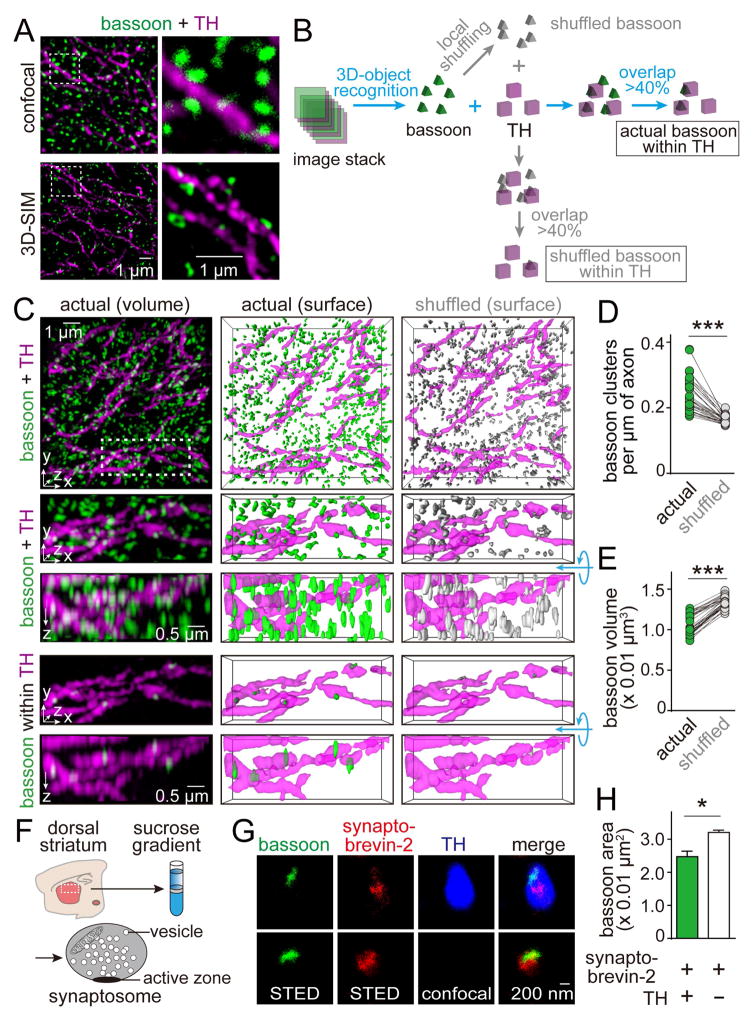
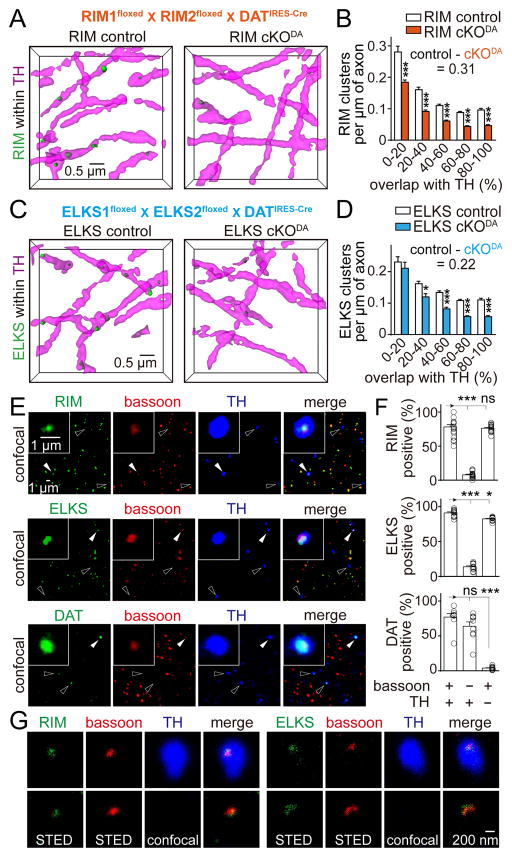
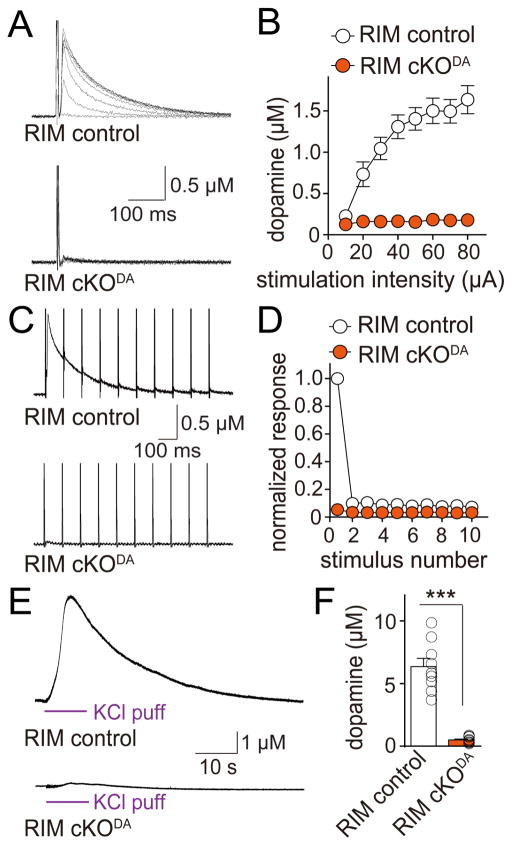
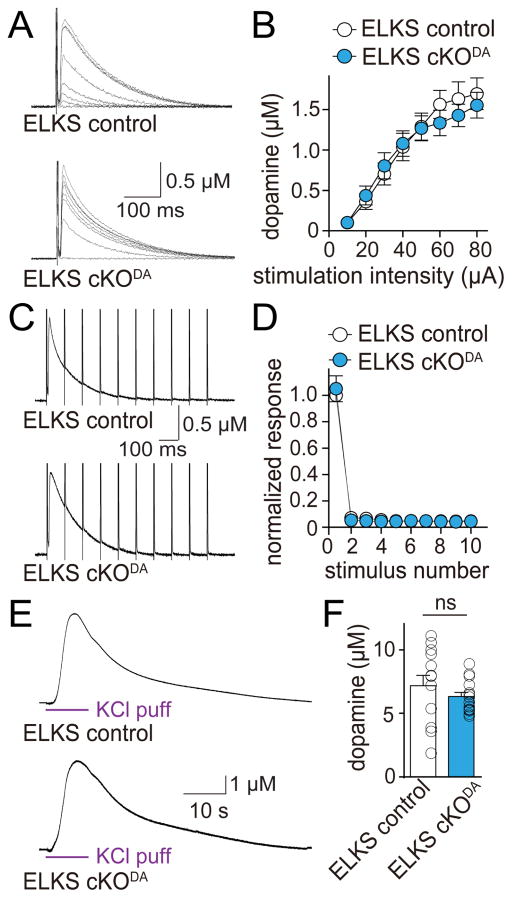
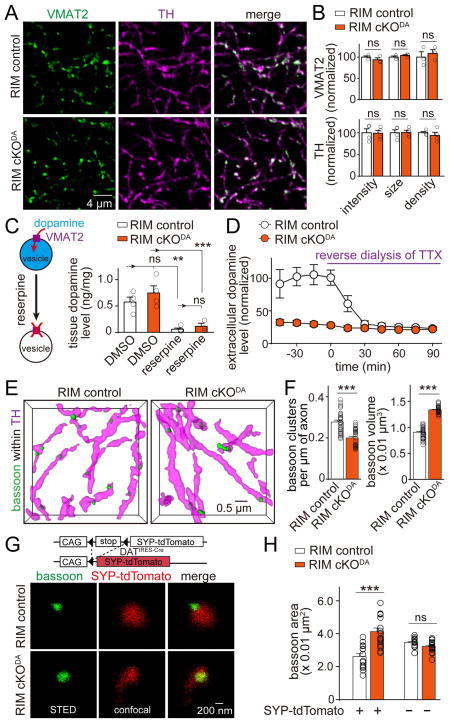
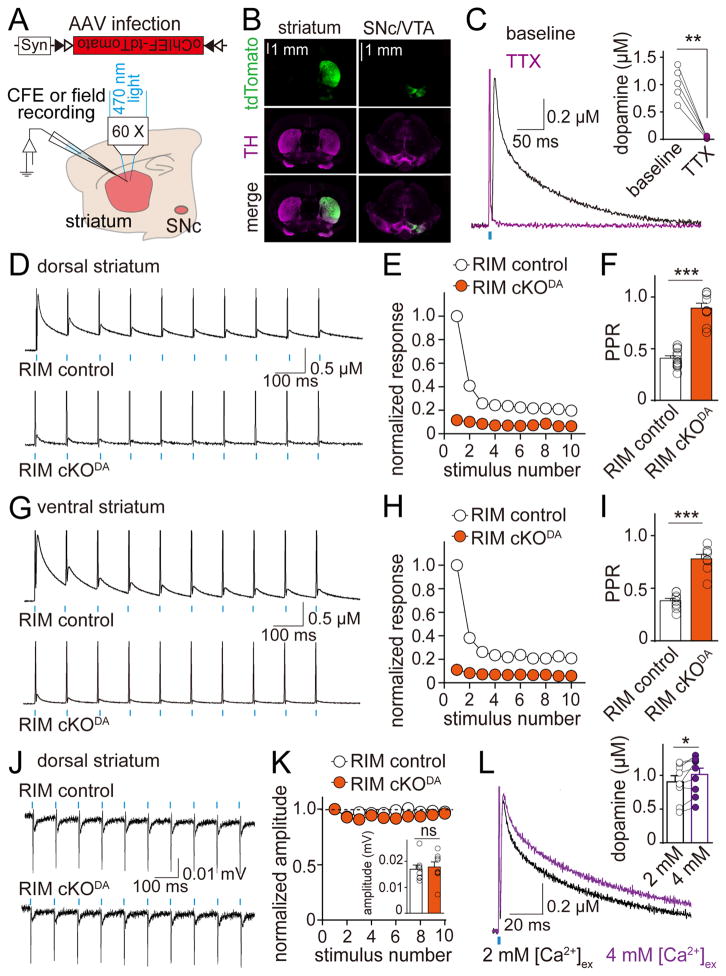
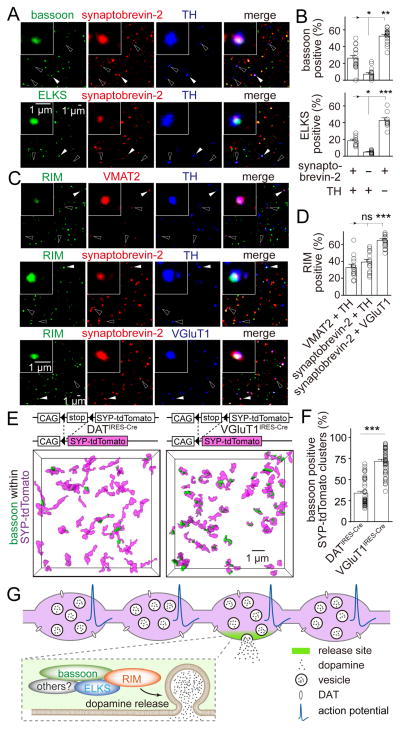
Dopamine controls essential brain functions through volume transmission. Different from fast synaptic transmission, where neurotransmitter release and receptor activation are tightly coupled by an active zone, dopamine transmission is widespread and may not necessitate these organized release sites. Here, we determine whether striatal dopamine secretion employs specialized machinery for release. Using super resolution microscopy, we identified co-clustering of the active zone scaffolding proteins bassoon, RIM and ELKS in ∼30% of dopamine varicosities. Conditional RIM knockout disrupted this scaffold and, unexpectedly, abolished dopamine release, while ELKS knockout had no effect. Optogenetic experiments revealed that dopamine release was fast and had a high release probability, indicating the presence of protein scaffolds for coupling Ca2+ influx to vesicle fusion. Hence, dopamine secretion is mediated by sparse, mechanistically specialized active zone-like release sites. This architecture supports spatially and temporally precise coding for dopamine and provides molecular machinery for regulation.

Keywords: ELKS; RIM; active zone; bassoon; dopamine; exocytosis; striatum; superresolution; varicosity; volume transmission.


Conflict of interest statement

Declaration of Interests

The authors declare no competing interests.

Figures

Figure 1
Figure 1. Dopamine axons in the dorsal striatum contain bassoon clusters
(A) Projections of 1 μm thick image stacks of the mouse striatum labeled with TH (magenta) and bassoon (green) antibodies, acquired by confocal (top) or 3D-SIM microscopy (bottom). (B) Schematic illustrating analyses of 3D-SIM images. The overlap between bassoon and TH was calculated after object recognition in each channel. A bassoon cluster was considered to be within TH when the volume overlap was >40% (Figure S1A). To determine whether this association is different from artificial overlap, each bassoon cluster was locally shuffled within 1 × 1 × 1 μm3 (shuffled bassoon), and the overlap of shuffled bassoon with TH was calculated. 1,000 rounds of shuffling and overlap calculation were averaged. (C) Representative 3D-SIM images showing distribution of bassoon clusters (green) and TH-labeled dopamine axons (magenta) in dorsal striatal slices (top). Images were obtained by volume rendering (left) of the raw image stack (top, 10 × 10 × 2 μm3, a zoom-in of 5 × 2 × 2 μm3 is shown below), surface rendering of objects (middle), and surface rendering after local shuffling of bassoon objects (right). The bottom rows show bassoon clusters within dopamine axons. For each zoom-in image, a 90° rotation around the x-axis is shown below the standard x-y-z image. For a 3D representation, see Movie S1. (D, E) Quantification of the density (D) and volume (E) of bassoon clusters within dopamine axons before and after local shuffling. Each circle represents the average result of a region containing 6,000–11,000 bassoon clusters. n = 35 regions/4 mice. For individual overlap bins, see Figure S1A. (F) Schematic of the striatal synaptosome preparation. See Figures S1B–S1E for assessment of the subcellular fractionation by Western blotting, confocal microscopy and electron microscopy. (G) Image of bassoon and synaptobrevin-2 staining in TH positive (top) or negative (bottom) striatal synaptosomes. Bassoon and synaptobrevin-2 were imaged by STED microscopy, TH was imaged by confocal microscopy. (H) Quantification of the bassoon area in TH positive and TH negative synaptosomes. n = 48 synaptosomes/2 mice (TH positive), 1005/2 (TH negative). Data in H are mean ± SEM. *** p < 0.001, * p < 0.05; paired t test for (D, E), Mann-Whitney rank sum test for (H).
Figure 2
Figure 2. Bassoon, RIM and ELKS co-cluster in dopamine axons
(A) Representative surface rendered images (5 × 5 × 2 μm3) of RIM clusters within dopamine axons from RIM control and RIM cKODA mice, in which RIM is removed specifically in dopamine neurons by breeding conditional RIM1 and RIM2 knockout mice to DATIRES-Cre mice (Figure S2). RIM control mice were siblings that lack Cre. (B) Histogram of RIM cluster densities within dopamine axons across 20% bins of overlap. RIM control n = 24 regions/4 mice, RIM cKODA n = 22/4 (p < 0.001 for genotype, p < 0.001 for overlap, and p < 0.01 for interaction; two-way ANOVA, p-values of pairwise post tests indicated in figure). For detailed sample images and data analyses including shuffling, see Figure S2. (C, D) Same as (A) and (B), except showing representative images (C) and quantification (D) of ELKS clusters in ELKS control and ELKS cKODA mice. ELKS control n = 29/4, ELKS cKODA 27/4 (p < 0.001 for genotype, p < 0.001 for overlap, and p = 0.37 for interaction; two-way ANOVA, p-values of pairwise post tests indicated in figure). For detailed sample images and data analyses including shuffling, see Figure S3. (E) Confocal images of striatal synaptosomes. Filled arrowheads indicate synaptosomes containing bassoon and TH (insets). Hollow arrowheads indicate particles containing TH but not bassoon. (F) Quantification of the percentage of synaptosomes that contain RIM, ELKS or DAT in three different types of synaptosomes, defined by specific markers as indicated below the plots. Each circle represents the average result of an area with 1,500–6,000 synaptosomes. n = 18 areas/3 mice for RIM, 12/3 for ELKS and 9/3 for DAT. (G) Representative STED images of RIM (left) and ELKS (right) in synaptosomes co-labeled with bassoon in TH positive (top) and TH negative (bottom) synaptosomes. All data are mean ± SEM. *** p < 0.001, * p < 0.05, ns, not significant; two-way ANOVA for (B, D) and Kruskal-Wallis analysis of variance with post hoc Dunn’s test for (F).
Figure 3
Figure 3. RIM is essential for dopamine release in the dorsal striatum
(A) Sample traces of dopamine release evoked by electrical stimulation in slices of RIM cKODA and sibling RIM control mice. Dopamine release was measured using constant voltage amperometry, and dopamine concentrations were calculated based on electrode calibration (Figures S4A and S4B). In all electrophysiological experiments, RIM cKODA are mice in which RIM is removed specifically in dopamine neurons, and RIM control mice are siblings of RIM cKODA that have one wild-type allele for each RIM gene. (B) Quantification of peak amplitudes as shown in (A). RIM control n = 10 slices/3 mice, RIM cKODA 10/3 (p < 0.001 for genotype, stimulation intensity and interaction; two-way ANOVA). (C) Sample traces (average of 4 sweeps) of dopamine release evoked during 10 Hz electrical stimulation in RIM control and RIM cKODA mice. (D) Quantification of (C). Amplitudes were normalized to the average first amplitude in RIM control. RIM control n = 9 slices/3 mice, RIM cKODA n = 9/3 (p < 0.001 for genotype, stimulus number and interaction; two-way ANOVA). (E) Sample traces of dopamine release evoked by a local puff of 100 mM KCl for 10 s in RIM control and RIM cKODA mice. (F) Quantification of peak amplitude in (E). RIM control n = 9 slices/4 mice, RIM cKODA n = 10/4. All data are mean ± SEM. *** p < 0.001; two-way ANOVA for (B, D) and Mann-Whitney rank sum test for (F).
Figure 4
Figure 4. ELKS1α and ELKS2α are dispensable for dopamine release in the dorsal striatum
(A) Sample traces of dopamine release evoked by electrical stimulation in slices of ELKS cKODA and sibling ELKS control mice. In all electrophysiological experiments, ELKS cKODA are mice in which ELKS1α and ELKS2α are removed specifically in dopamine neurons, and ELKS control mice are siblings of ELKS cKODA that have one wild-type allele for each ELKS encoding gene. (B) Quantification of peak amplitude in (A). ELKS control n = 12 slices/4 mice, ELKS cKODA 12/4 (p = 0.53 for genotype, p < 0.001 for stimulation intensity and p = 0.92 for interaction; two-way ANOVA). (C) Sample traces (average of 4 sweeps) of dopamine release evoked during 10 Hz electrical stimulation in ELKS control and ELKS cKODA mice. (D) Quantification of (C). Amplitudes were normalized to the average first amplitude in ELKS control. ELKS control n = 12 slices/4 mice, ELKS cKODA n = 12/4 (p = 0.96 for genotype, p < 0.001 for stimulus number and p = 0.96 for interaction; two-way ANOVA). (E) Sample traces of dopamine release evoked by a local puff of 100 mM KCl for 10 s in ELKS control and ELKS cKODA mice. (F) Quantification of peak amplitude in (E). ELKS control n = 13 slices/5 mice, ELKS cKODA n = 15/5. All data are mean ± SEM. ns, not significant; two-way ANOVA for (B, D) and Mann-Whitney rank sum test for (F).
Figure 5
Figure 5. RIM organizes release sites in dopamine neurons
(A) Representative confocal images of VMAT2 and TH staining of the dorsal striatum in RIM control and RIM cKODA mice. (B) Quantification of fluorescence intensity, size and density of VMAT2 and TH staining for images shown in (A). Each dot represents the mean of a single animal (average of 6–8 images). RIM cKODA values were normalized to their corresponding RIM control. For VMAT2, RIM control n = 3 mice, RIM cKODA, n = 3. For TH, RIM control n = 4, RIM cKODA n = 4. (C) Quantification of tissue dopamine levels in the striatum measured by ELISA from mice after intraperitoneal injection of reserpine or DMSO two hours before the tissue harvest. Each dot is an average of two measurements from one animal. For DMSO, RIM control n = 4 mice, RIM cKODA n = 4. For reserpine, RIM control n = 5, RIM cKODA n = 3. (D) Quantification of in vivo extracellular dopamine levels in the striatum measured by microdialysis in anesthetized mice before and during reverse dialysis of TTX. Dopamine levels are expressed normalized to the average in RIM control before reverse dialysis of TTX. RIM control n = 5 mice, RIM cKODA n = 5 (p < 0.001 for baseline levels, not significant for levels after TTX). (E) Representative surface rendered images (5 × 5 × 2 μm3) of bassoon clusters within dopamine axons from RIM control and RIM cKODA mice. (F) Quantification of density and size of bassoon clusters within dopamine axons in RIM control and RIM cKODA mice. (G) Representative STED images of bassoon within dopamine synaptosomes from RIM control and RIM cKODA mice. Vesicles in dopaminergic neurons were labeled by crossing Cre-dependent synaptophysin-tdTomato mice (SYP-tdTomato) with DATIRES-Cre mice. For analysis of SYP-tdTomato expression in dopamine axons, and for analyses of Munc13 and Munc18 clusters, see Figure S5. (H) Quantification of the bassoon area in (G). Each circle is the average of an image with 600–2100 synaptosomes. RIM control n = 14 images/3 mice, RIM cKODA n = 18/3. All data are mean ± SEM. *** p < 0.001, **, p<0.01, ns, not significant; Mann-Whitney rank sum test for (B, F), Kruskal-Wallis analysis of variance with post hoc Dunn’s test for (C, D, H).
Figure 6
Figure 6. Dopamine release has a high release probability that requires RIM
(A) Schematic showing the experimental setup. DATIRES-Cre mice were transduced with a Cre-dependent AAV expressing oChIEF-tdTomato in the SNc and the VTA at P21–23 and recorded at P41–76. (B) oChIEF-tdTomato expression and TH immunofluorescence in striatum and midbrain. (C) Representative traces (average of 4 sweeps) and quantification of dopamine release evoked by light stimulation (1 ms pulse of blue light applied at the recording site) in dorsal striatal slices expressing oChIEF in dopamine axons before (black) and after (magenta) blocking action potentials with TTX. n = 5 slices/4 mice. (D) Example traces (average of 4 sweeps) of dopamine release evoked by 10 Hz light stimulation in dorsal striatum. (E) Quantification of (D). Amplitudes are normalized to the average first amplitude in RIM control. RIM control n = 15 slices/5 mice, RIM cKODA n = 13/5 (p < 0.001 for genotype and decay, p < 0.01 for interaction; two-way ANOVA). (F) Quantification of the paired pulse ratio (PPR) for the first two pulses in (E). RIM control n = 14/5, RIM cKODA n = 9/4. Responses smaller than 15 pA were not included in the PPR analysis. (G–I) Analyses identical to (D–F) but in the ventral striatum. RIM control n = 10/3, RIM cKODA n = 10/3 for (H, p < 0.001 for genotype and stimulus number, p < 0.01 for interaction; two-way ANOVA). RIM control n = 10/3, RIM cKODA n = 8/3 for (I). For additional analyses of optogenetically induced dopamine release, see Figure S6. (J) Example traces of extracellular recordings in dorsal striatum from RIM control and RIM cKODA mice under 10 Hz light stimulation. For detailed analyses, see Figure S7. (K) Quantification of (J) with responses normalized to the initial response. RIM control n = 7/3, RIM cKODA n = 8/3 (p = 0.17 for genotype, p < 0.05 for stimulus number, and p = 0.37 for interaction; two-way ANOVA). The inset bar graph indicates absolute initial amplitude. Each circle represents an average response of 100 stimuli from 1 slice. (L) Representative traces (average of 4 sweeps) and quantification of dopamine release in dorsal striatum evoked in 2 mM (black) and 4 mM (magenta) [Ca2+]ex by a 1 ms light stimulus. n = 9 slices/4 mice. For PPR, analyses in ventral striatum and comparison of RIM control and RIM cKODA mice, see Figure S6. All data are mean ± SEM. *** p < 0.001, ** p < 0.01, * p < 0.05, ns, not significant; paired t test for (C, L), two-way ANOVA for (E, H, K) and Mann-Whitney rank sum test for (F, I, K).
Figure 7
Figure 7. Many dopamine varicosities lack active zone-like release sites
(A) Representative confocal images of sparsely plated striatal synaptosomes stained for synaptobrevin-2, TH and bassoon (top) or ELKS (bottom). Filled arrowheads indicate synaptosomes containing all three markers. Hollow arrowheads indicate synaptosomes containing synaptobrevin-2 and TH but not bassoon or ELKS. (B) Quantification of (A) showing the percentage of particles that contain bassoon or ELKS. Each circle represents the average result of an area with 1,500–6,000 synaptosomes. n = 18 areas/3 mice for bassoon and 9/3 for ELKS. (C) Striatal synaptosomes stained for RIM, VMAT2 and TH (n = 14/3); RIM, synaptobrevin-2 and TH (n = 17/3); or RIM, synaptobrevin-2 and VGluT1 (n = 17/3). Filled arrowheads indicate synaptosomes (insets) containing both markers (VMAT2 and TH, synaptobrevin-2 and TH, or synaptobrevin-2 and VGluT1) and RIM. Hollow arrowheads indicate synaptosomes containing the same markers but not RIM. (D) Quantification of (C) showing the percentage of particles that contain RIM. n = 14 areas/3 mice for VMAT2 and TH positive synaptosomes, 17/3 for synaptobrevin-2 and TH positive synaptosomes and 17/3 for synaptobrevin-2 and VGluT1 positive synaptosomes. (E) Representative surface rendered 3D-SIM images of bassoon within vesicle clusters in the striatum. Vesicles in dopaminergic neurons or in glutamatergic neurons were labeled by crossing Cre-dependent synaptophysin-tdTomato mice (SYP-tdTomato) with DATIRES-Cre or VGluT1IRES-Cre mice, respectively. (F) Quantification of (E) showing the percentage of vesicle clusters associated with bassoon. SYP-tdTomato x DATIRES-Cre n = 49 regions/4 mice, SYP-tdTomato x VGluT1IRES-Cre n = 46/3. (G) Current model of cellular and molecular architecture for dopamine secretion. Most dopamine varicosities contain clusters of dopamine vesicles and DAT along dopamine axons, but only ~30% of them contain active zone-like release sites composed of the scaffolds bassoon, RIM, ELKS and likely other active zone proteins including Munc13. When action potentials propagate through dopamine axons, dopamine vesicles fuse at these sites with a very high release probability, and fusion requires the presence of RIM. This architecture generates a fast, local rise in dopamine followed by a rapid decay, which may support fast dopamine coding. All data are mean ± SEM. *** p < 0.001, ** p < 0.01, * p < 0.05, ns, not significant; Kruskal-Wallis analysis of variance with post hoc Dunn’s test for (B, D), Mann-Whitney rank sum test for (F).

Comment in

Similar articles

Cited by

References

    1. Acuna C, Liu X, Gonzalez A, Südhof TC. RIM-BPs Mediate Tight Coupling of Action Potentials to Ca2+-Triggered Neurotransmitter Release. Neuron. 2015;87:1234–1247. - PubMed
    1. Acuna C, Liu X, Südhof TC. How to Make an Active Zone: Unexpected Universal Functional Redundancy between RIMs and RIM-BPs. Neuron. 2016;91:792–807. - PubMed
    1. Agnati LF, Zoli M, Strömberg I, Fuxe K. Intercellular communication in the brain: Wiring versus volume transmission. Neuroscience. 1995;69:711–726. - PubMed
    1. Altrock WD, tom Dieck S, Sokolov M, Meyer AC, Sigler A, Brakebusch C, Fässler R, Richter K, Boeckers TM, Potschka H, et al. Functional inactivation of a fraction of excitatory synapses in mice deficient for the active zone protein bassoon. Neuron. 2003;37:787–800. - PubMed
    1. Augustin I, Rosenmund C, Sudhof TC, Brose N. Munc13-1 is essential for fusion competence of glutamatergic synaptic vesicles. Nature. 1999;400:457–461. - PubMed

Publication types