. 2018 Feb 19;28(4):609-615.e3.
doi: 10.1016/j.cub.2018.01.010. Epub 2018 Feb 1.

Self-Organized Attractor Dynamics in the Developing Head Direction Circuit

Affiliations

Self-Organized Attractor Dynamics in the Developing Head Direction Circuit

Joshua P Bassett et al. Curr Biol. .

Abstract

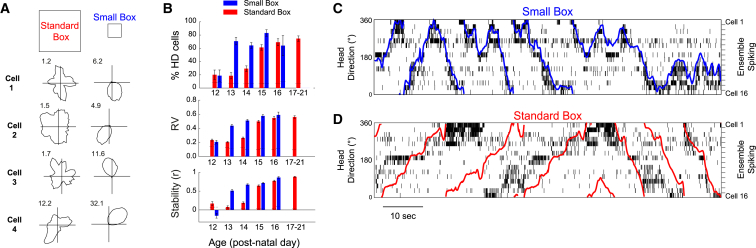
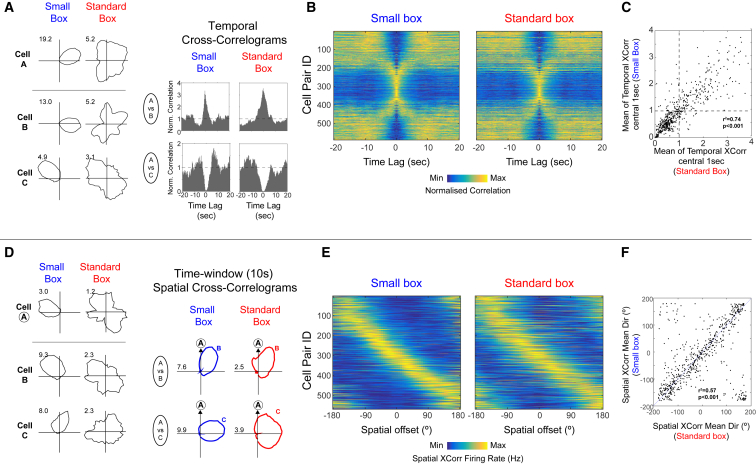
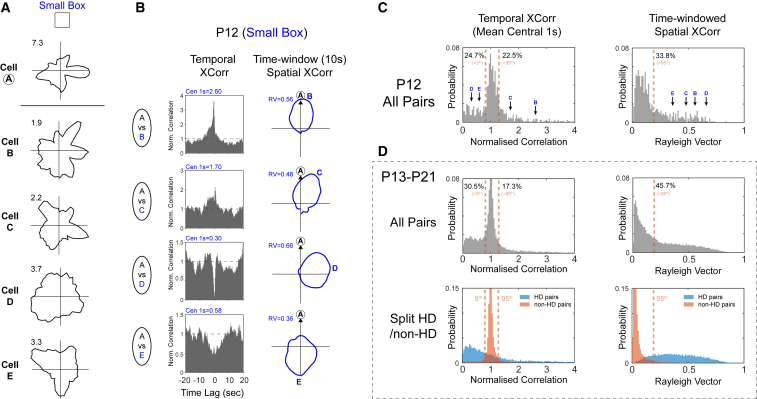
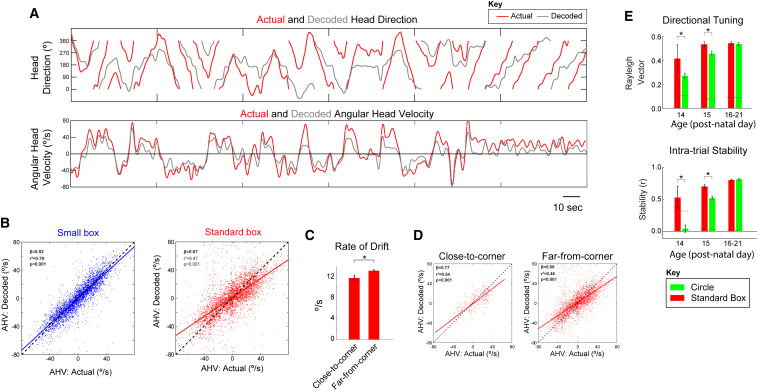
Head direction (HD) cells are neurons found in an extended cortical and subcortical network that signal the orientation of an animal's head relative to its environment [1-3]. They are a fundamental component of the wider circuit of spatially responsive hippocampal formation neurons that make up the neural cognitive map of space [4]. During post-natal development, HD cells are the first among spatially modulated neurons in the hippocampal circuit to exhibit mature firing properties [5, 6], but before eye opening, HD cell responses in rat pups have low directional information and are directionally unstable [7, 8]. Using Bayesian decoding of HD cell ensemble activity recorded in the anterodorsal thalamic nucleus (ADN), we characterize this instability and identify its source: under-signaling of angular head velocity, which incompletely shifts the directional signal in proportion to head turns. We find evidence that geometric cues (the corners of a square environment) can be used to mitigate this under-signaling and, thereby, stabilize the directional signal even before eye opening. Crucially, even when directional firing cannot be stabilized, ensembles of unstable HD cells show short-timescale (1-10 s) temporal and spatial couplings consistent with an adult-like HD network. The HD network is widely modeled as a continuous attractor whose output is one coherent activity peak, updated during movement by angular head velocity signals and anchored by landmark cues [9-11]. Our findings present strong evidence for this model, and they demonstrate that the required network circuitry is in place and functional early during development, independent of reference to landmark information.

Keywords: anterodorsal thalamic nucleus; attractor network; development; head direction cells.


Figures

Figure 1
Figure 1
HD Cell Signaling Is Stabilized When Rats Explore a Small (20 cm Side) Environment, from P13 Onward (A) Example firing rate polar plots for 4 HD cells recorded at P13 in the standard (left) and small (right) boxes. Numbers at top left indicate peak firing rate (Hz). (B) HD cells are more numerous (top) and have a higher spatial tuning (Rayleigh vector [RV], middle) and intra-trial stability (bottom) when recorded in a small versus a standard box in animals older than P13. Error bars indicate SEM. See also Figure S1. (C and D) HD cell network internal organization is preserved in the standard box, even when directional signaling is unstable. Colored traces indicate the rat’s actual head direction, overlaid upon spike raster plots for all simultaneously recorded HD cells, in the small (C) and standard (D) boxes. For both (C) and (D), HD cells are ordered vertically by their preferred firing direction in the small box. The sequences of HD cell activation for each head turn direction are similar in the small and standard boxes, but the direction signaled by HD cell firing consistently undershoots actual rotation in the standard box.
Figure 2
Figure 2
Short-Timescale Temporal and Spatial Couplings between HD Cells Are Preserved Even When Directional Signaling Is Unstable (A) Example polar plots (left) and temporal cross-correlograms (TXCs, right) for 3 HD cells recorded in small and standard boxes. (B) TXCs of all co-recorded HD cell pairs in the small (left) and standard (right) boxes, normalized between their minimum (dark blue) and maximum (yellow) values. Each row in the image shows one TXC, and rows are sorted on the basis of preferred firing direction difference in the small box. (C) Correlation between mean values of the central 1 s of TXCs in the small versus standard box. (D) Example polar plots (left) and time-windowed (10 s) spatial cross-correlograms (SXCs, right) for 3 HD cells. (E) SXCs of all co-recorded HD cell pairs in the small (left) and standard (right) boxes. HD pairs are sorted as in (D). (F) Circular-circular correlation between the mean directions of SXCs in the small versus standard box.
Figure 3
Figure 3
HD Attractor Network Organization Is Present at P12, Even before HD Cells Can Be Anchored to Landmarks (A) Polar plots for five example cells recorded in a small box at P12, showing no HD tuning over a 10-min session. (B) Temporal cross-correlograms (TXCs; left) and spatial cross-correlograms (SXCs; right) between cell A and cells B–E. Blue text at top left shows mean of central 1 s of TXC and RV length of SXC, respectively, for each example. (C) Probability distributions of mean of central 1 s of the TXC (left) and RV length of the SXC (right) scores for all P12 co-recorded cell pairs (n = 452). Black arrows with blue letters indicate scores from examples shown in (A) and (B). Orange dashed lines show the values of the fifth and 95th percentiles of scores of known non-HD cells in older animals (see D; only 95th percentile is shown for SXC). Black text refers to percentages of P12 scores above or below these percentiles. (D) Top row: As for (C) but for all co-recorded cell pairs P13–P21. Bottom row: Same data as top row but distributions of HD-HD pairs (light blue) and nonHD-nonHD pairs (orange) are plotted separately. Orange dashed lines shown here and in (C) and (D) (top row) are derived from the fifth and 95th percentiles of the orange (nonHD-nonHD) distributions. See also Figure S2.
Figure 4
Figure 4
HD Drift in Young Rodents Is Caused by Angular Head Velocity Under-Signaling and Is Reduced by Proximity to Corners (A) Example of actual (red) and decoded (gray) head direction (top) and angular head velocity (bottom) values displayed by a P14 rat during 5 min exploration in the standard box. See also Figure S3. (B) Correlation between actual (x axis) and decoded (y axis) angular head velocity scores in the small (left) and standard (right) boxes across all decoded ensembles (n = 6). Slope of relationship between actual and decoded angular head velocity is significantly smaller in the standard versus small box. (C) Mean (±SEM) rate of drift (rate of divergence between actual and decoded head direction) when rats were close or far from the corners of the standard box. (D) Angular head velocity under-signaling is reduced when rats are close to corners. Correlations are shown between actual and decoded angular head velocity scores in the standard box, split by proximity to corners (left, close; right, far). See also Figure S4. (E) Directional tuning and intra-trial stability of HD cells are reduced in a circular environment, as compared to the standard (square) box, on P14–P15. Bar charts show the mean (±SEM) Rayleigh vector (top) or intra-trial stability (bottom) of HD cells recorded in standard and circular environments.

References

    1. Taube J.S., Muller R.U., Ranck J.B., Jr. Head-direction cells recorded from the postsubiculum in freely moving rats. I. Description and quantitative analysis. J. Neurosci. 1990;10:420–435. - PMC - PubMed
    1. Taube J.S. The head direction signal: origins and sensory-motor integration. Annu. Rev. Neurosci. 2007;30:181–207. - PubMed
    1. Finkelstein A., Derdikman D., Rubin A., Foerster J.N., Las L., Ulanovsky N. Three-dimensional head-direction coding in the bat brain. Nature. 2015;517:159–164. - PubMed
    1. O’Keefe J., Nadel L. Oxford University Press; 1978. The Hippocampus as a Cognitive Map.
    1. Wills T.J., Cacucci F., Burgess N., O’Keefe J. Development of the hippocampal cognitive map in preweanling rats. Science. 2010;328:1573–1576. - PMC - PubMed

Publication types

LinkOut - more resources