. 2018 Feb 21;97(4):787-795.e6.
doi: 10.1016/j.neuron.2018.01.017. Epub 2018 Feb 1.

A Subpopulation of Striatal Neurons Mediates Levodopa-Induced Dyskinesia

Affiliations

A Subpopulation of Striatal Neurons Mediates Levodopa-Induced Dyskinesia

Allison E Girasole et al. Neuron. .

Abstract

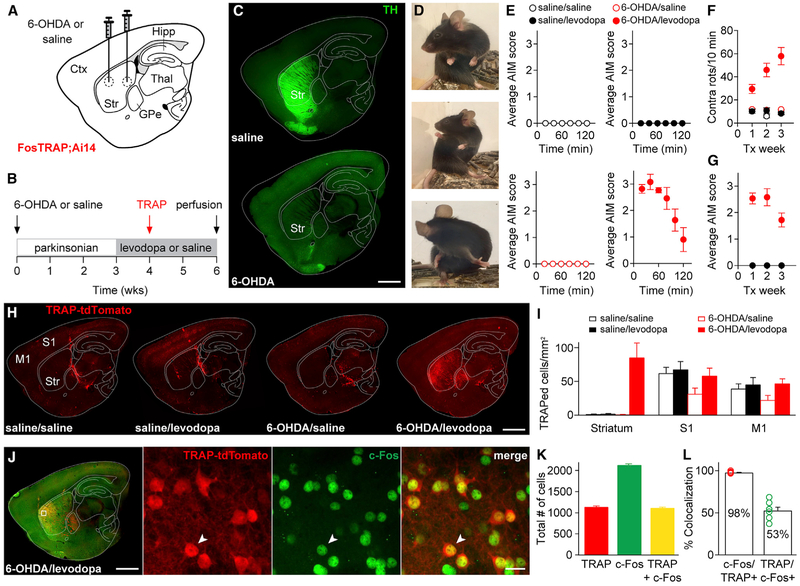
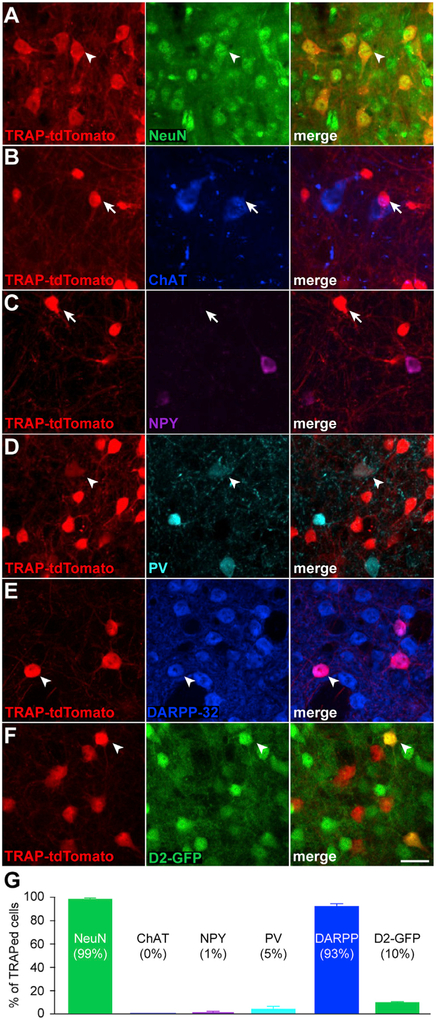
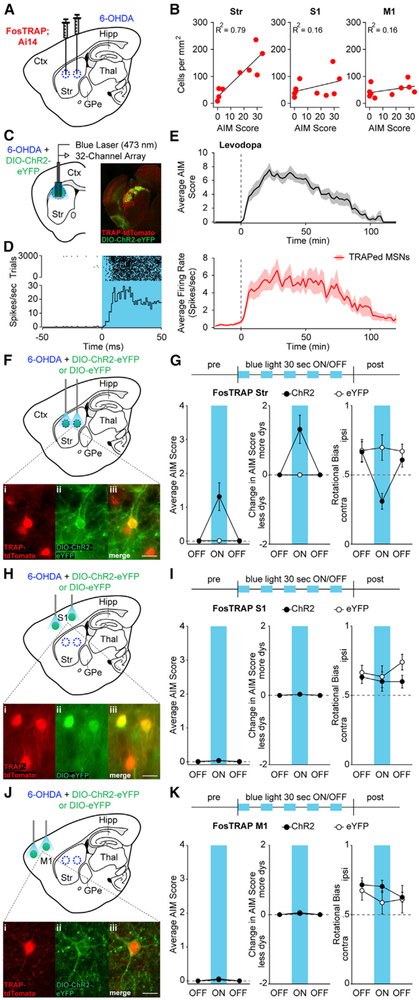
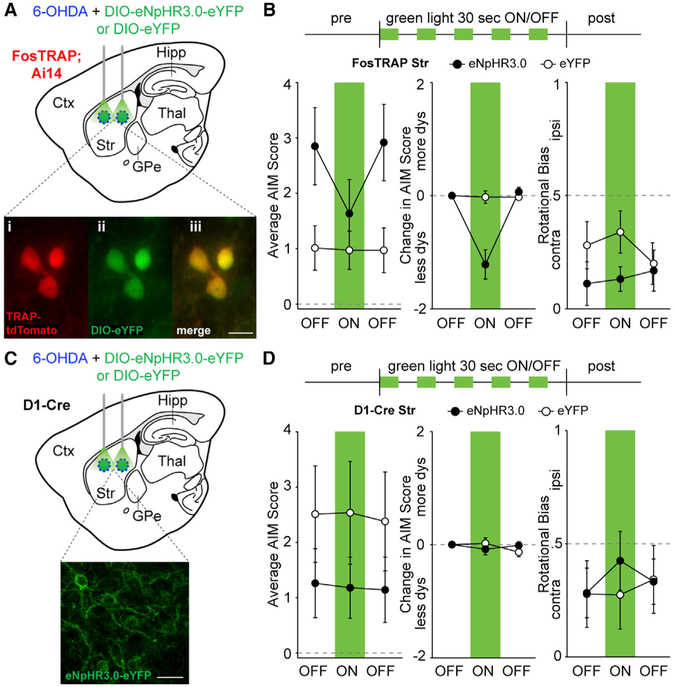
Parkinson's disease is characterized by the progressive loss of midbrain dopamine neurons. Dopamine replacement therapy with levodopa alleviates parkinsonian motor symptoms but is complicated by the development of involuntary movements, termed levodopa-induced dyskinesia (LID). Aberrant activity in the striatum has been hypothesized to cause LID. Here, to establish a direct link between striatal activity and dyskinesia, we combine optogenetics and a method to manipulate dyskinesia-associated neurons, targeted recombination in active populations (TRAP). We find that TRAPed cells are a stable subset of sensorimotor striatal neurons, predominantly from the direct pathway, and that reactivation of TRAPed striatal neurons causes dyskinesia in the absence of levodopa. Inhibition of TRAPed cells, but not a nonspecific subset of direct pathway neurons, ameliorates LID. These results establish that a distinct subset of striatal neurons is causally involved in LID and indicate that successful therapeutic strategies for treating LID may require targeting functionally selective neuronal subtypes.

Keywords: Basal ganglia; Parkinson’s disease; direct pathway; dopamine; levodopa-induced dyskinesia; optogenetics.


Figures

Figure 1.
Figure 1.. FosTRAP Captures Levodopa-Induced Dyskinesia-Associated Striatal Cells
FosTRAP mice were separated into four groups based on intracerebral injections (saline or 6-OHDA) and chronic drug treatment (saline or levodopa). (A) Sagittal schematic showing 6-OHDA or saline injections. (B) Experimental timeline. (C) Sagittal sections from mice injected with saline (top) or 6-OHDA (bottom) stained with anti-tyrosine hydroxylase (TH). (D) Still images showing levodopa-induced dyskinesia in a parkinsonian FosTRAP mouse. (E) Average abnormal involuntary movement (AIM) score measured after levodopa or saline injection in all groups. (F) Contralateral rotations over 3 weeks of treatment. (G) Average composite AIM score over 3 weeks of treatment (note: all four groups are displayed, but three groups showed no AIMS). (H) Representative sagittal sections from the four experimental groups. Increased striatal expression of TRAP-tdTomato was only observed in 6-OHDA/levodopa-treated animals. (I) Density of TRAPed cells measured in the striatum, S1, and M1. (J-L) FosTRAP mice were administered levodopa 2 hr prior to perfusion. TRAPed cells reflect those activated during a levodopa session approximately 2 weeks prior, while c-Fos-positive neurons reflect cells activated during the terminal levodopa session. (J) Left: sagittal section showing TRAP-tdTomato and immunostained for c-Fos. Inset: confocal images showing colocalization (arrowhead) of TRAP-tdTomato (left), c-Fos (middle), and merged image (right). (K) Total number of TRAP-tdTomato, c-Fos, and colocalized cells. (L) Percent colocalization of c-Fos with TRAP-tdTomato (left) and TRAP with c-Fos (right). Scale bar represents 1 mm in (C), (H), and (J) (left) and 20 μm in (J) (inset). Data are displayed as average ± SEM. See also Figure S1.
Figure 2.
Figure 2.. TRAPed Cells Are Primarily Direct Pathway Medium Spiny Neurons
(A-F) Representative 40x confocal images from the striatum of FosTRAP mice treated with 6-OHDA and levodopa, immunostained for different cellular markers. Left columns show TRAP-tdTomato, middle columns show antibody staining for NeuN (A), Choline Acetyltransferase (ChAT, B), Neuropeptide Y (NPY, C), Parvalbumin (PV, D), DARPP-32 (E), D2-GFP (F), and right columns show merged images. White arrowheads denote colocalization, while white arrows show non-colocalized cells. (G) Percent of TRAPed striatal cells positive for each cellular marker. Scale bar represents 20 mm in (A)-(F). Data are displayed as average ± SEM. See also Figure S2.
Figure 3.
Figure 3.. Optogenetic Reactivation of TRAPed Striatal Neurons, but Not TRAPed S1 or M1 Cortical Neurons, Causes Dyskinesia in the Absence of Levodopa
(A) FosTRAP mice were injected intrastriatally with 6-OHDA. (B) Correlation between the density of TRAPed cells and total AIM score. (C) Coronal schematic of optrode recording configuration (left) and representative postmortem section from a dopamine-depleted FosTRAP mouse injected with DIO-ChR2-eYFP (right). (D) Representative optogenetically identified unit, showing short-latency spiking to blue light pulses. Top: rasterized firing during 3,000 trials. Bottom: peristimulus time histogram. (E) Top: average AIM score from sessions in which a TRAPed neuron was identified. Levodopa was administered at time zero (dotted line). Bottom: average firing rate of optogenetically identified TRAPed MSNs in response to levodopa. (F–K) FosTRAP mice were injected with intrastriatal 6-OHDA and DIOChR2-eYFP or DIO-eYFP in either the striatum (Str, F), primary somatosensory cortex (S1, H), or primary motor cortex (M1, J), after which behavioral testing commenced in the absence of levodopa (G, I, and K). (F, H, and J) Sagittal schematics showing sites of injection and light activation. Insets: postmortem histology showing TRAP-tdTomato (i), ChR2-eYFP (ii), and merge (iii) in the striatum, S1, and M1. (G, I, K) Top: optical activation protocol (1 mW) in Str, S1, and M1. Average (left) and change in (middle) AIM scores before, during, and after blue light in FosTRAP-ChR2 or eYFP mice. Right: rotational bias. Scale bar represents 20 μm in (F), (H), and (J). Data are displayed as average ± SEM. See also Figure S3.
Figure 4.
Figure 4.. Optogenetic Inhibition of TRAPed Striatal Neurons, but Not All Direct Pathway Neurons, Ameliorates Levodopa-Induced Dyskinesia
(A–D) FosTRAP (A and B) or D1-Cre mice (C and D) were injected with intrastriatal 6-OHDA and DIO-eNpHR3.0-eYFP or DIO-eYFP. Behavioral testing was performed after the injection of levodopa. (A and C) Sagittal schematics showing sites of injection and light stimulation in FosTRAP (A) and D1-Cre (C) mice. (A) Inset: postmortem histology showing TRAP-tdTomato (i), eYFP (ii), and merge (iii). (B and D). Top: optogenetic inhibition protocol (5 mW). Average (left) and change in (middle) AIM scores before, during, and after striatal green light in eNpHR3.0 or eYFP mice. Right: rotational bias. (C) Inset: postmortem histology showing eNpHR3.0-eYFP positive striatal neurons. Right: rotational bias. Scale bar represents 20 μm in (A) and (C). Data are displayed as average ± SEM. See also Figure S4

Comment in

References

    1. Alam M, Rumpel R, Jin X, von Wrangel C, Tschirner SK, Krauss JK, Grothe C, Ratzka A, and Schwabe K (2017). Altered somatosensory cortex neuronal activity in a rat model of Parkinson’s disease and levodopa-induced dyskinesias. Exp. Neurol 294, 19–31. - PubMed
    1. Alberico SL, Kim YC, Lence T, and Narayanan NS (2017). Axial levodopa-induced dyskinesias and neuronal activity in the dorsal striatum. Neuroscience 343, 240–249. - PMC - PubMed
    1. Alcacer C, Andreoli L, Sebastianutto I, Jakobsson J, Fieblinger T, and Cenci MA (2017). Chemogenetic stimulation of striatal projection neurons modulates responses to Parkinson’s disease therapy. J. Clin. Invest 127, 720–734. - PMC - PubMed
    1. Andersson M, Hilbertson A, and Cenci MA (1999). Striatal fosB expression is causally linked with l-DOPA-induced abnormal involuntary movements and the associated upregulation of striatal prodynorphin mRNA in a rat model of Parkinson’s disease. Neurobiol. Dis 6, 461–474. - PubMed
    1. Bagetta V, Sgobio C, Pendolino V, Del Papa G, Tozzi A, Ghiglieri V, Giampà C, Zianni E, Gardoni F, Calabresi P, and Picconi B (2012). Rebalance of striatal NMDA/AMPA receptor ratio underlies the reduced emergence of dyskinesia during D2-like dopamine agonist treatment in experimental Parkinson’s disease. J. Neurosci 32, 17921–17931. - PMC - PubMed

Publication types

MeSH terms