. 2018 Feb 21;97(4):967-979.e6.
doi: 10.1016/j.neuron.2018.01.012. Epub 2018 Feb 1.

Working Memory Enhances Cortical Representations via Spatially Specific Coordination of Spike Times

Affiliations

Working Memory Enhances Cortical Representations via Spatially Specific Coordination of Spike Times

Zahra Bahmani et al. Neuron. .

Abstract

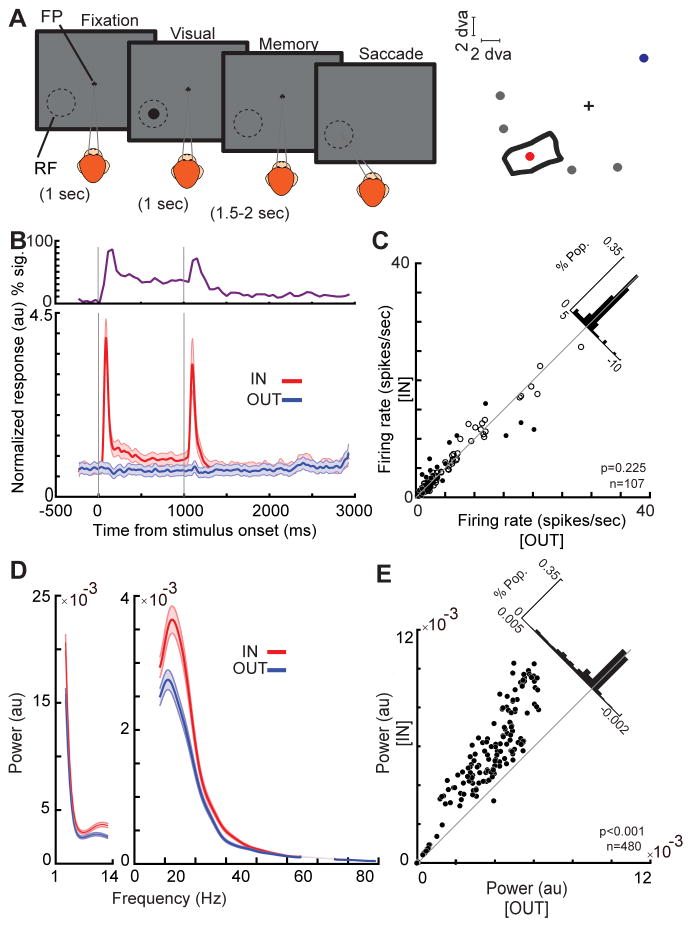
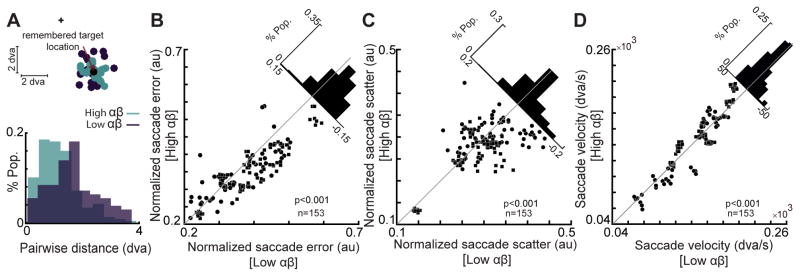
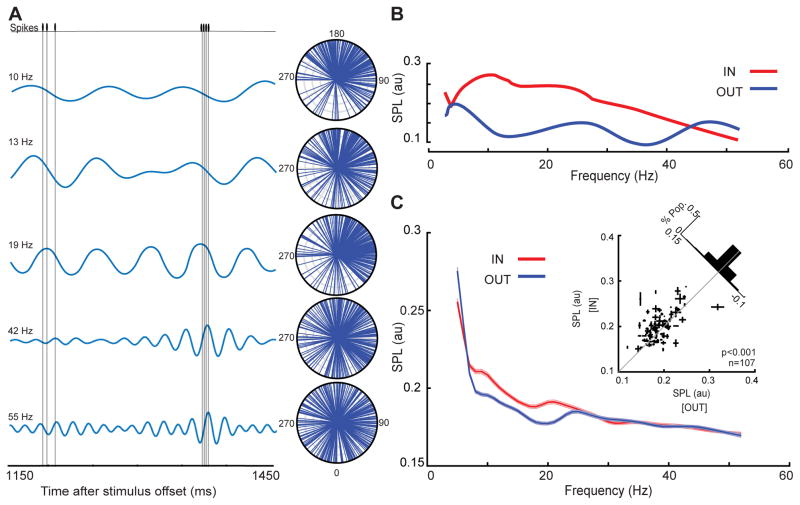
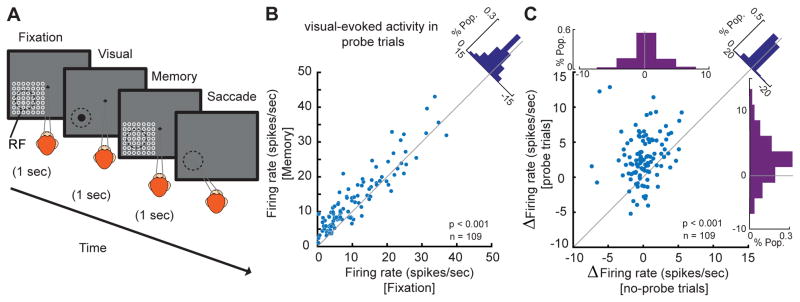
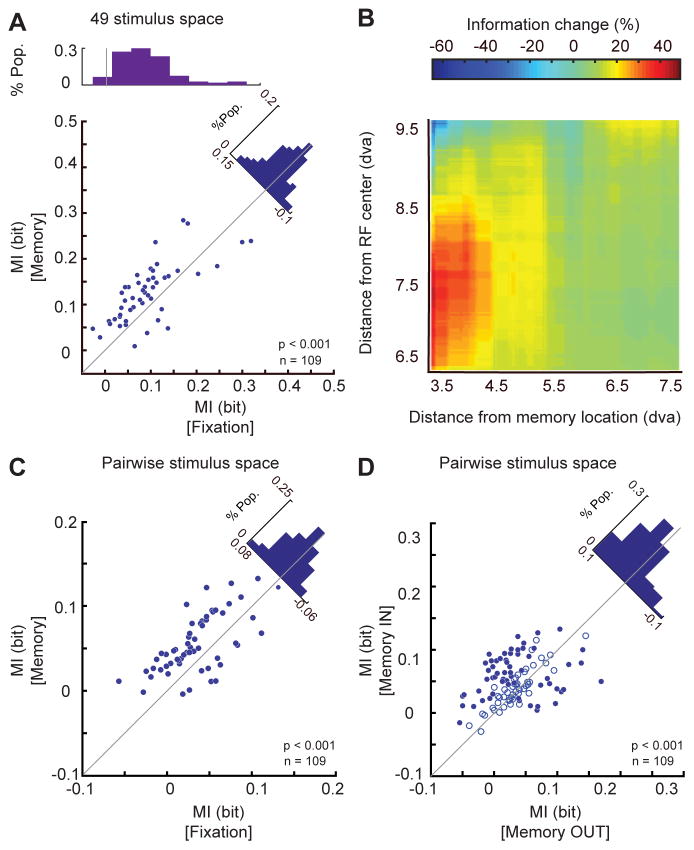
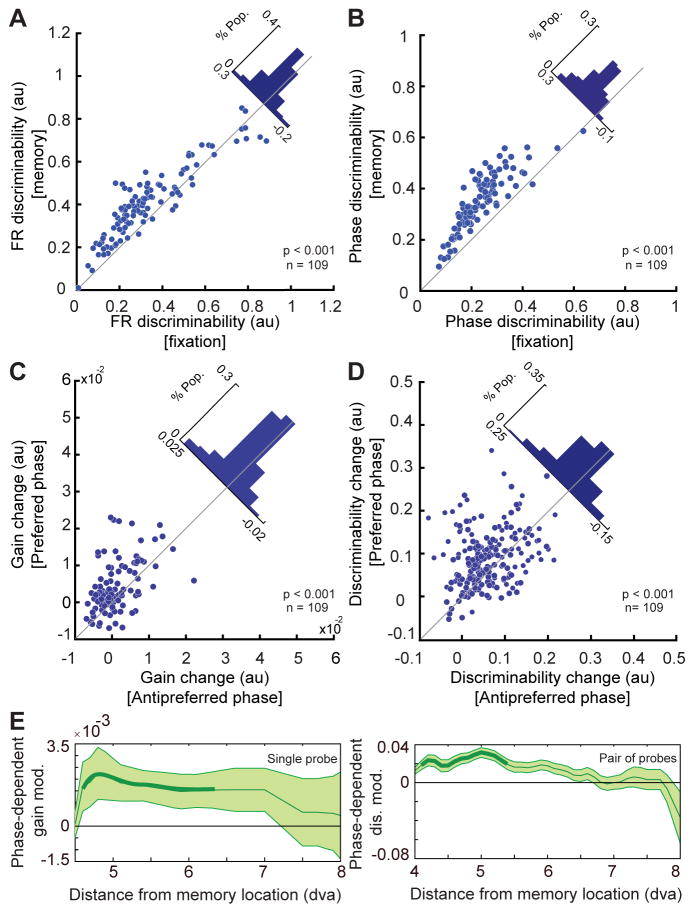
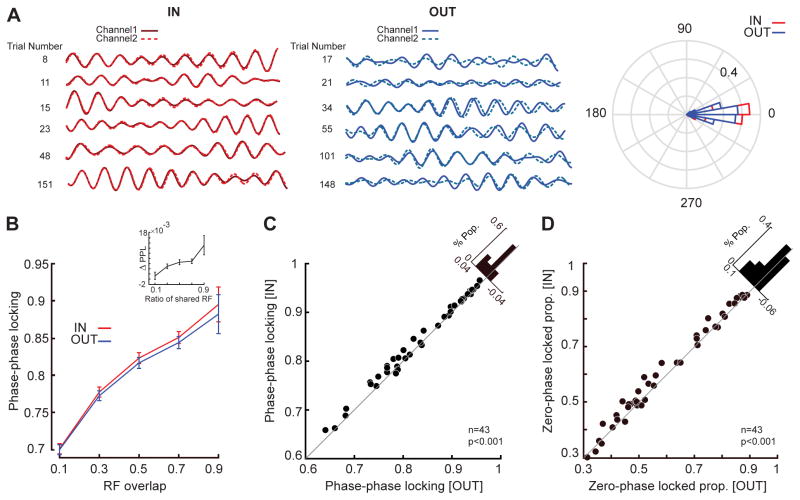
The online maintenance and manipulation of information in working memory (WM) is essential for guiding behavior based on our goals. Understanding how WM alters sensory processing in pursuit of different behavioral objectives is therefore crucial to establish the neural basis of our goal-directed behavior. Here we show that, in the middle temporal (MT) area of rhesus monkeys, the power of the local field potentials in the αβ band (8-25 Hz) increases, reflecting the remembered location and the animal's performance. Moreover, the content of WM determines how coherently MT sites oscillate and how synchronized spikes are relative to these oscillations. These changes in spike timing are not only sufficient to carry sensory and memory information, they can also account for WM-induced sensory enhancement. These results provide a mechanistic-level understanding of how WM alters sensory processing by coordinating the timing of spikes across the neuronal population, enhancing the sensory representation of WM targets.

Keywords: LFP; brain oscillation; phase Modulation; spike-phase locking; visual representation; working memory.


Conflict of interest statement

Declaration of Interests

The authors declare no competing interests.

Figures

Figure 1
Figure 1. WM modulates LFP power in the αβ band
A) Schematic of the MGS task. The monkey fixates on a central fixation point (FP), and a cue stimulus appears in one of six positions arranged around the neuron’s RF location (right). The cue stimulus disappears, and the monkey maintains fixation throughout a blank delay period. Following the disappearance of the fixation point, the monkey saccades to the remembered location to receive a reward. B) The bottom plot shows the normalized firing rate of 107 MT neurons across the course of the MGS task, when the memorized location is inside (IN, red) and outside (OUT, blue) of the neurons’ RFs. Data are smoothed within a window of 30 ms and represented as mean ± SEM. The upper plot shows the proportion of neurons showing a statistically significant increase in firing rate during the memory IN compared to the OUT condition at each point in time measured a bin size of 100 ms with step size of 50 ms. C) The scatter plot of raw firing rates during the last 500 ms of the memory period. Black dots show neurons with statistically significant changes in firing rate and empty circles show neurons with no significant firing rate modulation. The diagonal histogram shows the distribution of firing rate changes. D) The average LFP power spectrum during the memory period across frequencies (n=480 LFP recordings), for memory IN (red) and memory OUT (blue) condition. Shading shows the standard error across recorded LFP signals. E) The scatter plot of αβ power (8–25Hz) during memory IN vs. OUT. Black dots show LFP sites with a significant change in power, empty circles show LFP sites with no significant power modulation. The diagonal histogram shows the distribution of differences in αβ power for all LFPs. See also Figure S1.
Figure 2
Figure 2. Memory period αβ power correlates with behavioral performance
A) The αβ power of a sample LFP signal during the memory period is predictive of the monkey’s behavior. (Top) Saccade landing points for high αβ power trials and low αβ power trials are shown in light and dark colors, respectively; the cross is the fixation point and the black circle is the remembered target location. The distance between saccadic landing points and the remembered target location (saccade error) is smaller for high αβ power trials compared to low αβ power trials in this session. The histogram shows the distributions of pairwise distances between saccadic landing points (saccade scatter) for high (green) and low (purple) αβ power trials in this session. B–D) A comparison of saccade scatter, error and velocity for high αβ power trials vs. low αβ power trials, across all memory-selective LFP signals (n=169). Scatter plots show the mean saccade scatter, error, and velocity values for high vs. low αβ power trials for each memory-selective LFP signal. Diagonal histograms show the distribution of differences between conditions for each performance measure. The data from m1 is represented by rectangles and circles indicate the data from m2. See also Figure S2.
Figure 3
Figure 3. Spike-phase locking (SPL) in the αβ band increases when remembering a location in the MT RF
A) The LFP and spiking data of a sample neuron-LFP pair, over 300 ms of the delay period of a memory IN trial. Under the spike train are the simultaneously recorded filtered LFP signals centered at 5 different frequencies (10, 13, 19, 42 and 55 Hz; bandwidth ±2 Hz). The polar plots show the phases of the ongoing filtered signal at the time when spikes occurred (each plotted as a vector with a constant amplitude), over all trials for this sample pair. B) The magnitude of the vector average across all spikes is the spike-phase locking magnitude (SPL) for that frequency. The plot shows the SPL for the sample pair across all frequencies, for a memory location inside the MT RF (red) and outside the MT RF (blue). C) The SPL for memory IN (red) and memory OUT (blue), across frequencies for all pairs of neurons and simultaneously recorded LFPs (n=1605 neuron-LFP pairs). The SPL is measured using a frequency bandwidth of 4 Hz and step of 1Hz, and is smoothed with a window of 2Hz. Data are represented as mean ± SEM. Inset scatter plot shows the SPL at αβ for memory IN compared to memory OUT, with the SPL values for multiple simultaneously recorded LFPs averaged for each neuron (n=107 neurons). Error bars on each point indicate standard error of the SPL values for that neuron across multiple simultaneously recorded LFPs. For illustration purposes, one outlier data point is excluded from the scatter plot but not from the analysis. See also Figure S4.
Figure 4
Figure 4. WM modulates the firing rate of neurons in the presence of visual stimuli
A) The animal performed an MGS task in which visual probes appeared during the 1s fixation period and the 1s delay period. The probe (white circle) was a brief (200 ms) small (~ 1dva) visual stimulus presented in a 7×7 grid of possible locations (open white circles, shown here for illustration only and not present on the screen). On each trial, four probes were presented in succession during both the fixation and memory periods, with an inter-probe interval of 200 ms. This 7×7 grid of probes was positioned to overlap with the RF of the recorded neuron based on the preliminary RF mapping. The location of the remembered target could vary with respect to the RF of recorded neurons. On ~9% of trials, no probes were presented. B) Visually evoked firing rates increased during the memory period. The scatter plot shows visually evoked spiking activity for the optimal probe of each neuron in the memory period vs. fixation. The diagonal histogram shows the distribution of changes in the visually evoked spiking activity between memory and fixation across 109 neurons. Two outlier neurons (>70 spikes/s) are excluded from the scatter plot but not from the analysis. C) During the memory period, visually evoked activity increased but delay activity in the absence of probes was unchanged. Scatter plot of WM-induced changes in the visually evoked spiking activity (using probe trials) against WM-induced changes in the delay period activity (using no-probe trials). Top histogram indicates the WM-induced change in delay period activity represented by the distribution of firing rate change during memory vs. fixation; right histogram indicates the WM-induced change in visually evoked activity and is similar to the diagonal histogram in Figure 4B. Diagonal histogram illustrates the difference between the effects of WM on firing rates in the presence and absence of visual probes. For illustration purposes, one outlier data point is excluded from the scatter plot but not from the analysis.
Figure 5
Figure 5. WM increased the information about incoming visual stimuli conveyed via the αβ-phase at spike times
A) Across 109 MT neurons, the mutual information between the 49 different probe stimuli and the phases of ongoing αβ oscillation at the time of spikes showed a significant increase during memory IN compared to fixation. Scatter plot shows the MI for each MT neuron during fixation (x-axis) and during memory (y-axis). Fill indicates significance of changes in individual neurons (filled blue, p<0.05; open, p>0.05). Top histogram shows the distribution of MI values during fixation; diagonal histogram shows the distribution of differences in MI between memory and fixation. B) The increase in mutual information during the memory period depends on the distance between the probes and the RF center or memory location. Color scale shows the change in mutual information (memory – fixation) between the spikes’ phases (αβ) and probe location for pairs of probes. The change is plotted as a function of the probes’ distance from the RF center (y-axis) and distance from the memory location (x-axis). The geometric mean of the two probe positions was used to calculate distances. C&D) Change in mutual information for probe pairs < 8.5 dva from the RF center and < 4.5 dva from the memorized location. The scatter plot illustrates the average pairwise mutual information (between pairs of probe locations and αβ phase at the time of spikes) for the memory IN condition vs. fixation (C) or memory OUT (D) for individual neurons. Blue dots indicate neurons showing a statistically significant MI change, and empty circles indicate non-significant ones. Diagonal histogram shows the distribution of differences in MI between memory IN vs. fixation (C) or vs. memory OUT (D). See also Figure S5.
Figure 6
Figure 6. WM produces αβ-phase dependent enhancement of the visual signal
A) Discriminability for the location of a visual probe based on the spike count is enhanced during memory IN compared to fixation. The scatter plot shows the average ability of individual MT neurons to discriminate probe locations solely based on their firing rate during memory and fixation periods. The diagonal histogram shows the difference in firing rate discriminability between memory and fixation. B) Discriminability for the location of a visual probe based on the αβ phases at spike times is also enhanced during memory compared to fixation. The scatter plot shows the average ability of individual MT neurons to discriminate probe locations solely based on the timing of their spikes (i.e. the phase of αβ oscillation at which each spike occurs) during memory and fixation periods. The histogram shows the difference in phase discriminability between memory and fixation. C) The WM-induced change in gain (memory – fixation) is greater during the preferred αβ phase than the anti-preferred phase across 109 MT neurons. The scatter plot shows the change in gain at the preferred phase (y-axis) and anti-preferred phase (x-axis) for each neuron. The histogram shows the distribution of differences between the change in gain for preferred vs. anti-preferred αβ phase. D) The WM-induced change in discriminability (memory – fixation) is greater during the preferred αβ phase than the anti-preferred phase across 109 MT neurons. The scatter plot shows the change in discriminability at the preferred phase (y-axis) and anti-preferred phase (x-axis) for each neuron. The histogram shows the distribution of differences between the discriminability change for the preferred vs. anti-preferred phase. E) The phase dependence of the change in gain and discriminability is strongest for locations near the locus of WM. Plots show the mean value of the phase-dependent gain and discriminability modulations as a function of visual probe distance from the location held in WM. Thick lines indicate distance bins whose mean is significantly different from zero. Shading indicates standard error for data in each bin. See also Figure S6.
Figure 7
Figure 7. Maintenance of spatial information alters the correlated activity of LFP pairs based on the overlap between receptive fields
A) Filtered LFP signals (αβ range, center frequency 10 Hz, bandwidth±2 Hz) for a sample pair of channels (solid and dashed lines) with similar RFs, for 5 memory IN trials (left, red) and 5 memory OUT trials (right, blue). The polar plot demonstrates the histogram of phase differences between the two LFPs across all trials for memory IN (red) and memory OUT (blue). B) The amplitude of the phase-phase locking (PPL) is plotted as a function of RF overlap for memory IN (red) and memory OUT (blue), with PPL increasing with greater RF overlap. The inset shows the relationship between PPL differences (PPL IN - OUT) as a function of the shared RF ratio. Error bars indicate standard error across LFP pairs in each range of RF overlap. C) The PPL between αβ oscillations on channels with similar RFs was greater when the memory location was inside the MT RF. The scatter plot shows αβ PPL for 43 pairs of LFP recordings during memory IN and OUT conditions. The diagonal histogram shows the distribution of change in PPL (IN – OUT) across LFP pairs. D) The proportions of phase-phase locked trials with zero phase lag was greater when the memory location was inside the MT RF. The scatter plot shows αβ ZPL for 43 pairs of LFP recordings during memory IN and OUT conditions. The histogram shows the distribution of change in ZPL (IN – OUT) across LFP pairs. See also Figures S1 & S3 & S4 & S7.

References

    1. Anderson JC, Kennedy H, Martin KAC. Pathways of attention: synaptic relationships of frontal eye field to V4, lateral intraparietal cortex, and area 46 in macaque monkey. J Neurosci. 2011;31:10872–10881. - PMC - PubMed
    1. Asaad WF, Santhanam N, McClellan S, Freedman DJ. High-performance execution of psychophysical tasks with complex visual stimuli in MATLAB. J Neurophysiol. 2013;109:249–260. - PMC - PubMed
    1. Awh E, Jonides J. Overlapping mechanisms of attention and spatial working memory. Trends Cogn Sci. 2001;5:119–126. - PubMed
    1. Awh E, Jonides J, Reuter-Lorenz PA. Rehearsal in Spatial Working Memory. J Exp Psychol Hum Percept Perform. 1998;24:780–790. - PubMed
    1. Bastos AM, Vezoli J, Bosman CA, Schoffelen JM, Oostenveld R, Dowdall JR, De Weerd P, Kennedy H, Fries P. Visual Areas Exert Feedforward and Feedback Influences through Distinct Frequency Channels. Neuron. 2015a;85:390–401. - PubMed

Publication types

LinkOut - more resources