. 2018 Feb 21;97(4):885-897.e6.
doi: 10.1016/j.neuron.2018.01.019. Epub 2018 Feb 1.

Small Networks Encode Decision-Making in Primary Auditory Cortex

Affiliations

Small Networks Encode Decision-Making in Primary Auditory Cortex

Nikolas A Francis et al. Neuron. .

Abstract

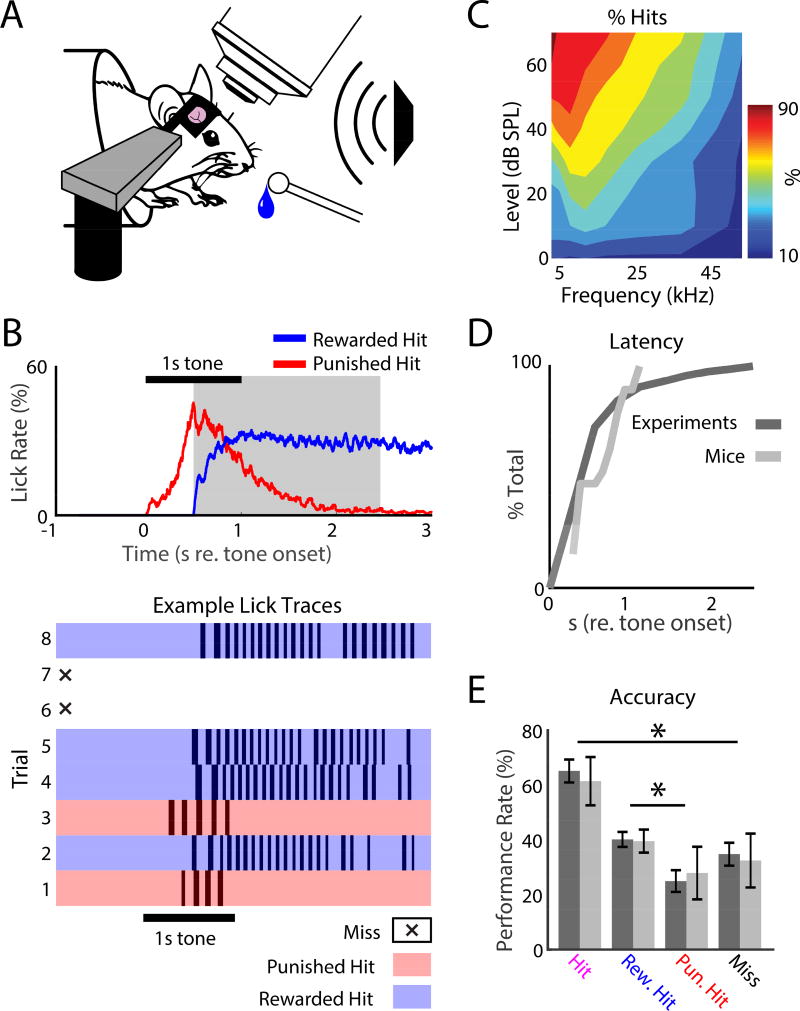
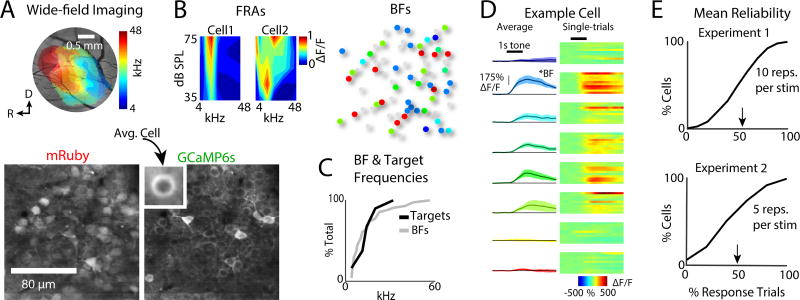
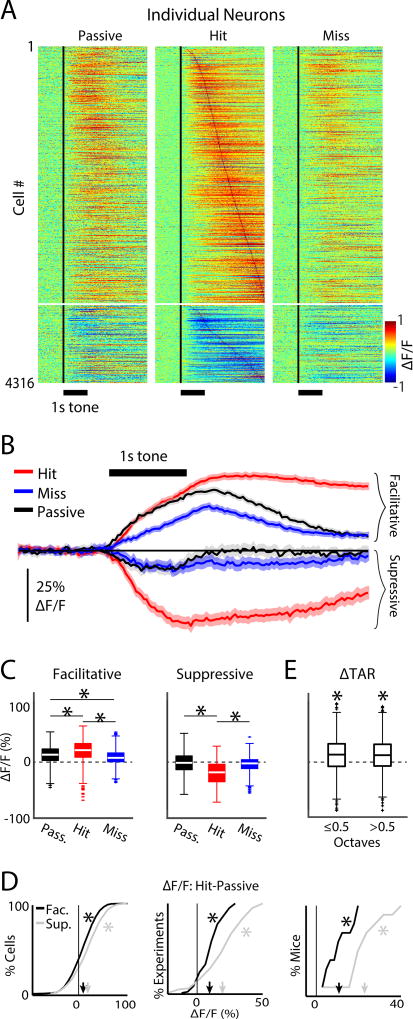
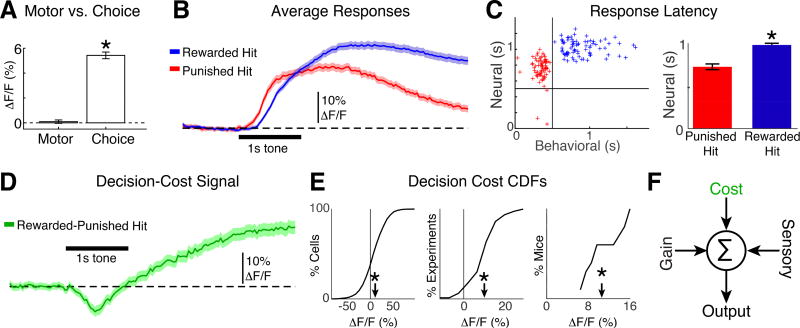
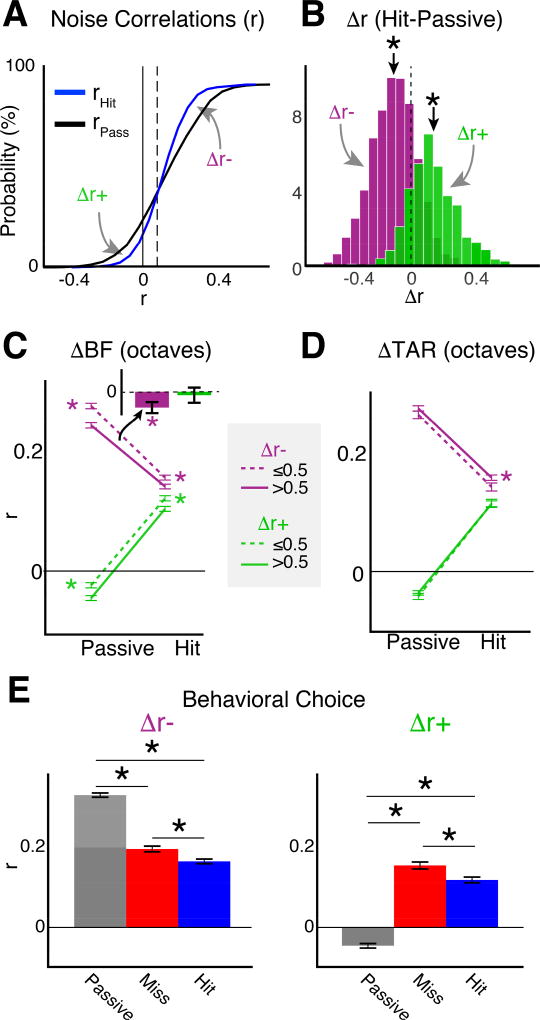
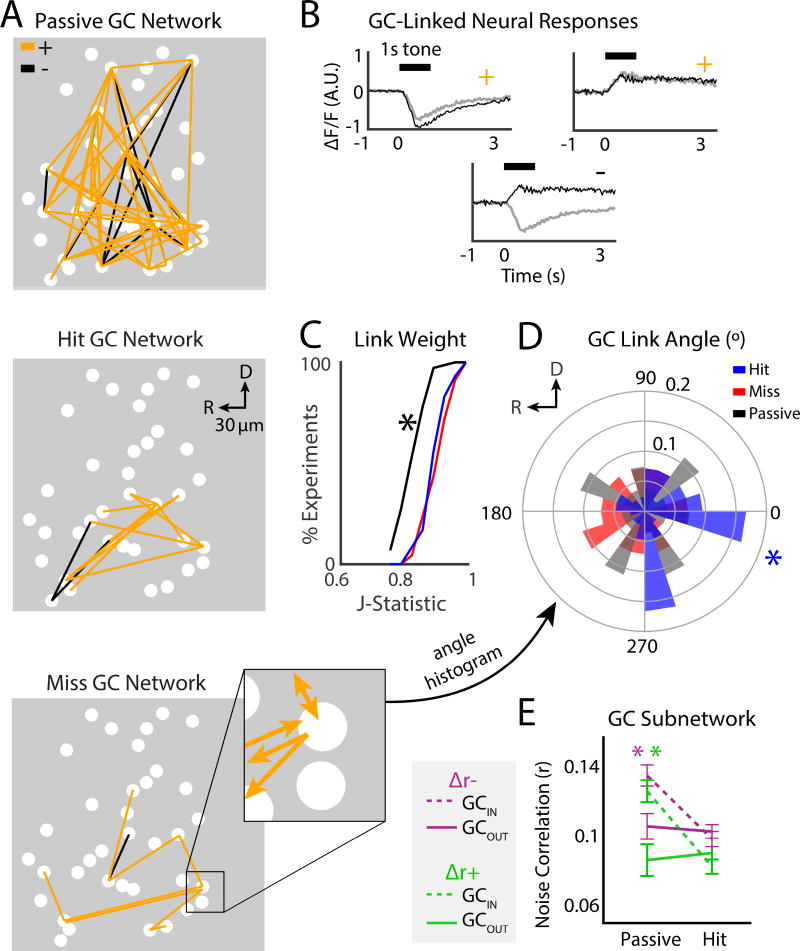
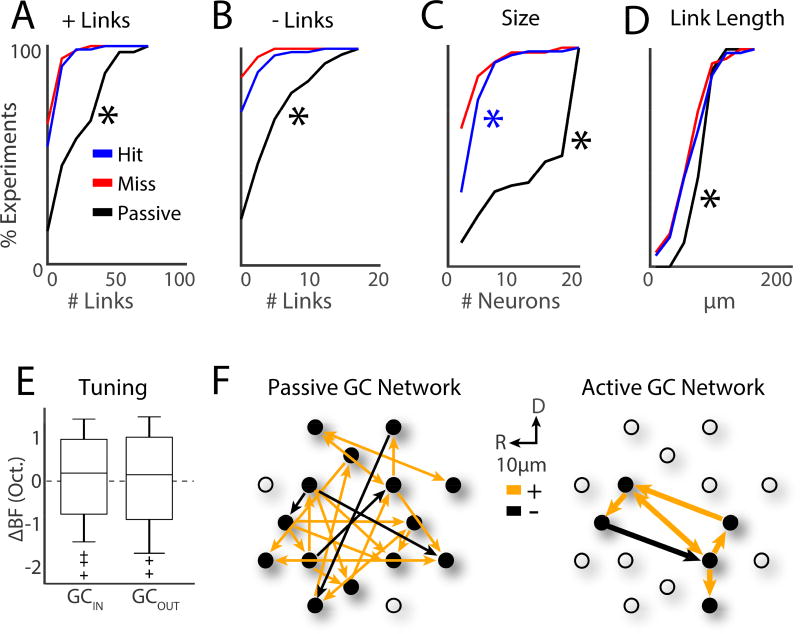
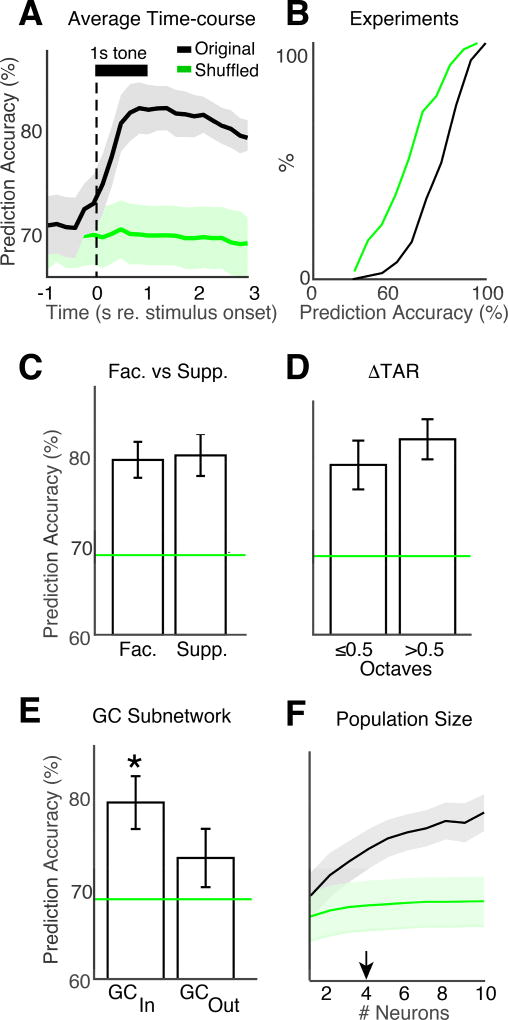
Sensory detection tasks enhance representations of behaviorally meaningful stimuli in primary auditory cortex (A1). However, it remains unclear how A1 encodes decision-making. Neurons in A1 layer 2/3 (L2/3) show heterogeneous stimulus selectivity and complex anatomical connectivity, and receive input from prefrontal cortex. Thus, task-related modulation of activity in A1 L2/3 might differ across subpopulations. To study the neural coding of decision-making, we used two-photon imaging in A1 L2/3 of mice performing a tone-detection task. Neural responses to targets showed attentional gain and encoded behavioral choice. To characterize network representation of behavioral choice, we analyzed functional connectivity using Granger causality, pairwise noise correlations, and neural decoding. During task performance, small groups of four to five neurons became sparsely linked, locally clustered, and rostro-caudally oriented, while noise correlations both increased and decreased. Our results suggest that sensory-based decision-making involves small neural networks driven by the sum of sensory input, attentional gain, and behavioral choice.

Keywords: 2-photon; Granger; attention; auditory; behavior; cortex; decision-making; decoding; imaging; mouse.


Conflict of interest statement

DECLARATION OF INTERESTS

The authors declare no competing interests.

Figures

Figure 1
Figure 1
2-Photon (2P) imaging in awake behaving mice. A. Head-fixed mice were trained to detect a 55 dB SPL, 1 s pure-tone presented from a free-field speaker, while neurons in A1 were imaged. Mice responded to tone detection by licking a waterspout. B. Tone detection behavior. Top: Average lick rate during task performance. Horizontal black bar shows when the target tone was presented. Red trace shows the average lick rate for punished hits, i.e., when the first lick occurred before the reward time-window (gray shaded region). No water was delivered after the first lick during punished hits, so the mice stopped licking. The blue trace shows the lick rate for rewarded hits indicating robust licking after receiving water. Bottom: example lick traces for 8 sequential trials during task performance. White regions with an X show miss trials, when the mouse did not respond. Blue and red regions show rewarded and punished hit trials respectively. C. Head-fixed task performance for roved tone levels to find the level (55 dB SPL) that produced a ~60–70% hit rate in the target frequency range (4–32 kHz). D. Cumulative distribution function (CDFs) for response latency (dark: total set of experiments; light: mice). E. Performance rates for each behavioral response-type for experiments (dark) and animals (light), respectively. Error bars show 2 standard errors of the mean (SEMs). Total hit rate: 65.2% ± 18.8% and 61.5% ± 13.9%, across experiments and animals, respectively. Rewarded hit rate: 40.2% ± 12.2% and 39.6% ± 6.7% across experiments and animals, respectively. Punished hit rate: 25% ± 17.7% and 28% ± 15.2% across experiments and animals, respectively. Miss rates: 35% ± 18.8% and 32.5% ± 15.5% across experiments and animals, respectively. Stars indicate significant differences between pairs of groups indicated by the bars: hits vs. misses (bootstrap t-test, experiments: p<0.001; animals: p=0.0011) and punished hits vs. rewarded hits (bootstrap t-test, experiments: p<0.001; animals: p=0.04).
Figure 2
Figure 2
Tone-evoked neuronal responses imaged in primary auditory cortex (A1) layer 2/3 show pure-tone frequency selectivity. A. Top left: Wide-field imaging used to localize A1, as indicated by a rostro-caudal gradient of high to low frequencies in the 4–48 kHz range (Fig. S1). Bottom: mRuby labeled cell bodies and GCaMP6s labeled cell membranes. B. Left: Two examples of frequency response areas (FRAs) generated by measuring responses to pure-tones presented at 35–75 dB SPL. Cells could show a narrow V-shape FRAs monotonic with level or show a wider FRA non-monotonic with level. Right: Best frequency (BF) of each cell for tones presented at 55 dB SPL. Gray cells were either too dim (see Fig. S3) or did not respond to pure-tones during passive trials. Color-coding same as A. C. CDFs of the set of pure-tone targets for each experiment (N=80 experiments), and BFs from all neurons (N=4316). D. Exemplar fluorescence traces from an A1 neuron in response to tones of different frequencies. Left column shows average of 10 repetitions of each frequency. Each row shows the data for a single tone frequency. Right column shows a heat-map for individual trial responses to each tone. E. Exemplar mean response reliability distributions from two experiments. Arrowheads indicate the mean. Response reliability was defined as the fraction of trials with significant responses in each cell, for the set of tones presented during Passive trials (Bandyopadhyay et al., 2010, Rothschild et al., 2010, Kanold et al., 2014, Maor et al., 2016, Winkowski et al., 2013). Reliability was similar for blocks of 5 or 10 trials per frequency.
Figure 3
Figure 3
Tone-evoked activity in A1 is modulated by behavioral choice. A. Heat-map of individual neuronal responses. Each row shows a neuron’s average response across repetitions of the same pure-tone frequency during passive (left), hit (middle) miss (right) trials. Facilitative and suppressive responses are shown as positive (warm colors) and negative (cool colors) values, respectively. The vertical black line shows the tone onset time. Neurons in all three panels were sorted by peak response latency during hit trials. B. Population average response time-courses for both facilitative and suppressive hit trials (red), miss trials (blue), and passive trials (black). Shading shows 2 SEMs. C. Box plots for the distribution of population responses, after collapsing the time-course for each cell into an average value across time after the tone onset. Conditions are color coded as in B. ‘*’ indicate p<0.001, KW-test. The average facilitative ΔF/F response for passive, hit and miss trials were 14.8% ± 0.62%, 24% ± 0.71%, and 10% ± 0.5%, respectively. The average suppressive ΔF/F response for passive, hit and miss trials were −2.9% ± 1.4%, −22.1% ± 1.4%, and −5.4% ± 1.04%, respectively. D. CDFs for attentional gain, measured as the differences in ΔF/F between hit and passive conditions. CDFs were computed by taking the cumulative sum of the histogram of attentional gain values separately across each population of experiments and mice. Left, middle and right panels show the CDFs for the total population of cells, experiments, and mice, respectively. CDFs for facilitative and suppressive responses in black and gray, respectively. The mean attentional gain for facilitative responses was 9.9% ± 0.93%, 9.9% ± 2.0%, and 9.9% ± 3.7%, across cells, experiments, and mice, respectively. The mean attentional gain for suppressive responses was 19.9% ± 2%, 20.7% ± 3.5%, and 23.8% ± 5.0%, across cells, experiments, and mice, respectively. Arrowheads indicate mean values. ‘*’ indicate a significant difference from 0 (bootstrap t-test, p<0.001). The magnitude of attentional gain in suppressive responses across individual cells, experiments, and mice was significantly greater than the attentional gain for enhanced responses (bootstrap t-test, p<0.001). E. Attentional gain for groups of cells according to their BF octave difference. Attentional gain was positive for both groups (ΔTAR≤0.5: 12.8% ± 0.6%; ΔTAR>0.5: 11.4% ± 0.6%, bootstrap t-test, p<0.001) but similar (bootstrap t-test, p=0.11).
Figure 4
Figure 4
Neurons in A1 encode decision timing and cost. A. Left: Time averaged activity aligned to licks during the silent period is similar to 0 (bootstrap t-test, p=0.5). Right: The time-averaged difference in activity of lick-aligned hit-miss trials (i.e., attentional gain, or “choice”) is positive (bootstrap t-test, p<0.001). B. Population average time-course of neural responses to tones during rewarded (blue) and punished (red) hits. Mice were trained to withhold licking for 0.5 s after the tone onset. Shading indicates 2 SEMs. C. Left: Average behavioral vs. neural response latencies for each experiment. Vertical and horizontal lines mark 0.5 s wait period. Right: Average neural response latency for punished and rewarded hits. ‘*” indicates p<0.001 (bootstrap t-test). Error bars show 2 SEMs. D. The time-course of the difference trace from panel B shows the dynamics of decision-cost (green; rewarded hit – punished hit). E. CDFs for decision-cost signaling for all cells (left), experiments (middle) and mice (right). Arrowheads indicate the means (9.5% +/− 0.78%, 9.1% +/− 1.7%, and 10.2% +/− 3.1% ΔF/F). ‘*’ indicate means different than 0 (bootstrap t-test, p<0.001). F. Model of A1 activity that is modulated by attentional gain, the cost of behavioral choice and sensory input.
Figure 5
Figure 5
Auditory attention modulates pairwise noise correlations in A1 L2/3. A. CDF of average pairwise neuronal noise correlations (r) for each neuron in the study (N=4316) during passive (black) and hit (blue) trials. The vertical dotted line shows the inflection point (r=0.09) where the sign of rHIT-rPASSIVE (i.e., Δr) reverses. Δr values indicated by the gray arrows pointing below (Δr+) and above (Δr−) the inflection point were separated for subsequent panels. B. Probability density functions (PDFs) for Δr+ and Δr−. ‘*’ indicate means different than 0 (bootstrap t-test, p<0.001). C. r values for cells grouped by the octave distance between best frequencies (ΔBF). The mean values for Δr+ for hit vs passive were ΔBF≤0.5: 0.12 ± 0.007 vs. −0.02 ± 0.007; ΔBF>0.5: 0.1 ± 0.007 vs. −0.05 ± 0.007. The mean values for Δr− for hit vs passive were ΔBF≤0.5: 0.16 ± 0.005 vs. 0.27 ± 0.006; ΔBF>0.5: 0.14 ± 0.005 vs. 0.24 ± 0.006. ‘*’ indicate differences between BF groups in Δr−group for both active and passive (bootstrap t-test, p<0.001). Error bars show 2 SEMs. Inset shows differences in Δr between BF groups (Δr (ΔBF≤0.5) - Δr (ΔBF>0.5)) and indicate that for Δr−cells with ΔBF<0.5 showed the largest reduction in r. D. Noise correlations as function of BF relative to the target frequency (ΔTAR). The average noise correlations for Δr− in hit vs passive trials were: ΔTAR≤0.5: 0.14 ± 0.008 vs. 0.26 ± 0.008; ΔTAR>0.5: 0.15 ± 0.006 vs. 0.27 ± 0.006. The average noise correlations for Δr+ in hit vs passive trials were: ΔTAR≤0.5: 0.11 ± 0.01 vs. −0.04 ± 0.009; ΔTAR>0.5: 0.11 ± 0.008 vs. −0.04 ± 0.006. E. Attentional effect on noise correlations across all neurons. ‘*’ indicate p<0.001, KW-test.
Figure 6
Figure 6
Granger causality (GC) subnetwork structure was modulated by task performance. A. GC analysis was used to find directional links (i.e., effective connections) between neurons. Example GC networks during passive (top), hit (middle), and miss (bottom) trials. Positive (+) and Negative (−) links are shown in orange and black, respectively. Magnification shows example of directionality for individual GC-links. B. Example traces of pairs of + or − GC-linked neurons. C. CDF of GC link weight. ‘*’ indicates difference between the passive and hit trials (bootstrap t-test, p<0.001). Trends were similar across mice (see Supp Table 1). D. GC link angle. ‘*’ indicates the significant rostro-caudal directionality of links during hit trials (Rayleigh test, p=0.03). E. Pairwise noise correlations for cells inside a GC subnetwork (GCIN) and cells outside of a subnetwork (GCOUT). Average Δr− noise correlations for GCIN cells for hit vs. passive trials: 0.098 ± 0.006 vs. 0.135 ± 0.008. Average Δr− noise correlations for GCOUT cells: 0.103 ± 0.005 vs. 0.11 ± 0.011. GC Average Δr+ noise correlations for GCIN cells for hit vs. passive trials: 0.08 ± 0.007 vs. 0.13 ± 0.01. Average Δr+ noise correlations for GCOUT cells for hit vs. passive trials: 0.09 ± 0.006 vs. 0.09 ± 0.02. For both Δr− and Δr+ groups, GCIN cells had larger noise correlations during passive trials compared to GCOUT cells, and significantly decreased noise correlations during hit trials (green and purple ‘*’ bootstrap t-test, p<0.001). Noise correlations in GCOUT cells were similar for hit and passive trials (bootstrap t-test, Δr−: p=0.62, Δr+: p=0.66).
Figure 7
Figure 7
Tone detection drives GC subnetworks into small and localized clusters of 4–5 neurons with diverse frequency tuning. A. CDF for number of +links. ‘*’ indicates differences between passive and hit trials (bootstrap t-test, p<0.001). B. CDF for number of −links. C. CDF for GC subnetwork size. Blue ‘*’ indicates a significant difference between the hit and miss trials (bootstrap t-test, p=0.019). D. CDF for GC link length. E. BF differences (ΔBF) between pairs of cells for GCIN and GCOUT cells. Populations were similarly distributed, and means similar to 0 (bootstrap t-test, p>0.05). F. Illustration of passive and active (i.e., hit) GC networks.
Figure 8
Figure 8
GC subnetworks have enhanced encoding of behavioral choice. A. Prediction accuracy (PA) of decoded neural activity plotted as a function of time. The black curve shows the PA averaged across experiments. The green line shows the PA for shuffled data. Shading shows 2 SEMs. B. PA CDF is shown for all 80 experiments. C. Both facilitative and suppressive cells (see Fig. 3A, B) had PA greater than chance (bootstrap t-test, p<0.001), but were not different (bootstrap t-test, p=0.74). D. Cells with BF near and far from the target frequency had PA greater than chance (bootstrap t-test, p<0.001), but were not different (bootstrap t-test, p=0.1). E. GC subnetwork membership enhances PA. Both GCIN and GCOUT cells had PA greater than chance (bootstrap t-test, GCIN: p<0.001, GCOUT: p=0.008). ’*’ indicates that PA of GCIN cells was larger than GCOUT cells (bootstrap t-test, p=0.012). F. PA during each experiment was tested against the number of neurons used for prediction. Arrowhead: 4 neurons are sufficient to predict behavior above chance.

References

    1. Atencio CA, Schreiner CE. Columnar Connectivity and Laminar Processing in Cat Primary Auditory Cortex. Plos One. 2010;5 - PMC - PubMed
    1. Atiani S, David SV, Elgueda D, Locastro M, Radtke-Schuller S, Shamma SA, Fritz JB. Emergent selectivity for task-relevant stimuli in higher-order auditory cortex. Neuron. 2014;82:486–99. - PMC - PubMed
    1. Atiani S, Elhilali M, David SV, Fritz JB, Shamma SA. Task difficulty and performance induce diverse adaptive patterns in gain and shape of primary auditory cortical receptive fields. Neuron. 2009;61:467–80. - PMC - PubMed
    1. Atzori M, Lei S, Evans DIP, Kanold PO, Phillips-Tansey E, Mcintyre O, Mcbain CJ. Differential synaptic processing separates stationary from transient inputs to the auditory cortex. Nature Neuroscience. 2001;4:1230–1237. - PubMed
    1. Averbeck BB, Latham PE, Pouget A. Neural correlations, population coding and computation. Nature Reviews Neuroscience. 2006;7:358–366. - PubMed

Publication types

LinkOut - more resources