. 2018 Feb 21;97(4):869-884.e5.
doi: 10.1016/j.neuron.2018.01.023. Epub 2018 Feb 1.

Graded Arrays of Spinal and Supraspinal V2a Interneuron Subtypes Underlie Forelimb and Hindlimb Motor Control

Affiliations

Graded Arrays of Spinal and Supraspinal V2a Interneuron Subtypes Underlie Forelimb and Hindlimb Motor Control

Marito Hayashi et al. Neuron. .

Abstract

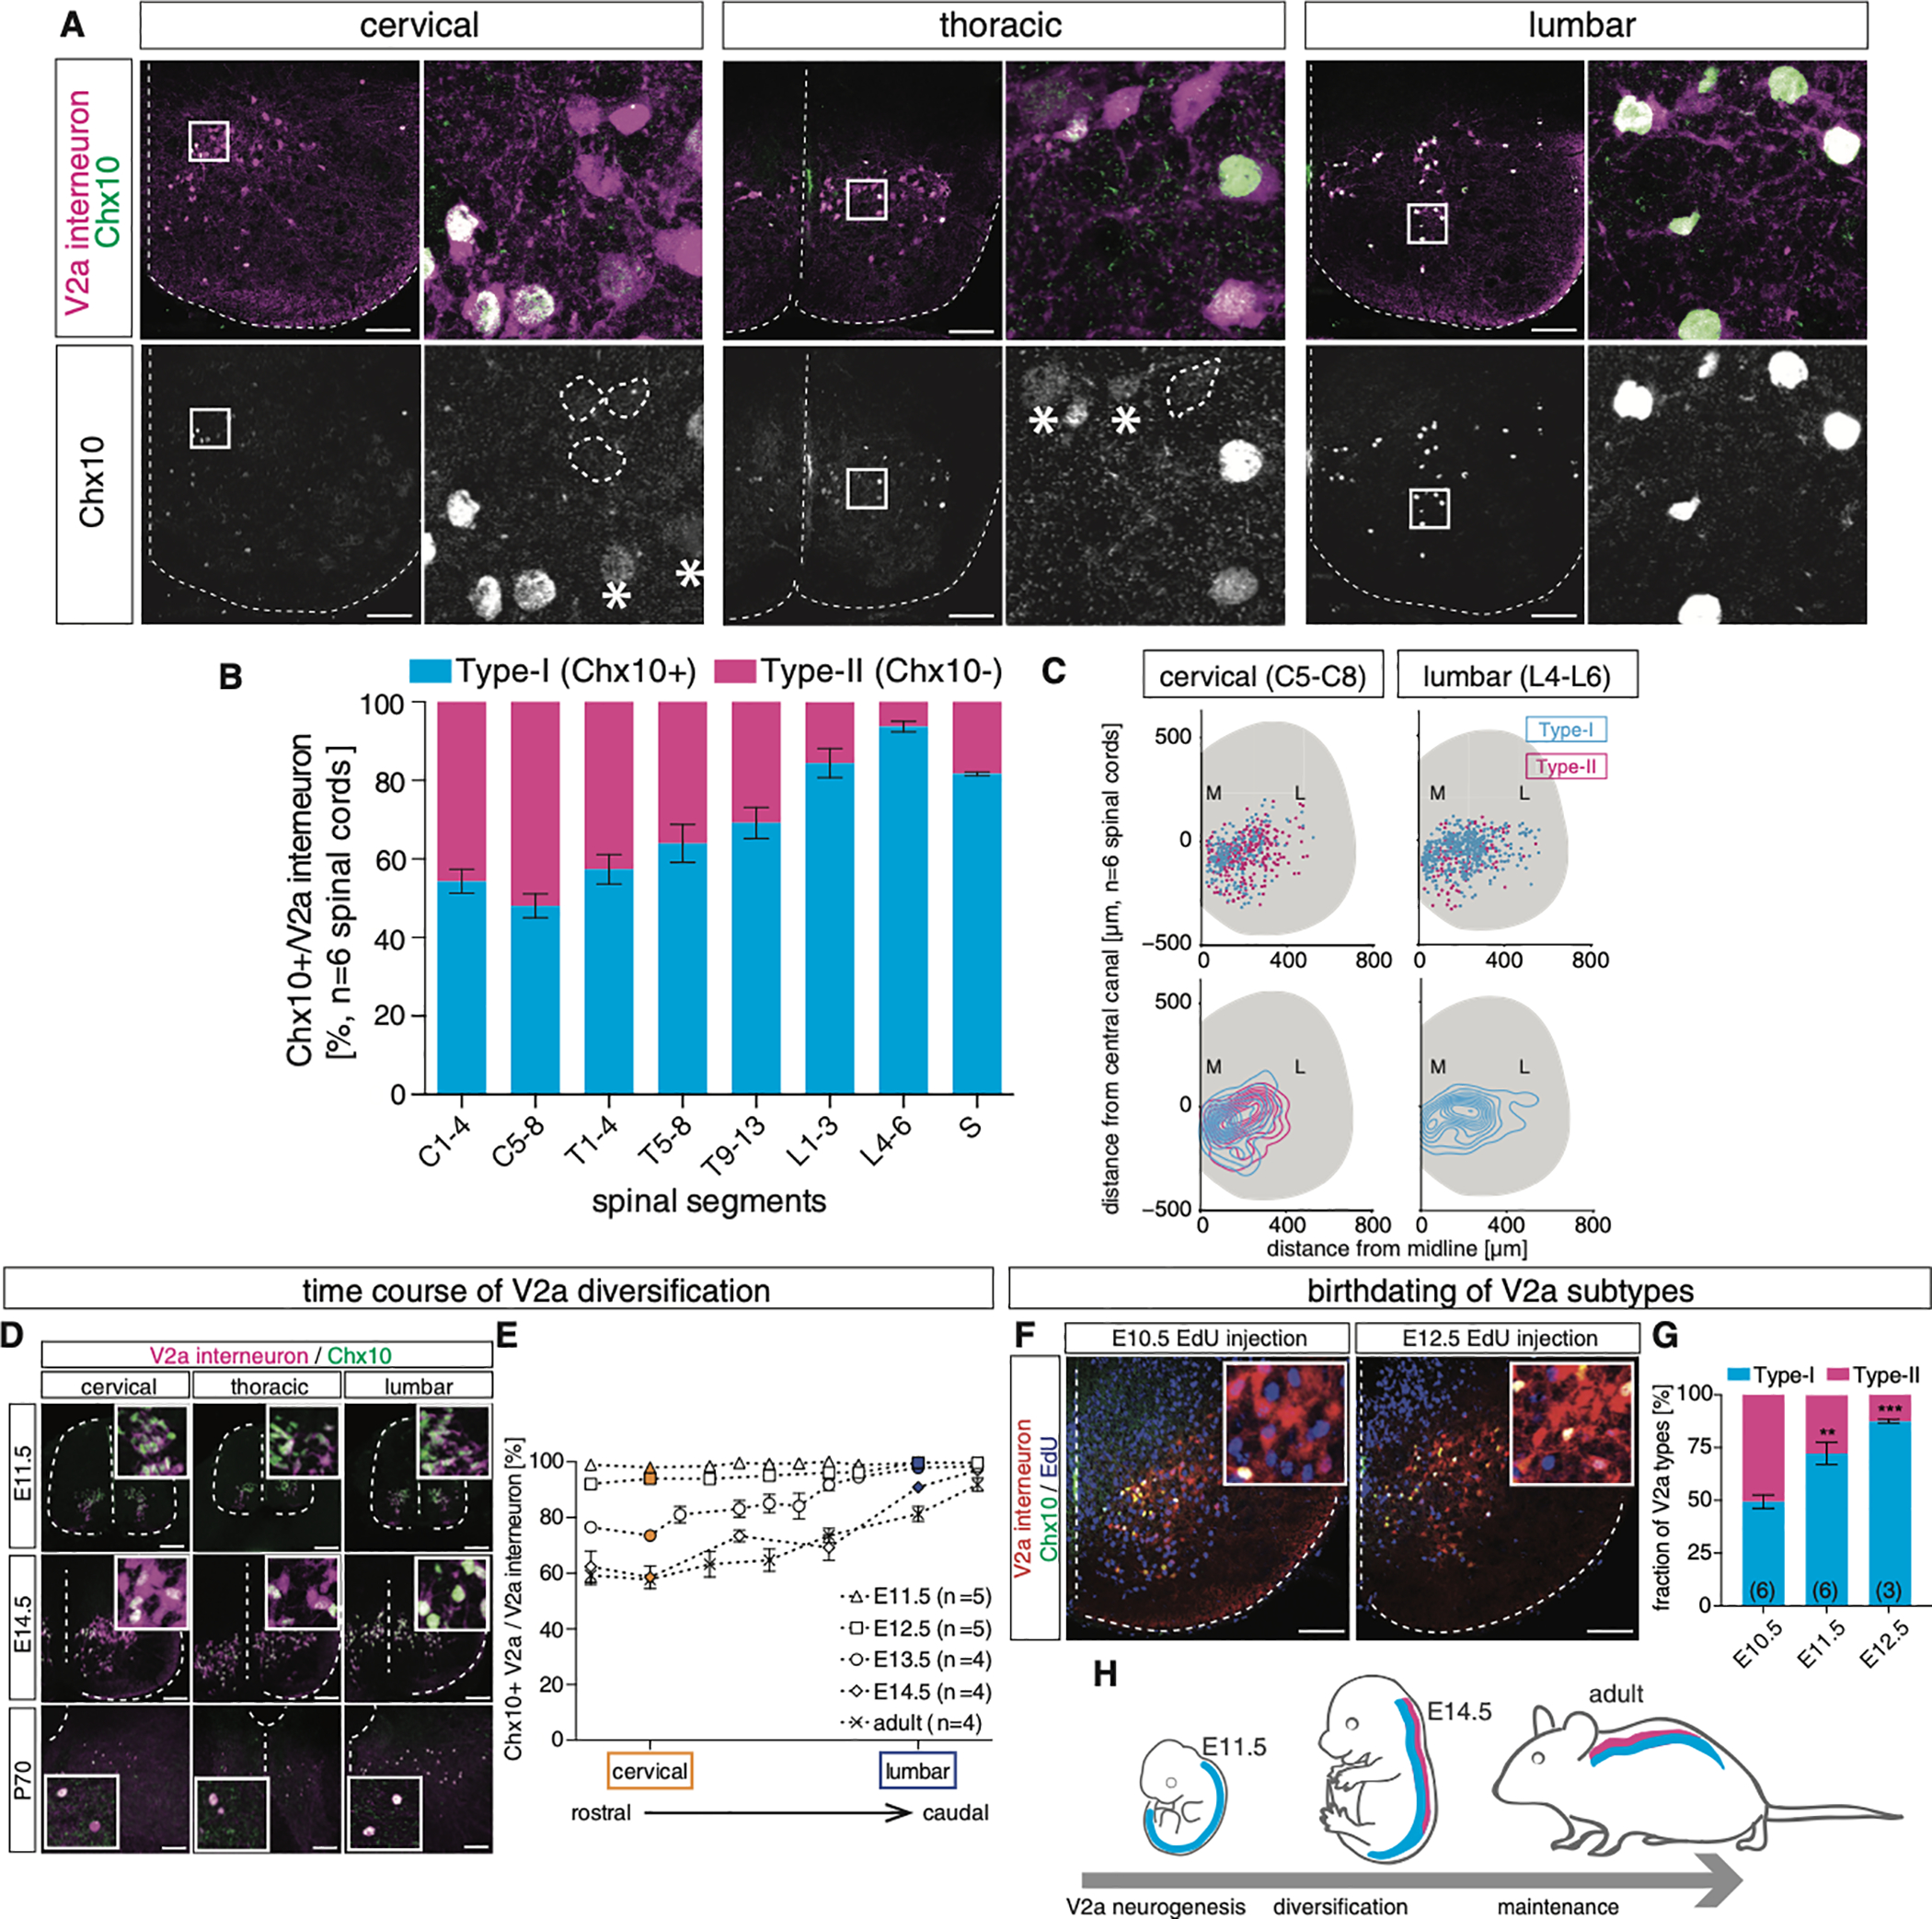
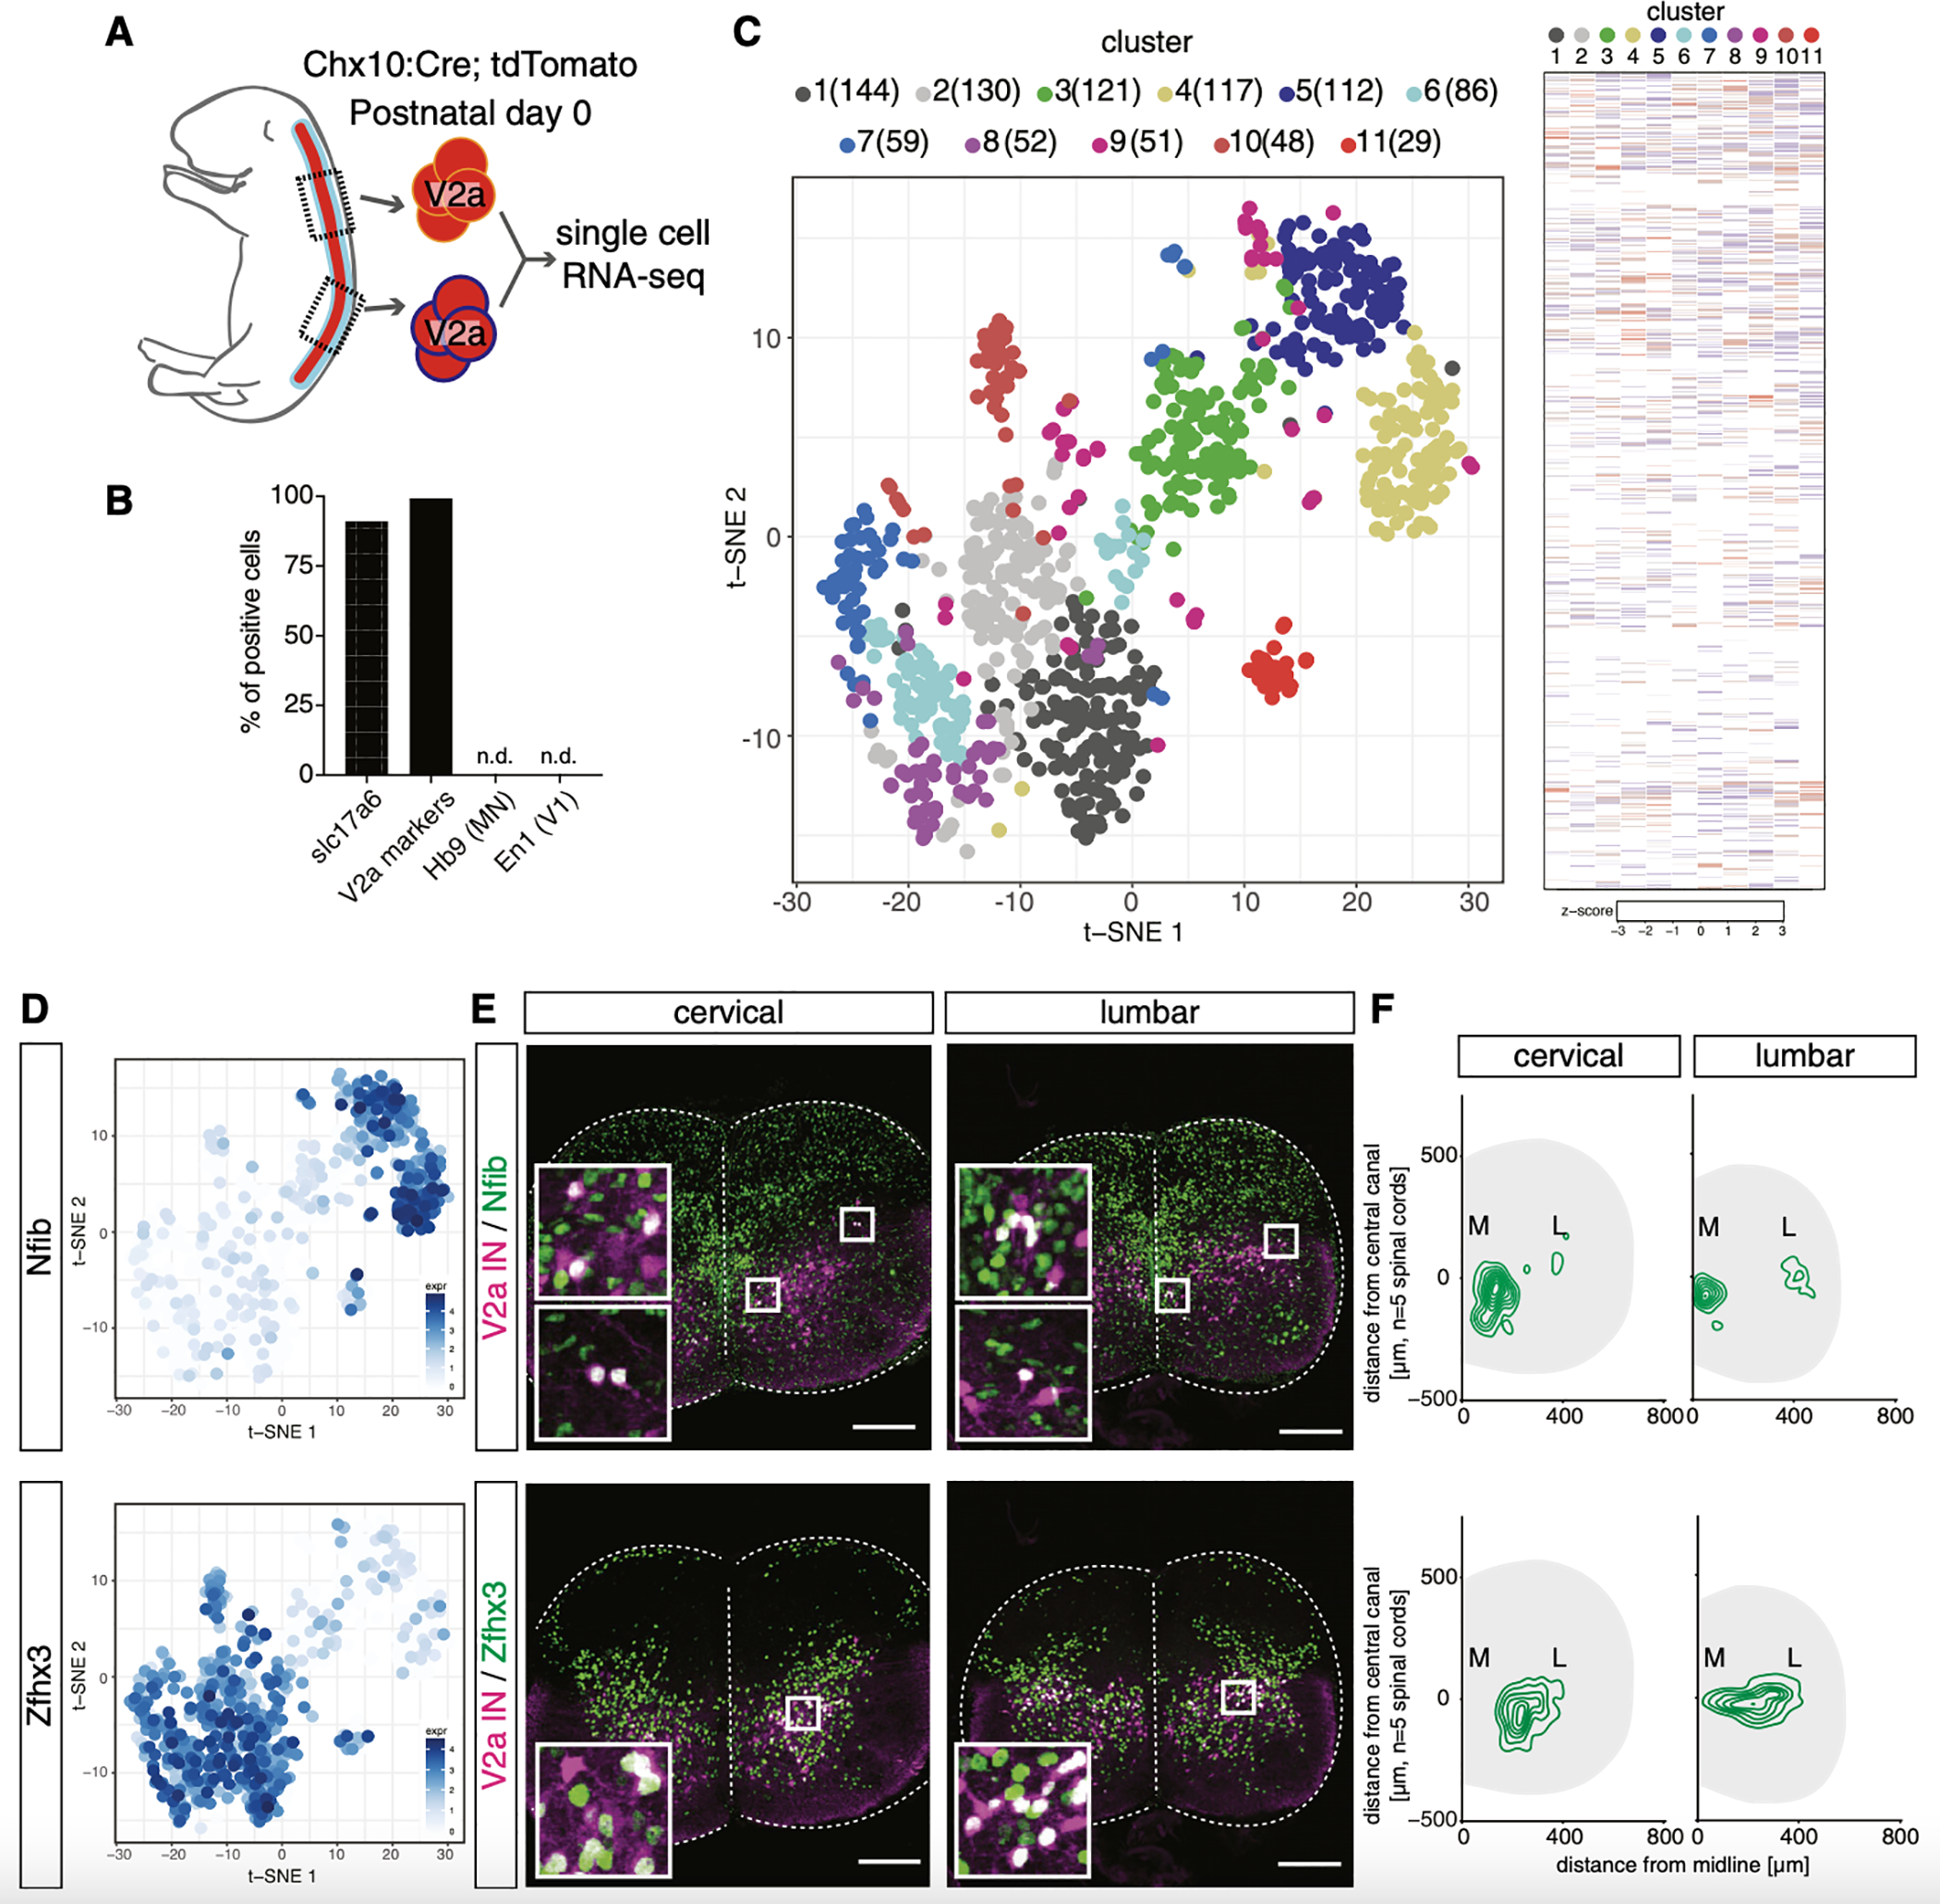
The spinal cord contains neural networks that enable regionally distinct motor outputs along the body axis. Nevertheless, it remains unclear how segment-specific motor computations are processed because the cardinal interneuron classes that control motor neurons appear uniform at each level of the spinal cord. V2a interneurons are essential to both forelimb and hindlimb movements, and here we identify two major types that emerge during development: type I neurons marked by high Chx10 form recurrent networks with neighboring spinal neurons and type II neurons that downregulate Chx10 and project to supraspinal structures. Types I and II V2a interneurons are arrayed in counter-gradients, and this network activates different patterns of motor output at cervical and lumbar levels. Single-cell RNA sequencing (RNA-seq) revealed type I and II V2a neurons are each comprised of multiple subtypes. Our findings uncover a molecular and anatomical organization of V2a interneurons reminiscent of the orderly way motor neurons are divided into columns and pools.

Keywords: V2a interneuron; excitatory neuron; forelimb; hindlimb; locomotion; motor control; neuronal diversity; optogenetics; single-cell RNA-seq; spinal cord.


Conflict of interest statement

DECLARATION OF INTERESTS

The authors declare no competing interests.

Figures

Figure 1.
Figure 1.. Cervical and Lumbar V2a Interneurons Are Glutamatergic and Synapse with Ventral Spinal Targets
(A) Chx10:Cre was crossed to ROSA-CAG:lsl:tdTomato reporter to indelibly label V2a interneurons. V2a cell bodies were found throughout the length of the spinal cord. Postnatal day (P) 0 is shown. 20-μm cryosections are shown. Scale bar, 100 μm. (B) Chx10:Cre was crossed to ROSA-CAG:lsl:Synaptophysin-tdTomato reporter to label the presynaptic terminals of all V2a interneurons (INs). (C and D) Synaptophysin labeling was detected throughout the entire ventral spinal cord. Numbered boxes correspond to the magnified images. Both in cervical (C) and lumbar (D) segments, NeuN+ cells, ChAT+ motor neurons, and Chx10+ V2a interneurons received inputs. Neurons in the dorsal spinal cord lacked V2a inputs (panels 3 and 6). 30-μm cryosections are shown. Scale bars, 100 and 5 μm. Magnified images are z-projections of two planes (0.5 μm). (E) AAV1-hSyn:FLEX:tdTomato-2A-SypGFP was injected into either cervical or lumbar segments of Chx10:Cre animals to label the presynaptic terminals of local V2a interneurons. Viral injections were conducted at P2 and tissue was collected at P21. (F and G) Both in cervical (F) and lumbar (G) segments, GFP+ V2a presynaptic terminals were detected on ChAT+ motor neurons and neighboring Chx10+ V2a interneurons in the ipsilateral cord. Numbered boxes correspond to magnified images. 50-μm cryosections are shown. Scale bar, 100 and 5 μm. Magnified images are z-projections of two planes (0.5 μm). (H) Illustration summarizing that glutamatergic V2a interneurons project onto many types of ipsilateral ventral spinal cord neurons, including V2a interneurons (V2a), motor neurons (MN), and other ventral interneurons (vIN). This pattern of connectivity appears to be preserved at both cervical and lumbar levels.
Figure 2.
Figure 2.. Photostimulation of Cervical and Lumbar V2a Interneurons Activates Different Motor Responses
(A) V2a interneurons in spinal cords dissected from Chx10:Cre × ROSA-CAG:lsl:ChR2-YFP mice were unilaterally photostimulated while recording motor output from ventral roots. (B) Motor recording over 10 stimulation trials (gray) from a representative animal. An example motor response is shown in orange (cervical) or blue (lumbar). The duration of stimulation is highlighted blue. (C) Trial reliability in evoking motor neuron spikes with V2a stimulation. 48% ± 12% (n = 12 animals, ± SEM %) of cervical stimulation trials evoked motor neuron spikes at cervical segments, whereas 100% ± 0% (n = 13 animals, ± SEM %) of lumbar stimulation trials evoked spikes at lumbar segments. Student’s t test, ***p < 0.001. (D) Latency in evoking motor neuron spikes with V2a stimulation. Latency at cervical levels was 53.03 ± 2.93 ms (n = 9 animals, ± SEM ms), while lumbar V2a stimulation had a latency of 31.19 ± 1.83 ms (n = 13 animals, ± SEM ms). Student’s t test, ***p < 0.001. (E) Contralateral V2a interneurons were stimulated to activate polysynaptic pathways. (F) Cervical and lumbar ventral root motor neuron recording following contralateral V2a stimulation. (G) Trial reliability in evoking motor neuron spikes with V2a stimulation. 3% ± 2% (n = 6 animals, ± SEM %) of cervical contralateral stimulation trials evoked motor neuron spikes, whereas 93% ± 4% (n = 6 animals, ± SEM %) of lumbar contralateral stimulation evoked spikes. Student’s t test, ***p < 0.001. (H) Latency in evoking motor neuron spikes with V2a stimulation. Of the stimulation trials resulting in motor neuron spikes, cervical V2a stimulation had a latency of 64.29 ms (n = 2 animals), while lumbar V2a stimulation had a latency of 44.86 ± 1.87 ms (n = 6 animals, ± SEM ms). (I) Transsynaptic viral tracing of connections between motor neurons and V2a interneurons at cervical and lumbar segments. ΔG-rabies virus expressing GFP (ΔG-Rabies:GFP) and AAV expressing glycoprotein (AAV:G) were co-injected into forelimb wrist extensor (WE) or hindlimb gastrocnemious (MG) muscles of Chx10:Cre; tdTomato animals to visualize spinal interneurons that synapse onto infected motor neurons. Injections were conducted at P0 and tissue was collected at P7. (J–M) Spatial distribution of premotor V2a interneurons in cervical (J) and lumbar (K) segments. Contour maps revealed premotor V2a interneurons are enriched laterally (L). GFP+ neurons and GFP+tdTomato+ V2a interneurons (white arrowheads) were quantified. 2.2% ± 0.4% (n = 6 animals, ± SEM %) of forelimb premotor interneurons were V2a interneurons, whereas 4.9% ± 0.2% (n = 9 animals, ± SEM %) of hindlimb premotor interneurons were V2a interneurons (M). Student’s t test, ***p < 0.001. ChAT+ V0c interneurons represented 0.6% ± 0.1% (n = 5 animals, ± SEM %) and 0.5% ± 0.1% (n = 5 animals, ± SEM %) at cervical and lumbar segments, respectively. Student’s t test, p = 0.48. 25-μm cryosections are shown. Scale bar, 100 μm. (N and O) Summary of motor neuron responses and connectivity with V2a interneurons. Lumbar V2a population (O) has more numerous connections with motor neurons and activates ipsilateral and contralateral motor responses more reliably than cervical V2a population (N).
Figure 3.
Figure 3.. V2a Interneurons Exhibit Distinct Genetic Signatures between Cervical and Lumbar Segments
(A) Cervical and lumbar segments were isolated from Chx10:Cre; tdTomato neonates at P0 and sorted into Tom+ and Tom− samples. Each sample consisted of cells pooled from ~5 animals. A total of three litters was used for biological replicates (n = 3). (B) Schematic of the comparative analyses. (C) Principal component analysis of gene profiles from V2a and non-V2a cells from cervical and lumbar segments. (D and E) Differentially expressed genes in V2a interneurons compared to non-V2a cells in cervical (D) and lumbar (E) segments. Five transcription factors and a non-coding RNA (highlighted) were highly enriched in V2a interneurons in both segments. Cre RNA levels tracked with Chx10. (F) Hox genes detected in cervical and lumbar V2a interneurons along the rostrocaudal axis. See also Figure S3A. (G) Differentially expressed genes in cervical V2a compared to lumbar V2a interneurons from −6 to +6 log2 fold change. Cervical and lumbar enriched genes (p < 0.05) are highlighted in orange and blue, respectively. See also Figure S3.
Figure 4.
Figure 4.. The Conventional Marker Gene Chx10 Labels V2a Types along the Rostrocaudal Axis that Emerges during Embryonic Development
(A) Chx10 immunostaining in Chx10:Cre; tdTomato animals at P1. In cervical segments, a subset of Tom+ V2a interneurons lacked Chx10 immunostaining (dashed circles). At lumbar levels Chx10 was detected in most Tom+ V2a interneurons. Among the Chx10+ V2a interneurons, we observed signal intensity differences (asterisks indicate low Chx10). 20-μm cryosections are shown. Scale bar, 50 μm. (B) Quantification of type I (Chx10+) and type II (Chx10−) V2a IN numbers along the rostrocaudal axis (n = 6 animals). (C) Spatial distribution of type I (Chx10+) and type II (Chx10−) V2a interneurons in cervical and lumbar segments (n = 6 animals). Contour maps revealed medial bias for type I relative to type II. (D) Time course of Chx10 protein expression. Chx10 immunostaining was conducted from embryonic day (E)11.5–E14.5 and P70 animals. 12-μm cryosections at E11.5 and E14.5 and 20-μm cryosections at P70 are shown. Scale bars, 50 μm at E11.5 and 14.5 and 100 μm at P70. (E) Ratio of Chx10+ V2a interneurons along the rostrocaudal axis. Since the lengths of the spinal cords are different at different developmental stages, Foxp1 immunostaining was conducted to identify brachial/cervical and lumbar segments (data not shown). (F and G) EdU was injected into E10.5–E13.5 pregnant females, respectively, and spinal cords were collected at P0 to identify V2a interneuron birth dates (F). Type II V2a interneurons were born at an earlier time point (G). One-way ANOVA with post hoc Dunnett’s test, E10.5 versus E11.5, **p < 0.01 and E10.5 versus E12.5, ***p < 0.001. 20-μm cryosections are shown. Scale bar, 50 μm. (H) Summary of V2a diversification. Type I and type II interneurons emerge progressively from immature postmitotic V2a interneurons between E12.5 and E14.5, and the diversification is maintained into adulthood.
Figure 5.
Figure 5.. Type II V2a Interneurons Project Supraspinally to the Brainstem
(A–D) DG-Rabies:GFP was injected into the brainstem of Chx10:Cre; tdTomato animals to label spinal neurons with brainstem projections. Injections were conducted at P2 and tissue was collected at P6 (A). GFP+/Tom+ V2a interneurons (B) were quantified along the rostrocaudal axis of the spinal cord. 84.8% ± 5.6% (n = 7 animals, ±SEM %) of all brainstem-projecting V2a interneurons resided within cervical segments (C). Brainstem-projecting non-V2a interneurons were found on the contralateral side of lumbar segments (asterisk) (D). 25-μm cryosections are shown. One-way ANOVA with post hoc Dunnett’s test, *p < 0.05 and **p < 0.01. Scale bar, 100 μm. (E) Spatial distribution of brainstem-projecting V2a interneurons in cervical segments (n = 6 animals). Contour map revealed brainstem-projecting V2a interneurons are enriched laterally. (F) Chx10 expression was monitored with immunostaining of ΔG-Rabies:GFP+/Tom+V2a interneurons. Yellow arrowheads indicate brainstem-projecting V2a interneurons without Chx10 expression. 25-μm cryosections are shown. Scale bar, 50 μm. (G) 83% ± 5% of supraspinal-projecting V2a interneurons were the type II subtype, while 44% ± 3% of the cervical V2a interneurons in the corresponding sections were the type II subtype. n = 9 animals, ±SEM %; Student’s t test, ***p < 0.001.
Figure 6.
Figure 6.. Single-Cell RNA Sequencing Identifies Multiple Spatially Organized V2a Subgroups
(A) Cervical and lumbar segments were isolated from two Chx10:Cre; tdTomato neonates at P0, and Tom+ cells were subjected to single-cell RNA sequencing (scRNA-seq), which produced 418,000 reads/cell and detected 12,986 genes (4,435 genes/cell, 12,349 mean unique molecular identifiers [UMIs]/cell). (B) Slc17a6 and one or more V2a marker genes (Chx10, Sox14, Lhx3, Lhx4, and Shox2) were detected in most of the cells. Neither motor neuron (Hb9) nor V1 IN (En1) markers were detected as contaminants. (C) Left panel: t-SNE plot showing the 11 clusters identified. Each cluster is color coded and the number of cells in each cluster is shown. Right panel: heatmap shows distinct gene expression patterns for each cluster. (D) Cells expressing Nfib and Zfhx3 are shown with log2 scale. These two genes, among others (Figures S6A and S6B), separated V2a interneurons into two populations. (E) Upper row: Nfib immunostaining in Chx10:Cre; tdTomato animals at P0. In cervical and lumbar segments, a subset of V2a interneurons were Nfib+ and were most concentrated toward the medial edge of the spinal cord. Lower row: Zfhx3 immunostaining is shown. At cervical and lumbar levels, a subset of V2a interneurons were Zfhx3+ and were enriched laterally. 20-μm cryosections are shown. Scale bar, 100 μm. (F) Spatial distribution of Nfib+ (upper panel) and Zfhx3+ (lower panel) V2a interneurons in cervical and lumbar segments (n = 5 animals). Contour maps revealed medial enrichment of Nfib+ V2a and lateral enrichment of Zfhx3+ V2a.
Figure 7.
Figure 7.. Laterally Enriched V2a Subsets Drive the Rostrocaudal Diversification
(A) Left: expression of Chx10 in log2 scale. Right: percentage composition of Chx10-high and Chx10-low V2a interneurons in each cluster is shown. (B) Left: cervical-lumbar composition of each cluster. Right: distribution of cervical and lumbar cells in t-SNE space is shown. Clusters were color coded based on the ratio of cervical to lumbar cells. (C) Top: Zfhx3 expression pattern and level in t-SNE plot. Middle: Zfhx3 and Chx10 immunostaining in Chx10:Cre; tdTomato animals at P0 at cervical and lumbar segments is shown. 20-μm cryosections are shown. Scale bar, 50 μm. Bottom: type I and type II V2a interneurons exhibited an extensive counter-gradient among Zfhx3+ V2a interneurons. One-way ANOVA with post hoc Dunnett’s test, cervical versus thoracic, ***p < 0.001 and cervical versus lumbar, ***p < 0.001. (D) Top: Shox2 expression pattern and level. Middle: Shox2 and Chx10 immunostaining is shown. 20-μm cryosections are shown. Scale bar, 50 μm. Bottom: type I and type II V2a interneurons exhibited an extensive counter-gradient among Shox2+ V2a interneurons. One-way ANOVA with post hoc Dunnett’s test, cervical versus thoracic, *p < 0.05 and cervical versus lumbar, ***p < 0.001. (E) Top: Nfib expression pattern and level. Middle: Nfib and Chx10 immunostaining is shown. 20-μm cryosections are shown. Scale bar, 50 μm. Bottom: type I and type II V2a interneurons were less graded among Nfib+ V2a interneurons. One-way ANOVA with post hoc Dunnett’s test, cervical versus thoracic, not significant (n.s.) and cervical versus lumbar, **p < 0.01. (F) Top: NeuroD2 expression pattern and level. Middle: NeuroD2 and Chx10 immunostaining is shown. 20-μm cryosections are shown. Scale bar, 50 μm. Bottom: type I and type II V2a interneurons were less graded among NeuroD2+ V2a interneurons. One-way ANOVA with post hoc Dunnett’s test, cervical versus thoracic, n.s. and cervical versus lumbar, n.s. (G) Top: Sp8 expression pattern and level. Middle: Sp8 and Chx10 immunostaining is shown. 20-μm cryosections are shown. Scale bar, 50 μm. Bottom: type I and type II V2a interneurons were less graded among Sp8+ V2a interneurons. One-way ANOVA with post hoc Dunnett’s test, cervical versus thoracic, n.s. and cervical versus lumbar, **p < 0.01. (H) Model of type I and type II V2a interneuron circuit modules arrayed in a gradient along the rostrocaudal axis of the spinal cord. Type I V2a interneurons, enriched in lumbar segments, lack brainstem projections and synapse onto other ventral interneurons (vIN connections simplified in this schematic). Type II V2a interneurons, enriched in cervical segments, project to supraspinal structures, likely sending motor efference copies to the lateral reticular nucleus (LRN), which indirectly feeds back into the spinal cord through descending cortical and reticular tracts among other descending tracts (Alstermark et al., 2007; Jiang et al., 2015). Motor neurons are segmentally organized into columns and pools (gray), whereas V2a IN subtypes are distributed along the spinal cord. A counter-gradient of type I and type II V2a is positioned within a lateral domain of V2a interneurons.

References

    1. Al-Mosawie A, Wilson JM, and Brownstone RM (2007). Heterogeneity of V2-derived interneurons in the adult mouse spinal cord. Eur. J. Neurosci. 26, 3003–3015. - PubMed
    1. Alaynick WA, Jessell TM, and Pfaff SL (2011). SnapShot: spinal cord development. Cell 146, 178–178.e1. - PMC - PubMed
    1. Alstermark B, Isa T, Pettersson LG, and Sasaki S (2007). The C3-C4 propriospinal system in the cat and monkey: a spinal pre-motoneuronal centre for voluntary motor control. Acta Physiol. (Oxf.) 189, 123–140. - PubMed
    1. Arber S (2012). Motor circuits in action: specification, connectivity, and function. Neuron 74, 975–989. - PubMed
    1. Azim E, Jiang J, Alstermark B, and Jessell TM (2014). Skilled reaching relies on a V2a propriospinal internal copy circuit. Nature 508, 357–363. - PMC - PubMed

Publication types