. 2018 Feb 21;97(4):940-952.e4.
doi: 10.1016/j.neuron.2018.01.032. Epub 2018 Feb 1.

The Basal Forebrain Regulates Global Resting-State fMRI Fluctuations

Affiliations

The Basal Forebrain Regulates Global Resting-State fMRI Fluctuations

Janita Turchi et al. Neuron. .

Abstract

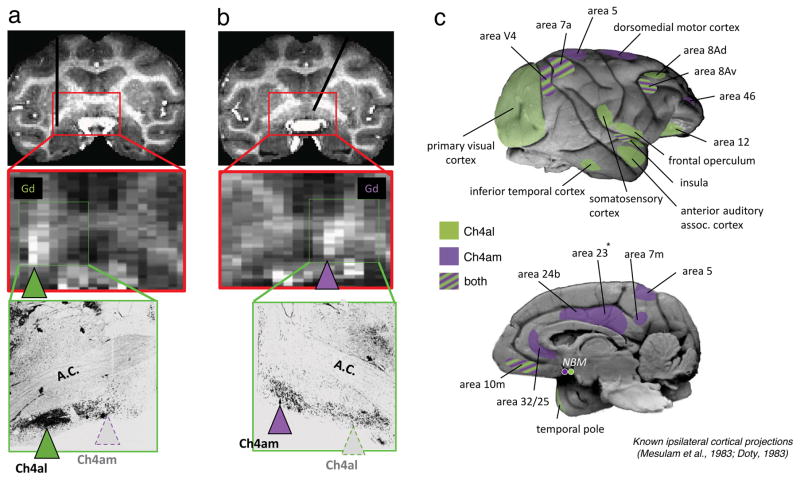
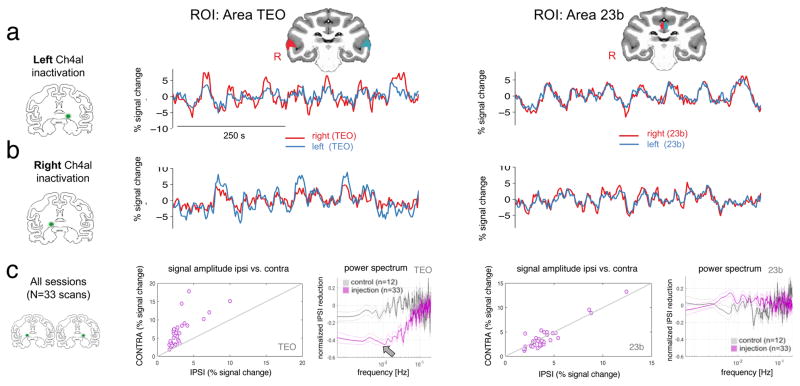
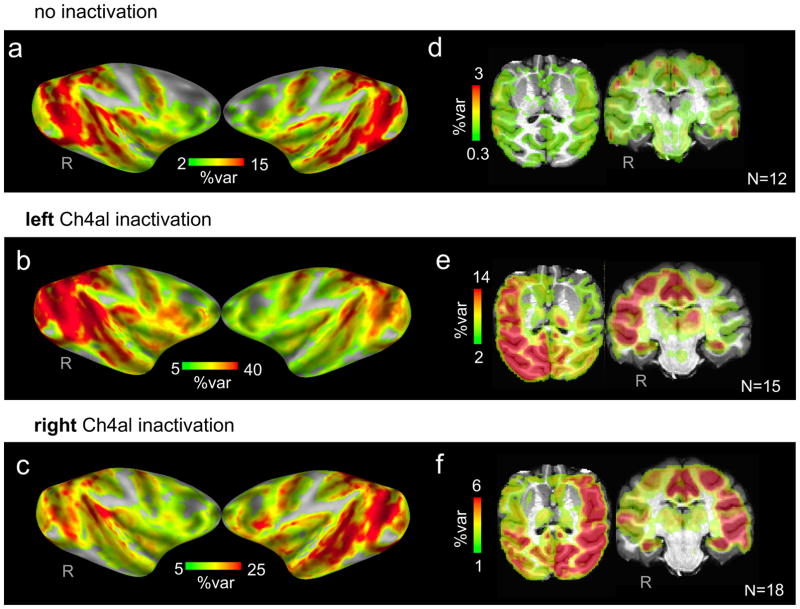
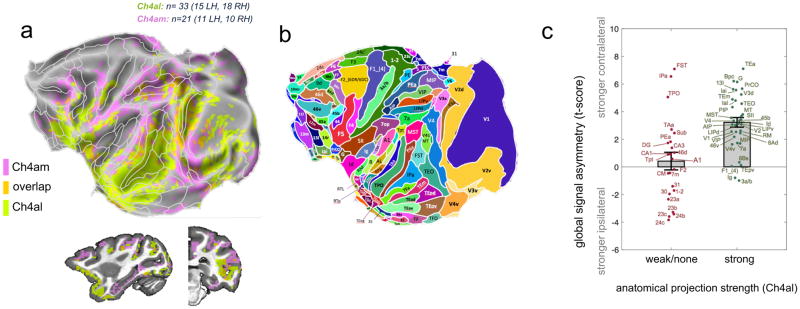
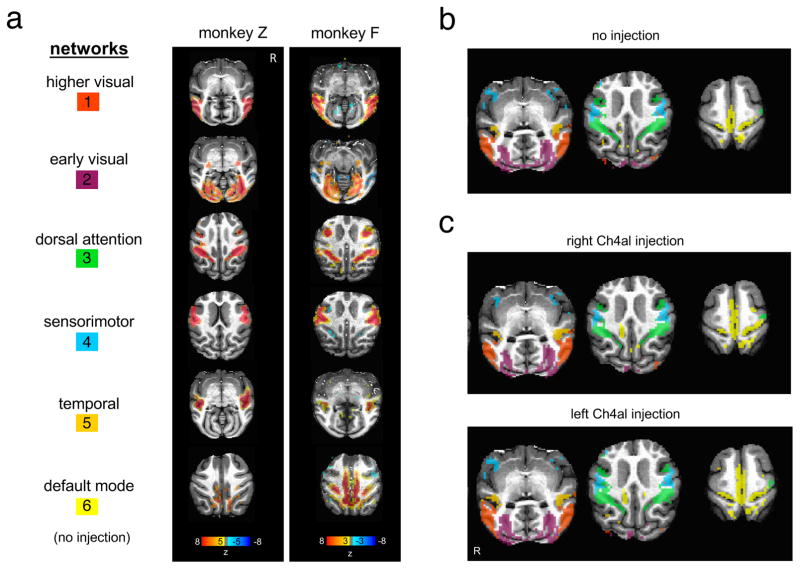
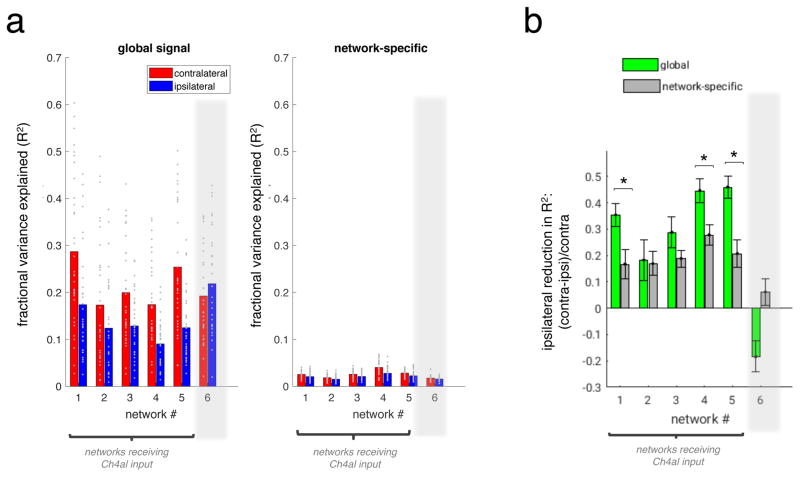
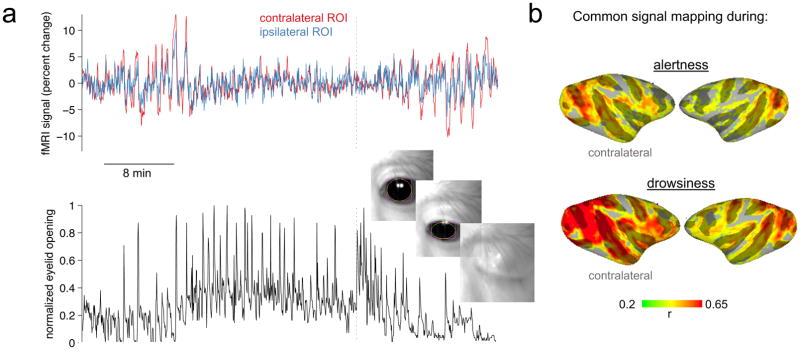
Patterns of spontaneous brain activity, typically measured in humans at rest with fMRI, are used routinely to assess the brain's functional organization. The mechanisms that generate and coordinate the underlying neural fluctuations are largely unknown. Here we investigate the hypothesis that the nucleus basalis of Meynert (NBM), the principal source of widespread cholinergic and GABAergic projections to the cortex, contributes critically to such activity. We reversibly inactivated two distinct sites of the NBM in macaques while measuring fMRI activity across the brain. We found that inactivation led to strong, regionalized suppression of shared or "global" signal components of cortical fluctuations ipsilateral to the injection. At the same time, the commonly studied resting-state networks retained their spatial structure under this suppression. The results indicate that the NBM contributes selectively to the global component of functional connectivity but plays little if any role in the specific correlations that define resting-state networks.

Keywords: arousal; basal forebrain; cerebral cortex; fMRI; functional connectivity; global signal; macaque; nucleus basalis; ongoing activity; resting-state networks.


Conflict of interest statement

DECLARATION OF INTERESTS

The authors declare no competing interests.

Figures

Figure 1
Figure 1. Inactivation of basal forebrain subregions
MRI was used to guide injection cannula through a grid to targets more anteromedial or more posterolateral target locations in the basal forebrain. During each session, gadolinium (Gd) was co-injected as a contrast agent to visualize the location of the injection. (a) Example of a session targeting the Ch4al position. Upper panel shows the position of the cannula. Middle panel shows the spread of Gd for one session. Lower panel shows the location of cholinergic staining defining Ch4al basal forebrain subregion (green arrowhead, image, adapted from Mesulam et al., 1983). (b) Same format as (a), but for Ch4am injection in opposite hemisphere. (c) Pattern of known relevant cortical projections from basal forebrain in the macaque, based on previous anatomical tracer studies.
Figure 2
Figure 2. NBM inactivation induces regional changes in the amplitude of spontaneous fMRI signals
Time series extracted from symmetric ROIs following inactivation of the Ch4al subregion in the left (a) and right (b) hemispheres. In example area TEO in the inferotemporal cortex, which is known to receive direct projections from Ch4al, the amplitude of spontaneous fluctuations is attenuated in the hemisphere ipsilateral to the injection site following both left- and right-hemisphere injections. In contrast, no inter-hemispheric differences were observed during the same time intervals in the cingulate cortex (area 23b), which does not receive projections from Ch4al. This effect was observed in all 33 Ch4al inactivation scans (c), with a lower ipsilateral fMRI amplitude in inferotemporal cortex but not in the cingulate cortex. Each point corresponds to a single scan, and amplitude was computed using variance as a summary statistic. Power spectra on the right, computed from the same symmetric ROIs, demonstrate the selective drop in the low-frequency components of the fMRI signal. The plotted spectra are the normalized differences between the hemispheres, computed at each frequency value as (ipsilateral-contralateral)/(ipsilateral +contralateral). Data are shown for all Ch4al injection sessions of monkey Z, and shaded error bars reflect standard error.
Figure 3
Figure 3. NBM inactivation alters the distribution of shared spontaneous fluctuations
(a–c) Surface maps display the percentage of temporal variance (R2) explained by the global signal at each voxel, during control sessions with no injection (a), and following injection of the Ch4al subregion on the left (b) and right hemispheres (c). A symmetric distribution of global signal correlations can be seen in the control sessions, while Ch4al inactivation corresponded with a marked reduction within the hemisphere ipsilateral to the injection site. Note the difference in scaling of the plots in (b) and (c), corresponding to left- and right-hemisphere injections. (d–f) Axial and coronal sections that further highlight regional suppression of the shared signal, in this case computing the difference in average signal between hemispheres (see main text and Supplementary Methods). Note obvious sparing of cingulate and hippocampus in the coronal slices in (e) and (f).
Figure 4
Figure 4. Spatially distinct cortical zones influenced NBM subregions
(a) Direct comparison of regions having most significant ipsilateral suppression of global signal for the Ch4al (green; monkey Z) and Ch4am (pink; monkey F) injections sites. Maps are thresholded to show voxels with the highest 35% t-scores (ipsilateral<contralateral) in each condition, and are superimposed upon the areal boundaries of the Saleem and Logothetis atlas. (b) For anatomic reference, the areal boundaries based on the Saleem and Logothetis atlas are aligned with the map in (a). (c) Region-by-region correspondence between anatomical projection strength (from Ch4al) and asymmetry of the global signal correlation, for the Ch4al injection scans in Monkey Z (n=33 scans). Value on the y-axis represents the t-score, across scans, of the hemispheric asymmetry in the correlation with the global signal (contralateral > ipsilateral) averaged within each of the indicated areas. Each data point corresponds to an ROI, labeled as in panel (b). Error bars indicate standard error. For a description of the classification of projections into “weak/none” and “strong” categories, please refer to the Supplementary Methods.
Figure 5
Figure 5. Preservation of resting-state networks despite NBM inactivation
(a) Control sessions from both monkeys (no BF injection). Using independent component analysis, we identified six components (“networks”) that closely resemble patterns reported in previous literature. (b) Control session networks obtained from dual regression displayed in different colors. (c) Same networks identified after injection of the NBM. Maps of individual networks were created by averaging, for each network, the dual-regression weights (β) across scans of the same condition (NBM injection site). To form the composite map shown here, each voxel was assigned to the network having the highest value at that voxel, and the resulting image was binarized at β = 0.004 (details in Supplementary Methods).
Figure 6
Figure 6. Comparison between global and network-specific effects of NBM injection
(a) Fractional variance explained (R2) for global signal time courses (left) and network-specific time courses (right), averaged within the boundaries of symmetric ROIs corresponding to each of the 6 resting-state networks depicted in Figure 5a. Bar height corresponds to mean, and each dot indicates one scan (N=33, all Ch4al sessions of Monkey Z). Note that only networks 1–5 receive input from Ch4al, whereas network 6 is extrinsic to Ch4al projection zones. To derive R2 values for network-specific signals, we first orthogonalized each dual-regression network time course to the remaining network time courses prior to taking its (marginal) R2 with the fMRI data. (b) Quantification of the asymmetry in R2 between contralateral and ipsilateral hemispheres, expressed as a proportion of the contralateral value. Error bars indicate standard error. Asterisks indicate network ROIs wherein the hemispheric asymmetry of R2 is significantly greater in the global signal compared to the network-specific signal (at p<0.05, Bonferroni-corrected).
Figure 7
Figure 7. Influence of NBM input depends on behavioral arousal state
Following inactivation, the hemispheric asymmetry in fMRI signal fluctuation amplitude, and in the global signal, was more pronounced during periods of apparent drowsiness compared to alertness. (a) Time series taken from symmetric positions in the occipital cortex during a scan following left-hemisphere NBM injection in Ch4al (monkey Z). The lower panel indicates, for the same time interval, an estimate of behavioral arousal based on eyelid opening and closure. (b) Maps of correlation with the global signal during conditions of probable alertness and drowsiness.

Comment in

References

    1. Aggleton JP, Friedman DP, Mishkin M. A comparison between the connections of the amygdala and hippocampus with the basal forebrain in the macaque. Exp Brain Res. 1987;67:556–568. - PubMed
    1. Asthagiri AR, Walbridge S, Heiss JD, Lonser RR. Effect of concentration on the accuracy of the convective imaging distribution of a gadolinium-based surrogate tracer. J Neurosurgery. 2011;115:467–473. - PMC - PubMed
    1. Baker-Nigh A, Vahedi S, Davis EG, Weintraub S, Bigio EH, Klein WL, Geula C. Neuronal amyloid-β accumulation within cholinergic basal forebrain in ageing and Alzheimer’s disease. Brain. 2015;138:1722–1737. http://doi.org/10.1093/brain/awv024. - DOI - PMC - PubMed
    1. Bassett DS, Sporns O. Network Neuroscience. Nat Neurosci. 2017;20:353–364. doi: 10.1038/nn.4502. - DOI - PMC - PubMed
    1. Beckmann CF, Smith SM. Probabilistic Independent Component Analysis for Functional Magnetic Resonance Imaging. IEEE Transactions on Medical Imaging. 2004;23:137–152. - PubMed

Publication types

LinkOut - more resources