

Dual regression physiological modeling of resting-state EPI power spectra: Effects of healthy aging
- PMID: 29398431
- PMCID: PMC6414402
- DOI: 10.1016/j.neuroimage.2018.01.011
Dual regression physiological modeling of resting-state EPI power spectra: Effects of healthy aging
Abstract
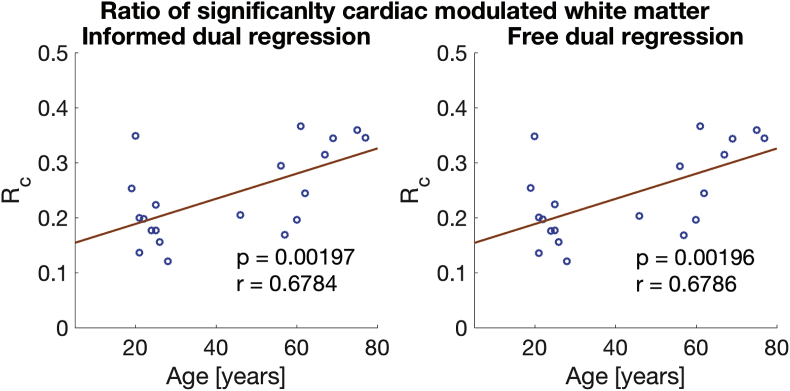
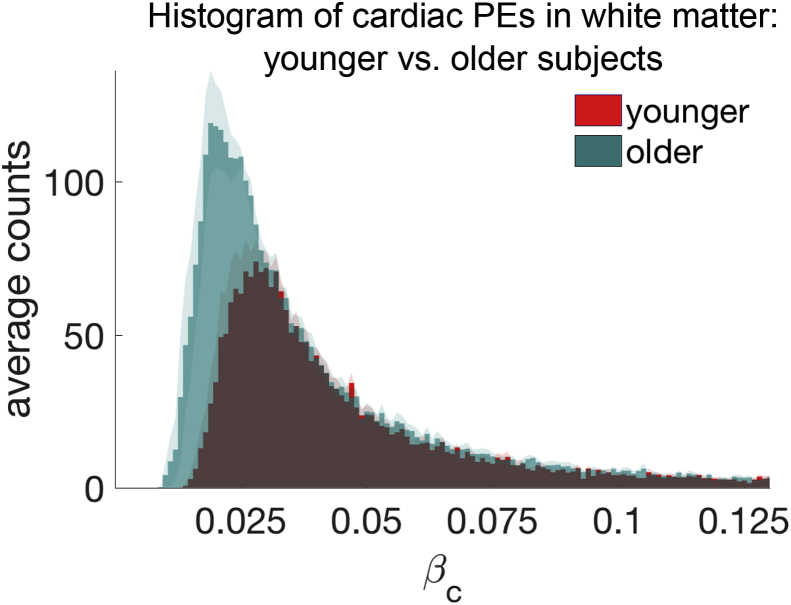
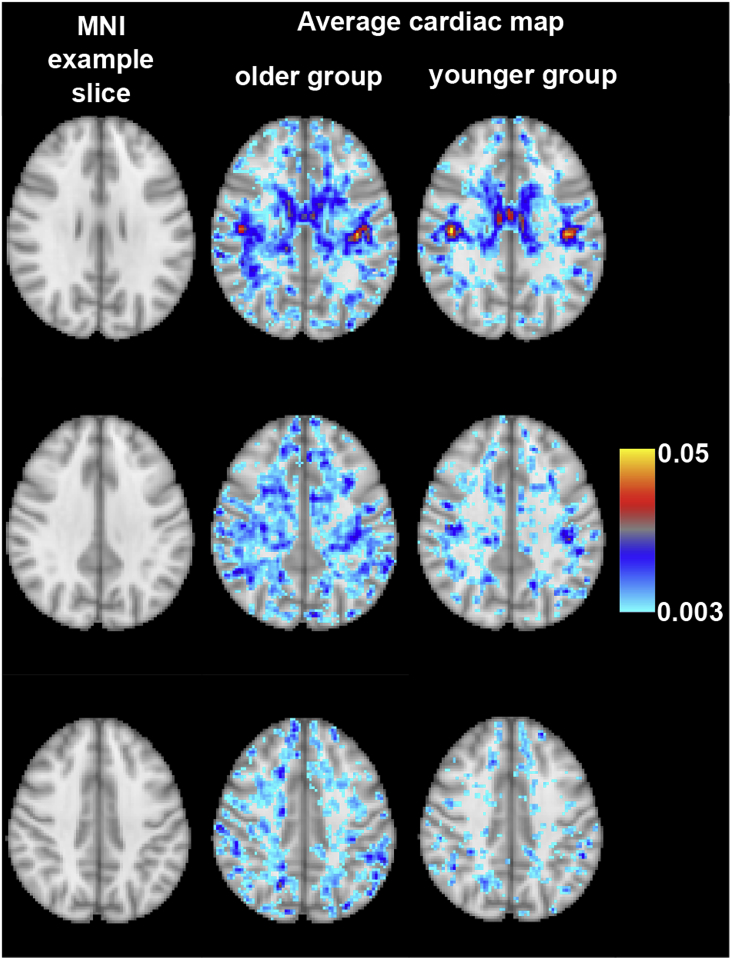
Aging and disease-related changes in the arteriovasculature have been linked to elevated levels of cardiac cycle-induced pulsatility in the cerebral microcirculation. Functional magnetic resonance imaging (fMRI), acquired fast enough to unalias the cardiac frequency contributions, can be used to study these physiological signals in the brain. Here, we propose an iterative dual regression analysis in the frequency domain to model single voxel power spectra of echo planar imaging (EPI) data using external recordings of the cardiac and respiratory cycles as input. We further show that a data-driven variant, without external physiological traces, produces comparable results. We use this framework to map and quantify cardiac and respiratory contributions in healthy aging. We found a significant increase in the spatial extent of cardiac modulated white matter voxels with age, whereas the overall strength of cardiac-related EPI power did not show an age effect.
Keywords: Cardiac pulsatility; Dual regression; EPI; Healthy aging; Physiological noise; fMRI.
Copyright © 2018 The Author(s). Published by Elsevier Inc. All rights reserved.
Figures
Similar articles
-
Simultaneous Multislice Resting-State Functional Magnetic Resonance Imaging at 3 Tesla: Slice-Acceleration-Related Biases in Physiological Effects.Brain Connect. 2018 Mar;8(2):82-93. doi: 10.1089/brain.2017.0491. Epub 2018 Jan 22. Brain Connect. 2018. PMID: 29226689
-
Cardiac cycle-induced EPI time series fluctuations in the brain: Their temporal shifts, inflow effects and T2∗ fluctuations.Neuroimage. 2017 Nov 15;162:93-105. doi: 10.1016/j.neuroimage.2017.08.061. Epub 2017 Aug 31. Neuroimage. 2017. PMID: 28864026 Free PMC article.
-
Rapid whole-brain resting-state fMRI at 3 T: Efficiency-optimized three-dimensional EPI versus repetition time-matched simultaneous-multi-slice EPI.Neuroimage. 2017 Dec;163:81-92. doi: 10.1016/j.neuroimage.2017.08.031. Epub 2017 Sep 18. Neuroimage. 2017. PMID: 28923276
-
Characterizing contrast origins and noise contribution in spin-echo EPI BOLD at 3 T.Magn Reson Imaging. 2019 Apr;57:328-336. doi: 10.1016/j.mri.2018.11.005. Epub 2018 Nov 12. Magn Reson Imaging. 2019. PMID: 30439514
-
Correction of geometric distortion in fMRI data.Neuroimage. 2012 Aug 15;62(2):648-51. doi: 10.1016/j.neuroimage.2011.09.010. Epub 2011 Sep 16. Neuroimage. 2012. PMID: 21945795 Review.
Cited by
-
The effects of age on resting-state BOLD signal variability is explained by cardiovascular and cerebrovascular factors.Psychophysiology. 2021 Jul;58(7):e13714. doi: 10.1111/psyp.13714. Epub 2020 Nov 18. Psychophysiology. 2021. PMID: 33210312 Free PMC article.
-
Multimodal fusion analysis of functional, cerebrovascular and structural neuroimaging in healthy aging subjects.Hum Brain Mapp. 2022 Dec 15;43(18):5490-5508. doi: 10.1002/hbm.26025. Epub 2022 Jul 20. Hum Brain Mapp. 2022. PMID: 35855641 Free PMC article.
-
Static and dynamic BOLD fMRI components along white matter fibre tracts and their dependence on the orientation of the local diffusion tensor axis relative to the B0-field.J Cereb Blood Flow Metab. 2022 Oct;42(10):1905-1919. doi: 10.1177/0271678X221106277. Epub 2022 Jun 1. J Cereb Blood Flow Metab. 2022. PMID: 35650710 Free PMC article.
-
New Insights Into Cerebrovascular Pathophysiology and Hypertension.Stroke. 2022 Apr;53(4):1054-1064. doi: 10.1161/STROKEAHA.121.035850. Epub 2022 Mar 8. Stroke. 2022. PMID: 35255709 Free PMC article. Review.
-
Cortical laminar resting-state signal fluctuations scale with the hypercapnic blood oxygenation level-dependent response.Hum Brain Mapp. 2020 Jun 1;41(8):2014-2027. doi: 10.1002/hbm.24926. Epub 2020 Jan 20. Hum Brain Mapp. 2020. PMID: 31957959 Free PMC article.
References
-
- Beckmann C.F., Mackay C.E., Filippini N., Smith S.M. Group comparison of resting-state fmri data using multi-subject ica and dual regression. Neuroimage. 2009;47(Suppl. 1):S148.
-
- Birn R.M. The role of physiological noise in resting-state functional connectivity. Neuroimage. 2012;62(2):864–870. - PubMed
Publication types
MeSH terms
Grants and funding
LinkOut - more resources
Full Text Sources
Other Literature Sources
Medical
