. 2018 Feb 12;33(2):259-273.e7.
doi: 10.1016/j.ccell.2018.01.001. Epub 2018 Feb 2.

RHOA G17V Induces T Follicular Helper Cell Specification and Promotes Lymphomagenesis

Affiliations

RHOA G17V Induces T Follicular Helper Cell Specification and Promotes Lymphomagenesis

Jose R Cortes et al. Cancer Cell. .

Abstract

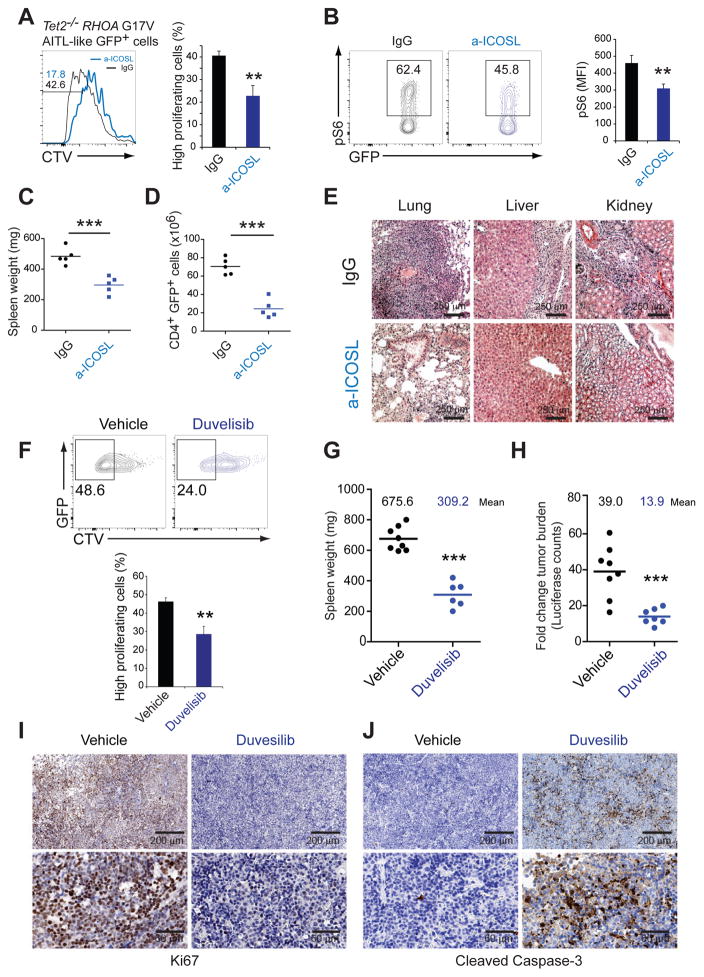
Angioimmunoblastic T cell lymphoma (AITL) is an aggressive tumor derived from malignant transformation of T follicular helper (Tfh) cells. AITL is characterized by loss-of-function mutations in Ten-Eleven Translocation 2 (TET2) epigenetic tumor suppressor and a highly recurrent mutation (p.Gly17Val) in the RHOA small GTPase. Yet, the specific role of RHOA G17V in AITL remains unknown. Expression of Rhoa G17V in CD4+ T cells induces Tfh cell specification; increased proliferation associated with inducible co-stimulator (ICOS) upregulation and increased phosphoinositide 3-kinase (PI3K) and mitogen-activated protein kinase signaling. Moreover, RHOA G17V expression together with Tet2 loss resulted in development of AITL in mice. Importantly, Tet2-/-RHOA G17V tumor proliferation in vivo can be inhibited by ICOS/PI3K-specific blockade, supporting a driving role for ICOS signaling in Tfh cell transformation.

Keywords: ICOS; RHOA G17V; T follicular helper cells; TET2; angioimmunoblastic T cell lymphoma.


Conflict of interest statement

DECLARATION OF INTERESTS

The authors declare no competing interests.

Figures

Figure 1
Figure 1. Rhoa G17V expression induces Tfh differentiation and is associated with upregulation of Tfh associated markers
(A) Representative FACS plot and associated quantification of PD1 and CXCR5 expression in wild-type (WT) or Rhoa G17V-expressing CD4+ T cells from OT-II;Rhoaco-G17V/+;CD4CreERT2 donors treated with vehicle only or 4-hydroxytamoxifen (TMX), transferred into Ly5.1+ C57BL/6 mice and assessed 3 days after immunization of recipients with NP-OVA in alum. (B) Representative FACS plot and associated quantification of PD1 and CXCR5 Tfh cell markers in splenic CD4+ T cells isolated from Rhoaco-G17V/+;CD4CreERT2 (Rhoa G17V) and CD4CreERT2 (WT) mouse lines treated with vehicle alone (control) or tamoxifen in vivo. (C) Representative FACS plot and associated quantification of PD1 and BCL6 Tfh cell markers in splenic CD4+ T cells obtained as described in (B). (D) Representative FACS plot and associated quantification showing expression of Tfh markers PD1 and CXCR5 in CD4+ T cells isolated from Rhoaco-G17V/+; CD4CreERT2 (Rhoa G17V) and CD4CreERT2 control (WT) treated with vehicle only or 4-hydroxytamoxifen (TMX) and cultured under Tfh differentiation conditions. (E) Heat map representation of Tfh-associated marker expression in CD4+ T cells from CD4CreERT2 control and Rhoa co-G17V/+;CD4CreERT2 knockin mice treated with vehicle only or tamoxifen (TMX). (F) Gene Set Enrichment Analysis revealed enrichment in a Tfh signature (Chtanova, 2004) associated with the presence of the Rhoa G17V mutant allele. (G) Heat map representation of the top ranking genes in the leading edge. For gene expression analysis, two independent replicas were analyzed per genotype. Black lines above the heat maps in (E) and (G) indicate the different genotypes. Genes in heat maps are shown in rows, and each individual sample is shown in one column. The scale bar shows color-coded differential expression from the mean in s.d. units, with red indicating higher expression and blue indicating lower expression. For in vivo experiments (panels A–D), the data correspond to two independent experiments (n=3 animals/group). p values were calculated using a two-tailed Student’s t-test. Error bars, mean ± s.d. *p ≤ 0.05, **p ≤ 0.01, *** p ≤ 0.001. See also Figure S1.
Figure 2
Figure 2. Rhoa G17V expression induces ICOS expression and signaling in CD4+ T cells
(A) Representative FACS plot and associated quantification of the expression of ICOS in resting (CD69low) and activated (CD69high) CD4+ T cells from Rhoaco-G17V/+;CD4CreERT2 mice treated with vehicle alone (WT) or tamoxifen (Rhoa G17V) in vivo. (B) Analysis of surface ICOS expression by flow cytometry in Rhoaco-G17V/+;CD4CreERT2 CD4+ T cells treated with vehicle alone (WT) or tamoxifen (Rhoa G17V) after stimulation with increasing doses of anti-CD3 (a-CD3) antibody in the presence of iAPCs. (C) Analysis of ICOS expression in WT and Rhoa G17V-expressing CD4+ T cells following full stimulation with anti-CD3 and anti-CD28 antibodies. (D–G) WT and Rhoa G17V-expressing CD4+ T cells were pretreated with anti-CD3 plus anti-CD28 antibodies and the following analyses were performed after in vitro re-stimulation with anti-CD3 and anti-ICOS (a-ICOS) antibodies: ERK1/2 and AKT phosphorylation [Mean Fluorescence Intensity (MFI) values for WT (in black) and RhoaG17V-expressing cells (red) are indicated] (D); S6 ribosomal protein phosphorylation (E); Cell Trace Violet (CTV) cell proliferation analysis (F), and quantification of pro-inflammatory cytokines from conditioned media (G). p value in (A) was calculated with two-tailed Student’s t-test from using n=3 animals/group from two independent experiments. p values in (B) and (G) were calculated with two-tailed Student’s t-test from triplicates samples from three independent experiments. Error bars, mean ± s.d. *p ≤ 0.05, **p ≤ 0.01, ***p ≤ 0.001.
Figure 3
Figure 3. Rhoa G17V expression increases CD4+ T cell proliferation
(A) In vitro Cell Trace Violet (CTV) proliferation assay of CD4+ T cells isolated from Rhoaco-G17V/+;CD4CreERT2 mice, treated with vehicle alone (WT) or tamoxifen (Rhoa G17V) and stimulated with anti-CD3 (a-CD3) plus anti-CD28 (a-CD28) antibodies, or with anti-CD3 in the presence of iAPCs. (B) CD25 cell surface expression -measured by mean fluorescent intensity (MFI)- in WT and Rhoa G17V-expressing CD4+ T cells stimulated with increasing doses of anti-CD3 in the presence of iAPCs. (C) In vivo CTV proliferation flow cytometry analysis of WT and Rhoa G17V-expressing CD4+ T cells obtained from Ly5.1+ C57BL/6 mice transferred with CD4+ cells from OT-II;Rhoaco-G17V/+;CD4CreERT2 mice and assessed 3 days after immunization of recipients with NP-OVA in alum. Histograms are representative of two independent experiments (n=3). p values were calculated using a two-tailed Student’s t-test. Error bars, mean ± s.d. *p ≤ 0.05, **p ≤ 0.01. See also Figure S2.
Figure 4
Figure 4. RHOA G17V expression in Tet2−/− hematopoietic progenitors induces AITL–like lymphomas in mice
(A) Kaplan-Meier survival curve of mice transplanted with Tet2−/− bone marrow progenitors infected with retroviruses expressing HA-RHOA G17V plus GFP. (B) Histological micrographs of representative lymph node and spleen tissues obtained from diseased mice transplanted with Tet2−/− hematopoietic progenitors infected with retroviruses expressing HA-RHOA G17V plus GFP. Images are depicted at two different magnifications as indicated by scale bars. (C) Representative FACS plot showing CD4 expression in Tet2−/− RHOA G17V-expressing GFP+ spleen tumor cells. The percent of CD4+ GFP+ cells is indicated in the upper quadrant (D) Flow cytometry analysis of the expression of CXCR5, PD1, BCL6 and ICOS Tfh cell markers gated in the CD4+GFP+ spleen tumor cells from (C). (E) Tcrb gene clonal analysis in three independent Tet2−/− RHOA G17V-expressing GFP+ tumors. Sectors represent the percentage of reads corresponding to individual Tcrb sequences. (F). GSEA analysis of differentially expressed genes associated with Tet2−/− RHOA G17V-expressing GFP+ mouse tumors. AITL geneset: top differentially upregulated genes in AITL compared with PTCL not otherwise specified (PTCL, NOS) (fold change 1.5, p <0.002) (de Leval et al., 2007). Tfh geneset: top 100 genes associated with Tfh cells (Chtanova et al., 2004). Data set: upregulated genes in Tet2−/− RHOA G17V AITL-like lymphomas compared with T-ALL. Enrichment plots and heat map representation of top 25 ranking genes in the leading edge are shown. Genes in heat maps are shown in rows, and each individual sample is shown in one column. The scale bar shows color-coded differential expression from the mean in s.d. units, with red indicating higher expression and blue indicating lower expression. Images are shown at two different magnifications as indicated by scale bars. See also Figures S3, S4 and S5.
Figure 5
Figure 5. CD4 T cell specific expression of Rhoa G17V induces Tfh differentiation and cooperates with Tet2 loss in the generation of AITL–like lymphomas in mice
(A) Analysis of CXCR5+ CD4+ T cells in peripheral blood of mice transplanted with bone marrow cells from Rhoaco-G17V/+;Tet2f/f;CD4CreERT2 mice and treated with vehicle (n=10) or tamoxifen (TMX) (n=10). (B) Kaplan-Meier survival curve of animals transplanted with bone marrow progenitor cells from Rhoaco-G17V/+;Tet2f/f;CD4CreERT2 mice treated with vehicle only or tamoxifen (n=10 mice per group). Tamoxifen administration and serial sheep red blood cells (SRBC) immunizations are indicated by arrows in the timeline (red: tamoxifen; black: SRBC). (C) Flow cytometry analysis of Tfh cell markers in spleen and bone marrow cells from diseased tamoxifen-treated mice: CXCR5, PD1 FACS plot (upper panel), BCL6 and ICOS histograms (lower panel). (D) Pie chart representation of the results of Tcr Vβ clonality analysis by flow cytometry on spleen samples from diseased tamoxifen-treated animals. Three representative tumors are depicted. (E) Histological micrographs of representative lymph node and spleen tissues obtained from diseased tamoxifen-treated mice (F) Immunohistochemical analysis of the expression of CD4, PD1, PAX5, B220, CD21 and CD31 in spleen sections from tamoxifen-treated tumor affected mice. p values were calculated with two-tailed Student’s t-test. ***p ≤ 0.001.
Figure 6
Figure 6. Tet2−/− RHOA G17V-expressing GFP+ mouse tumor cells proliferate in TCR-independent way
(A) Histograms corresponding to flow cytometry in vitro proliferation analysis using CTV staining in Tet2−/− RHOA G17V and control CD4+ T cells under basal conditions and upon stimulation with increasing doses of anti-CD3 antibody and iAPCs. (B) Flow cytometry analysis of the expression of surface CD3 and TCRA/B in Tet2−/− RHOA G17V tumor cells from secondary AITL recipient mice. (C) Flow cytometry in vivo proliferation analysis of CTV-stained Tet2−/− RHOA G17V GFP+ tumor cells and control CD4+ T cells isolated from spleen 4 days after their injection in non-immunized mice. See also Figure S6.
Figure 7
Figure 7. ICOS induces activation of MAPK and PI3K pathways in Tet2−/− RHOA G17V-expressing GFP+ tumor cells
(A) Flow cytometry analysis of MAPK (pERK1/2) and PI3K (pAKT and pS6) signaling in Tet2−/− RHOA G17V-expressing GFP+ spleen tumor cells compared to CD4+ T cell controls. (B) Flow cytometry analysis of S6, ERK1/2 and AKT phosphorylation in Tet2−/− RHOA G17V-expressing GFP+ CD4+ tumor cells following stimulation with antibodies against CD3, CD28 and ICOS or an isotype antibody control (IgG and shadow histograms). Data are representative of at least three independent experiments.
Figure 8
Figure 8. ICOS-PI3K signaling is critical for cell proliferation in Tet2−/− RHOA G17V AITL-like mouse lymphomas
(A) Representative histogram and associated quantification of in vivo CTV proliferation analysis by flow cytometry of Tet2−/− RHOA G17V-expressing GFP+ spleen tumor cells isolated from transplanted recipient mice 4 days after treatment with an anti-ICOSL blocking antibody or an IgG isotype control (n=3). (B) Representative plot and associated quantification of in vivo S6 phosphorylation measured by flow cytometry in Tet2−/− RHOA G17V-expressing GFP+ spleen tumor cells isolated from transplanted recipient mice 4 days after treatment with an anti-ICOSL blocking antibody or an IgG isotype control (n=3). (C) Quantification of spleen weight in a cohort of mice transplanted with Tet2−/− RHOA G17V-expressing GFP+ tumors 15 days after treatment with an anti-ICOSL blocking antibody (n=5) or an IgG isotype control (n=5). Each symbol represents an individual mouse. Horizontal bars indicate mean values. (D) Quantification of tumor load (CD4+GFP+ cells) in spleen from mice transplanted with Tet2−/− RHOA G17V-expressing GFP+ tumors 15 days after treatment with an anti-ICOSL blocking antibody (n=5) or an IgG isotype control (n=5). (E) Representative histological micrographs of formalin-fixed, hematoxylin-eosin stained lung, liver and kidney sections obtained from Tet2−/− RHOA G17V-expressing GFP+ tumor-bearing mice treated with an anti-ICOSL blocking antibody or IgG1 isotype control. (F) Representative flow cytometry plot and associated quantification of CTV in vivo proliferation analysis of Tet2−/− RHOA G17V tumor cells isolated from spleens from transplanted recipient mice 4 days after tumor injection and after treatment with vehicle only or duvelisib (50 mg kg−1) (n=3). (G) Quantification of spleen weight in mice transplanted with Tet2−/− RHOA G17V-expressing GFP+ LUC+ tumor cells after treatment with vehicle only or duvelisib (100 mg kg−1) (n=10). (H) Quantitative luminescence analysis of tumor burden performed in mice from (G). The effect of the drug was assessed 21 days after tumor injection. (I and J) Representative immunohistochemistry images showing expression of the proliferation marker Ki67 (I) and cleaved caspase-3 (J) in formalin-fixed spleen sections from Tet2−/− RHOA G17V tumor-bearing mice treated with vehicle only or duvelisib (100 mg kg−1) for 21 days. Scale bars values are indicated. Data in A, B, C and D are representative of at least three independent experiments. n indicates the number of animals per group used in each experimental setting. p values were calculated using a two-tailed Student’s t-test. Error bars, mean ± s.d. **p ≤ 0.01, ***p ≤ 0.001. See also Figure S7.

References

    1. Aghajani K, Keerthivasan S, Yu Y, Gounari F. Generation of CD4CreER(T(2)) transgenic mice to study development of peripheral CD4-T cells. Genesis. 2012;50:908–913. - PMC - PubMed
    1. Aicher A, Hayden-Ledbetter M, Brady WA, Pezzutto A, Richter G, Magaletti D, Buckwalter S, Ledbetter JA, Clark EA. Characterization of human inducible costimulator ligand expression and function. J Immunol. 2000;164:4689–4696. - PubMed
    1. Borroto A, Gil D, Delgado P, Vicente-Manzanares M, Alcover A, Sanchez-Madrid F, Alarcon B. Rho regulates T cell receptor ITAM-induced lymphocyte spreading in an integrin-independent manner. Eur J Immunol. 2000;30:3403–3410. - PubMed
    1. Boulter E, Estrach S, Garcia-Mata R, Feral CC. Off the beaten paths: alternative and crosstalk regulation of Rho GTPases. FASEB J. 2012;26:469–479. - PubMed
    1. Burmeister Y, Lischke T, Dahler AC, Mages HW, Lam KP, Coyle AJ, Kroczek RA, Hutloff A. ICOS controls the pool size of effector-memory and regulatory T cells. J Immunol. 2008;180:774–782. - PubMed

Publication types

MeSH terms