. 2018 Mar:9:141-155.
doi: 10.1016/j.molmet.2018.01.013. Epub 2018 Feb 2.

Insulin-like growth factor receptor signaling regulates working memory, mitochondrial metabolism, and amyloid-β uptake in astrocytes

Affiliations

Insulin-like growth factor receptor signaling regulates working memory, mitochondrial metabolism, and amyloid-β uptake in astrocytes

Sreemathi Logan et al. Mol Metab. 2018 Mar.

Abstract

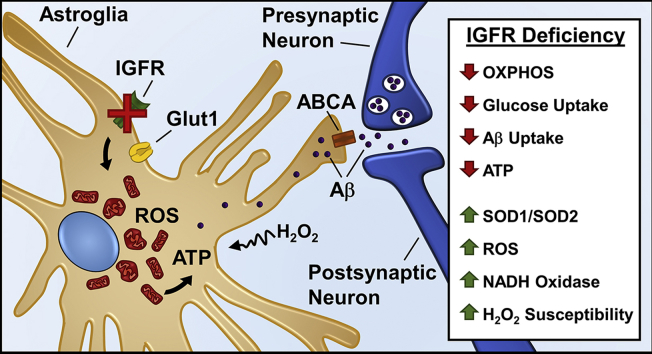
Objective: A decline in mitochondrial function and biogenesis as well as increased reactive oxygen species (ROS) are important determinants of aging. With advancing age, there is a concomitant reduction in circulating levels of insulin-like growth factor-1 (IGF-1) that is closely associated with neuronal aging and neurodegeneration. In this study, we investigated the effect of the decline in IGF-1 signaling with age on astrocyte mitochondrial metabolism and astrocyte function and its association with learning and memory.

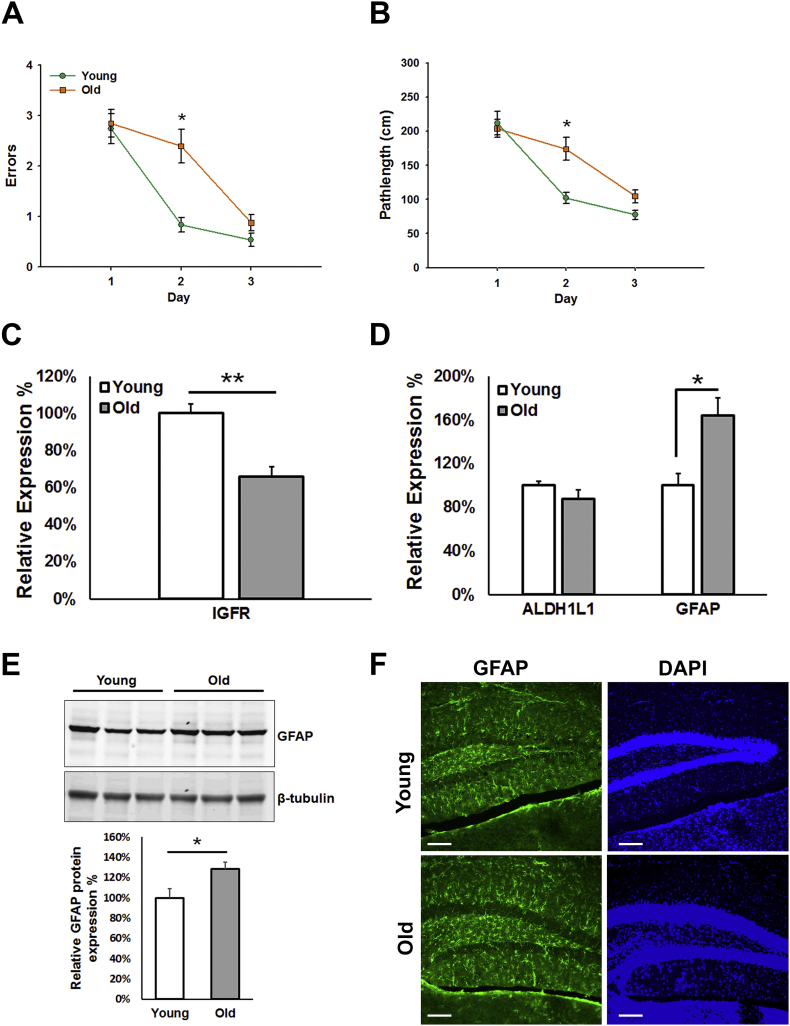
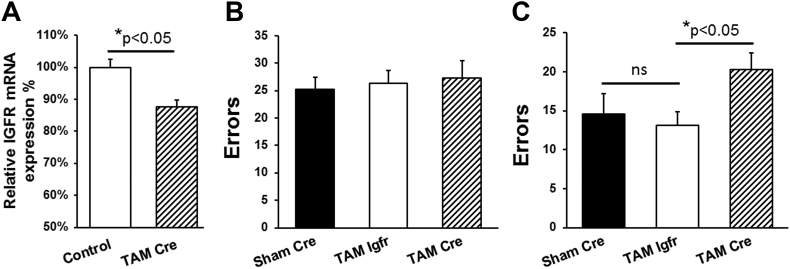
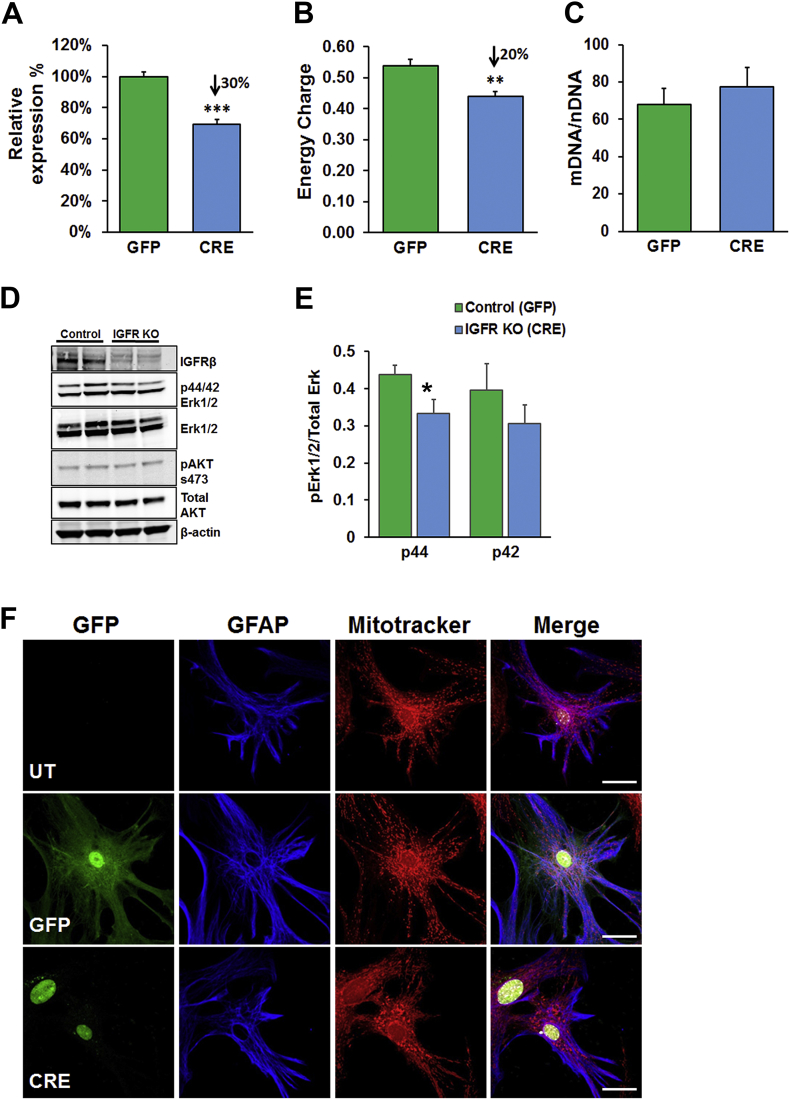
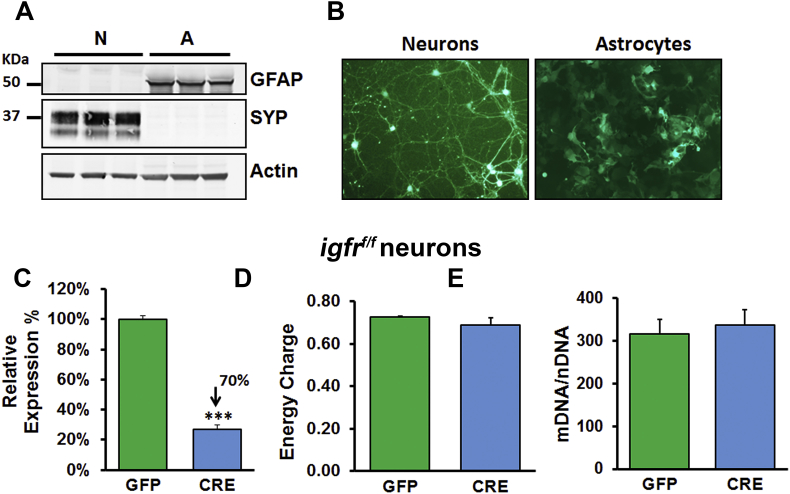
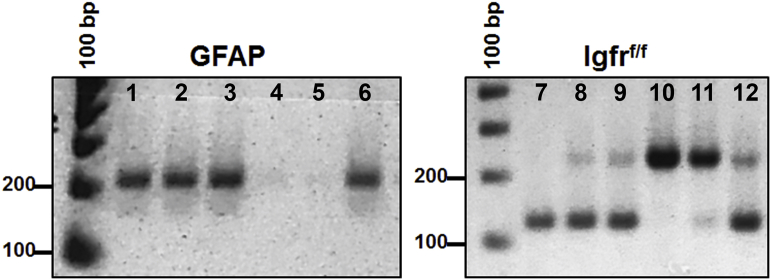
Methods: Learning and memory was assessed using the radial arm water maze in young and old mice as well as tamoxifen-inducible astrocyte-specific knockout of IGFR (GFAP-CreTAM/igfrf/f). The impact of IGF-1 signaling on mitochondrial function was evaluated using primary astrocyte cultures from igfrf/f mice using AAV-Cre mediated knockdown using Oroboros respirometry and Seahorse assays.

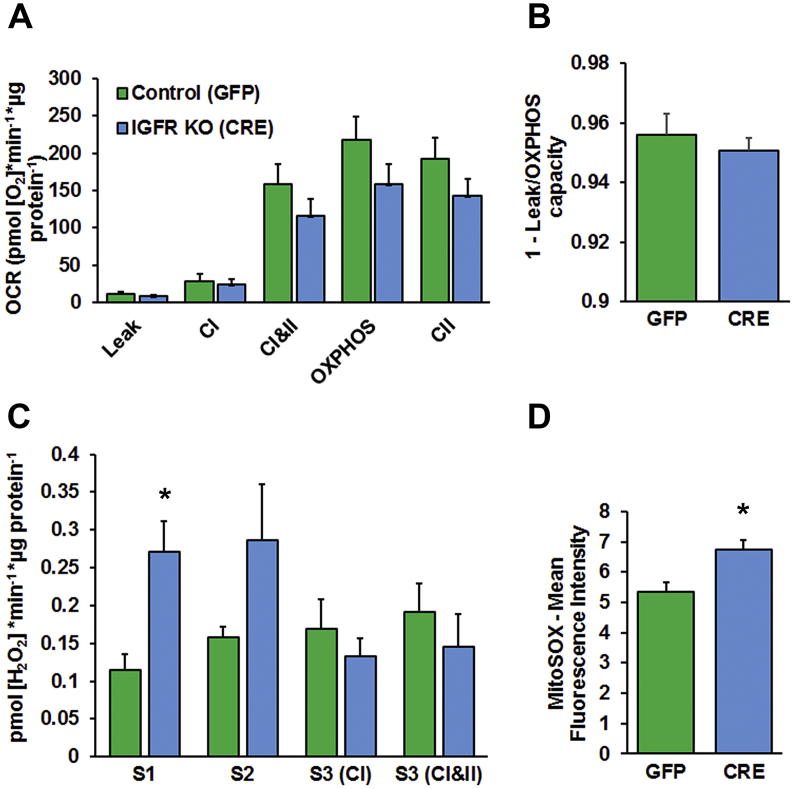
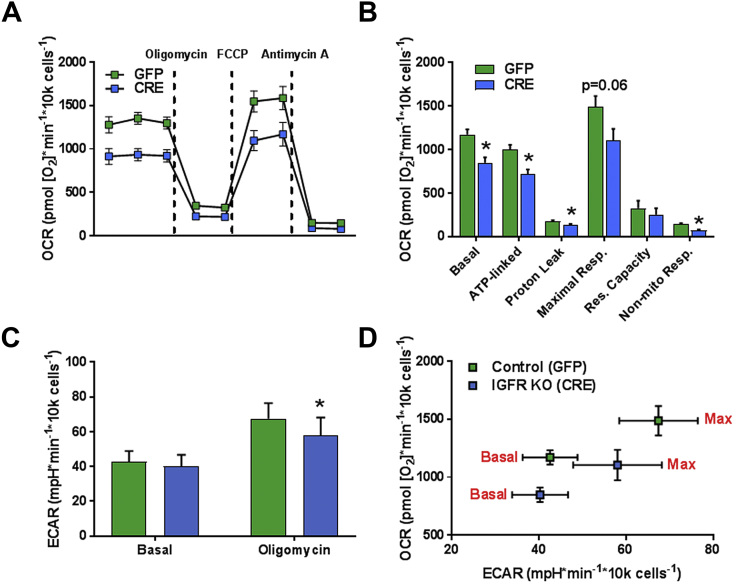
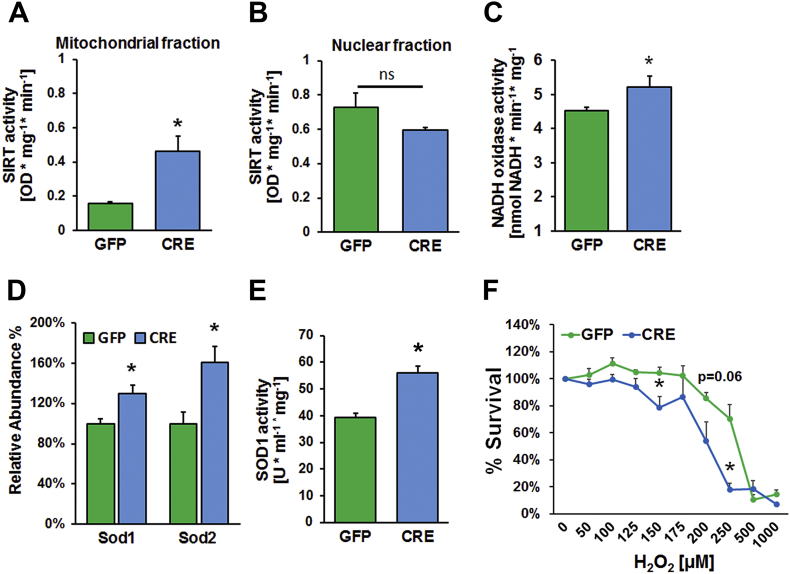
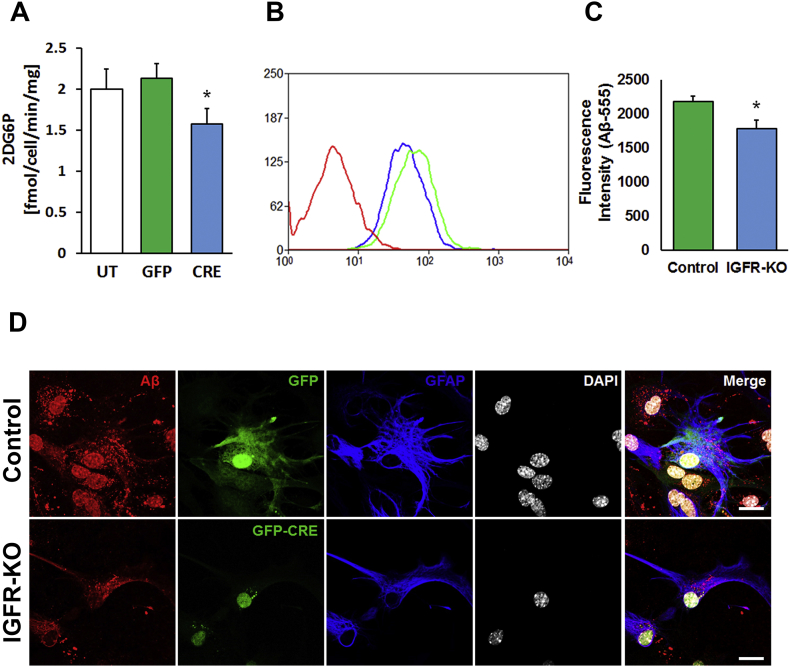
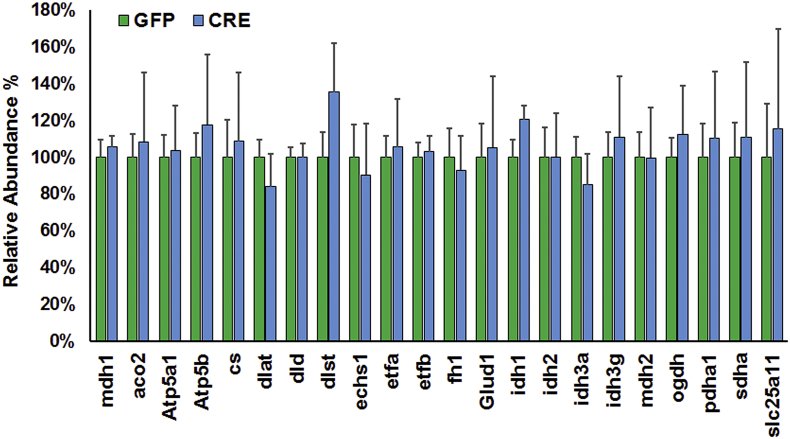
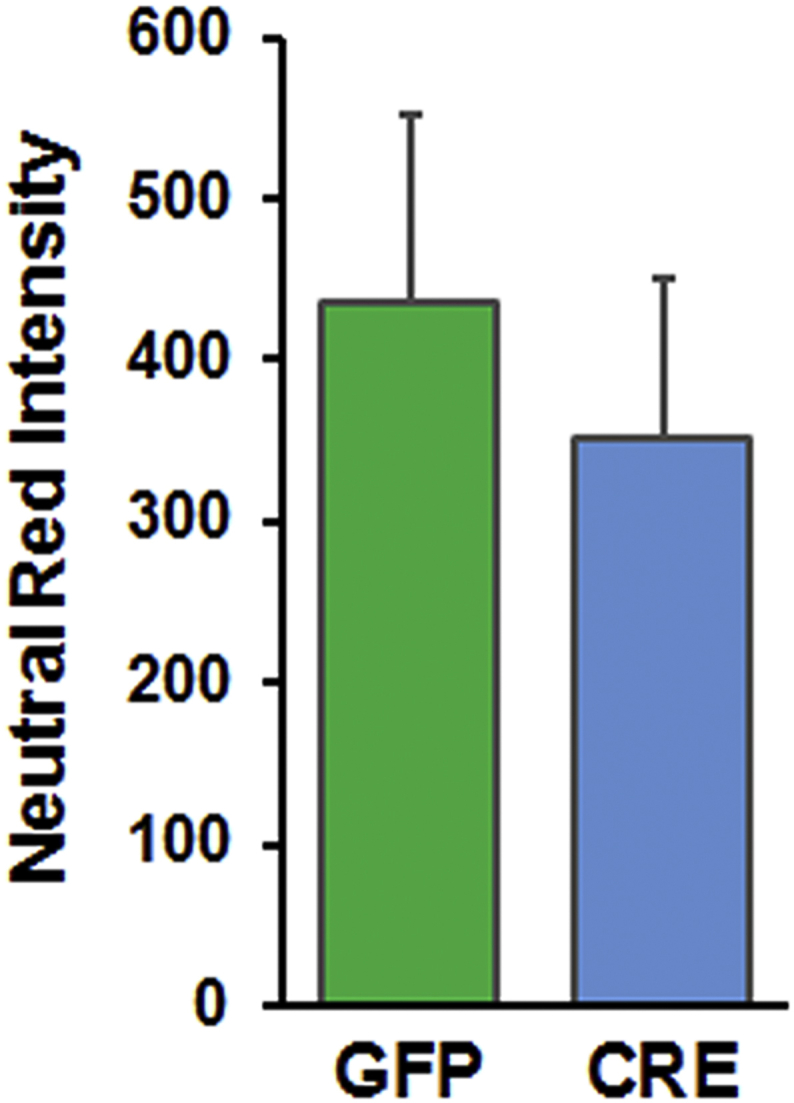
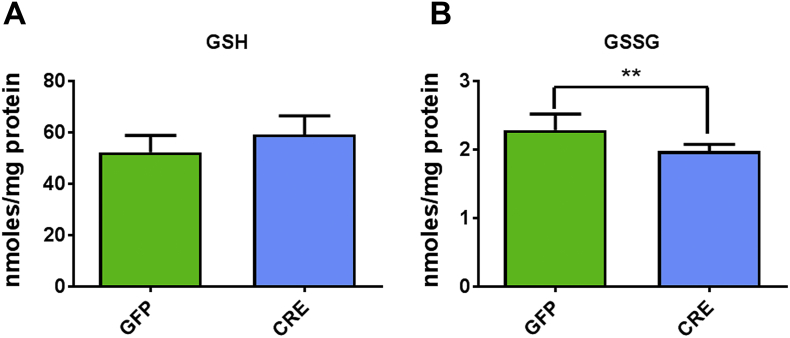
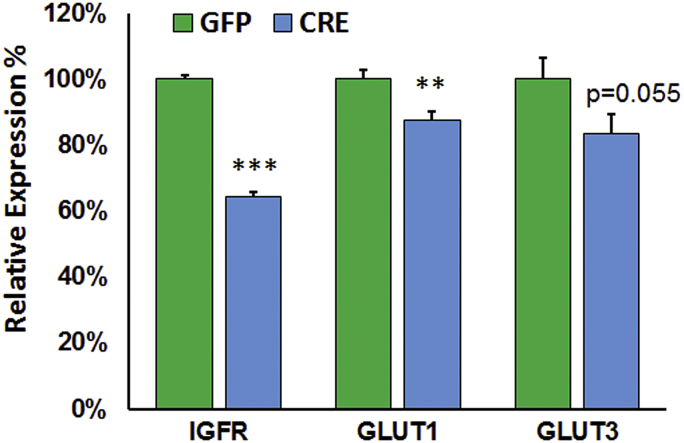
Results: Our results indicate that a reduction in IGF-1 receptor (IGFR) expression with age is associated with decline in hippocampal-dependent learning and increased gliosis. Astrocyte-specific knockout of IGFR also induced impairments in working memory. Using primary astrocyte cultures, we show that reducing IGF-1 signaling via a 30-50% reduction IGFR expression, comparable to the physiological changes in IGF-1 that occur with age, significantly impaired ATP synthesis. IGFR deficient astrocytes also displayed altered mitochondrial structure and function and increased mitochondrial ROS production associated with the induction of an antioxidant response. However, IGFR deficient astrocytes were more sensitive to H2O2-induced cytotoxicity. Moreover, IGFR deficient astrocytes also showed significantly impaired glucose and Aβ uptake, both critical functions of astrocytes in the brain.

Conclusions: Regulation of astrocytic mitochondrial function and redox status by IGF-1 is essential to maintain astrocytic function and coordinate hippocampal-dependent spatial learning. Age-related astrocytic dysfunction caused by diminished IGF-1 signaling may contribute to the pathogenesis of Alzheimer's disease and other age-associated cognitive pathologies.

Keywords: Alzheimer's disease; Amyloid; IGF-1; Mitochondria; Primary astrocytes; ROS.


Figures

None
Graphical abstract
Figure 1
Figure 1
Age-dependent impairment in learning is associated with decreased hippocampal IGFR expression and gliosis. C57Bl/6 young (4–6 m) and old (22–24 m) mice were tested on the radial arm water maze for spatial learning (n = 10/group). Old mice showed significantly more errors (A) and pathlength (B) to target and display a shallow learning curve compared to young mice. Hippocampal IGFR (C) expression was significantly decreased, while gliosis marker, GFAP, was significantly increased (D) in old mice compared to young. Increase in GFAP protein expression is validated via western blotting (E; n = 6/group) as well as by immunohistochemistry (n = 3/group) in young and old mice. Scale bar = 100 μm. Data are represented as the Mean ± SEM. *P < 0.05.
Figure 2
Figure 2
Astrocyte-specific knockout of IGFR impairs working memory. (A) IGFR-KO (TAM-Cre) mice showed 10–15% less expression of total hippocampal levels of IGFR compared to controls (Sham-Cre and TAM-Igfr). (B) Mice tested in the RAWM (4 trials/60 s each) showed no difference in spatial learning between the groups on day 1 for the number of errors. (C) Tamoxifen-induced astrocyte-specific IGFR knockout (TAM-Cre) mice showed significantly increased number of errors to find the platform compared to controls (Sham-Cre and TAM-Igfr littermates). Data are represented as the mean ± SEM; *P < 0.05; TAM-Cre (n = 11); TAM-Igfr (n = 10); Sham-Cre (n = 6).
Figure 3
Figure 3
IGFR signaling deficiency modulates mitochondrial energy charge in astrocytes in complete growth media. Knockout of IGF-1R in astrocytes (A–C) showed 30% reduction in mRNA levels (A), ∼20% reduction in energy charge (B) with no significant change in mitochondrial DNA/nuclear DNA ratio (C) in the overall population. (D) Representative western blots for IGFRβ and ERK showing reduction IGFR in the knockout and reduced p44 ERK levels quantified in (E), while no differences were found in AKT phosphorylation. Data were analyzed by two-tailed student T-test; Mean ± SEM; n = 5 per group. (F) Representative confocal images of untransduced (UT; top panel), GFP-transduced (GFP; middle panel) and IGF-1R knockout (CRE; bottom panel) astrocytes labeled for GFAP (blue) and Mitotracker (Red) showing a vesicular perinuclear mitochondrial localization in the knockout. Scale bar = 20 μm; n = 3/group.
Figure 4
Figure 4
IGFR knockout in astrocytes impairs mitochondrial respiration and increases ROS production. Knockout of IGFR (CRE) in cultured astrocytes show a trend towards (A) decreased oxygen consumption rate and (B) mitochondrial OXPHOS coupling efficiency in isolated mitochondria as measured by Oroboros respirometry. Leak respiration was measured with substrates in the absence of ADP, while OXPHOS capacity was measured with substrates for complex I & II, ADP, and cytochrome C. IGFR knockout astrocytes also exhibit: (C) a significant increase in mitochondrial State 1 (S1) ROS without exogenous substrates or ADP, while ROS in State 2 (S2), or Leak, respiration is increased but not statistically significant. (D) In a live cell assay, IGFR knockout astrocytes show increased MitoSOX fluorescent intensity measured by flow cytometry. Data are the Mean ± SEM; n = 6/group; *P < 0.05. A–C are expressed as levels per μg of mitochondrial protein (from isolated mitochondria).
Figure 5
Figure 5
IGFR knockout in astrocytes increases maximal respiration by Seahorse. (A) Knockout of IGFR (CRE) in astrocytes significantly decreased oxygen consumption. (B) OCR was reduced significantly in several stages of respiration in IGFR knockout (CRE) astrocytes including, basal, ATP-linked, proton-leak and non-mitochondrial respiration. Maximal respiration was reduced but not significantly. (C) Oligomycin-induced extracellular acidification (ECAR) was significantly decreased in IGFR-KO, while basal ECAR was not different between groups. (D) Basal and maximal OCR to ECAR ratio depicts lower induction of response with FCCP in CRE astrocytes compared to control. Data are represented as the Mean ± SEM (n = 7/group), *P < 0.05.
Figure 6
Figure 6
IGFR knockout in astrocytes increases antioxidant response but increases susceptibility to oxidant stress. (A) Sirtuin activity was significantly increased in the mitochondrial fraction while it trended lower in the nuclear fraction (B) in IGFR-KO astrocytes. (C) NADH oxidase activity was increased in IGFR-KO astrocytes as well as an increase in anti-oxidant protein expression: (D) SOD abundance (by Mass Spectrometry), and (E) SOD1 activity were also significantly increased in IGFR-KO lysates compared to controls. (F) Peroxide-induced cytotoxicity was significantly greater at 150 μM and 250 μM H2O2 in IGFR-KO astrocytes compared to controls with a trending decline at 200 μM. Data are represented as the mean ± SEM; *P < 0.05; **P < 0.01; n = 6/group; ns = not significant.
Figure 7
Figure 7
IGFR knockout in astrocytes decreases glucose and Aβ uptake. (A) Astroyctes were treated with 1 mM of 2D-glucose (2DG) and accumulation of 2DG6P was measured using luminescence. IGFR-KO astrocytes were significantly impaired in glucose uptake compared to GFP and un-transduced (UT) controls. (B) Flow cytometry for Aβ1−42-555 uptake showed reduced total fluorescence intensity in IGFR-KO (CRE) culture compared to GFP control culture. Unstained astrocytes were used for forward and side scatter gating. (C) Geometric mean of the fluorescence intensity of 555 in GFP + cells was also significantly reduced in IGFR-KO astrocytes compared to controls. (D) Representative confocal images of astrocytes (n = 4/group) treated with Aβ1−42-555 show reduced uptake of Aβ1−42 in IGFR-KO astrocytes (Lower panel) compared to GFP controls (Upper panel). GFP fluorescence represents endogenous expression of viral transduction while staining for GFAP was performed by immunocytochemistry. Scale bar = 20 μm; n = 5/group Data (A–C) are represented as the mean ± SEM; *P < 0.05; n = 5/group.
Figure 8
Figure 8
Model summarizing effects of IGFR signaling deficiency in astrocytes. IGFR knockout in astrocytes alters mitochondrial structure, decreases oxygen consumption, induces antioxidant response, increases ROS production and susceptibility to oxidant stress. Decreased ATP with IGFR signaling deficiency can reduce ABC transporter (ABCA) function thereby impairing Aβ uptake and clearance by astrocytes. Neuronal activity-dependent Aβ release can thereby increase synaptic toxicity and loss of synapses with age and in neurodegenerative diseases such as Alzheimer's disease.
Figure S1
Figure S1
(A) Western blotting for Synaptophysin (SYP) and GFAP markers showing purity of primary neuronal (<10% astrocytes) and astrocyte (no visible neuronal contamination) cultures, respectively. (B) Photomicrograph of neurons (left) and astrocytes (right) transduced with AAV9-CMV-GFP. (C) Neurons with IGFR knockout (∼70% reduction in mRNA expression) showed no significant changes in mitochondrial energy charge (D) or mtDNA copy numbers (E). Data were analyzed by two-tailed student T-test; mean ± SEM; n = 5 per group.
Figure S2
Figure S2
Abundance of enzymes in mitochondrial metabolism. Levels of some enzymes were increased in abundance in IGFR-KO compared to controls. However, there was no statistical significance between groups for the enzymes measured in this panel by Mass spectrometry. Data (mean ± SEM) are presented as abundance (%) relative to GFP (controls); n = 6/group. Abbreviations for proteins in this panel are identified in Supplementary Table 1.
Figure S3
Figure S3
Neutral red staining of astrocytes 5 days post viral transduction showing comparable cell numbers in both groups. Neutral red staining was performed for 2 h and the intensity of dye incorporated within live cells measured spectrophotometrically using ex 530 nm and em 645 nm.
Figure S4
Figure S4
Oxidized glutathione levels are reduced with IGFR-KO in astrocytes. (A) Levels of reduced (GSH) were not different between groups but (B) oxidized (GSSG) glutathione levels were significantly reduced in IGFR-KO (CRE) astrocytes. Data are represented as the mean ± SEM; (n = 5/group); *P < 0.05; **P < 0.01.
Figure S5
Figure S5
Glucose transporter expression is reduced with IGFR-KO in astrocytes. Message levels of Glut1 glucose transporter was significantly reduced by ∼13% with IGFR-KO (∼40% knockout). Glut3 levels were also reduced but not statistically significant. Data are represented as the mean ± SEM; (n = 5/group); **P < 0.01, ***P < 0.001.
Figure S6
Figure S6
Genotyping for GFAP-Cre/Igfrf/f. PCR and agarose separation of 200 bp product for the GFAP-Cre (lanes 1–6) transgene identifying mice that are positive (lanes 1–3 and 6) or mice that lack the transgene (lanes 4–5). PCR identification of Igfrf/f mice (lanes 7–12) show a 220 bp homozygous-floxed band and a 124 bp product for the wild-type band for Igfrf/f mice. Mice homozygous for the floxed gene (lanes 10–11) were used for further breeding with GFAP-Cre/Igfrf/f to generate experimental colonies. Lanes 1–12 indicate individual mice and a 100 bp DNA ladder was used to identify band sizes.

References

    1. Poon H.F., Calabrese V., Scapagnini G., Butterfield D.A. Free radicals and brain aging. Clinics in Geriatric Medicine. 2004;20(2):329–359. - PubMed
    1. Poon H.F., Calabrese V., Scapagnini G., Butterfield D.A. Free radicals: key to brain aging and heme oxygenase as a cellular response to oxidative stress. The Journal of Gerontology. Series A, Biological Sciences and Medical Sciences. 2004;59(5):478–493. - PubMed
    1. Vancova O., Baciak L., Kasparova S., Kucharska J., Palacios H.H., Horecky J. In vivo and in vitro assessment of brain bioenergetics in aging rats. Journal of Cellular and Molecular Medicine. 2010;14(11):2667–2674. - PMC - PubMed
    1. Parihar M.S., Brewer G.J. Simultaneous age-related depolarization of mitochondrial membrane potential and increased mitochondrial reactive oxygen species production correlate with age-related glutamate excitotoxicity in rat hippocampal neurons. Journal of Neuroscience Research. 2007;85(5):1018–1032. - PubMed
    1. Parihar M.S., Kunz E.A., Brewer G.J. Age-related decreases in NAD(P)H and glutathione cause redox declines before ATP loss during glutamate treatment of hippocampal neurons. Journal of Neuroscience Research. 2008;86(10):2339–2352. - PubMed

Publication types