

Critical review of the impacts of grazing intensity on soil organic carbon storage and other soil quality indicators in extensively managed grasslands
- PMID: 29398743
- PMCID: PMC5727677
- DOI: 10.1016/j.agee.2017.10.023
Critical review of the impacts of grazing intensity on soil organic carbon storage and other soil quality indicators in extensively managed grasslands
Abstract
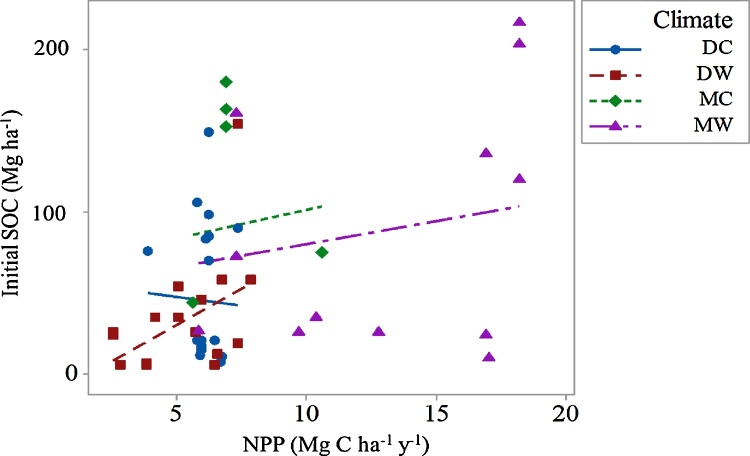
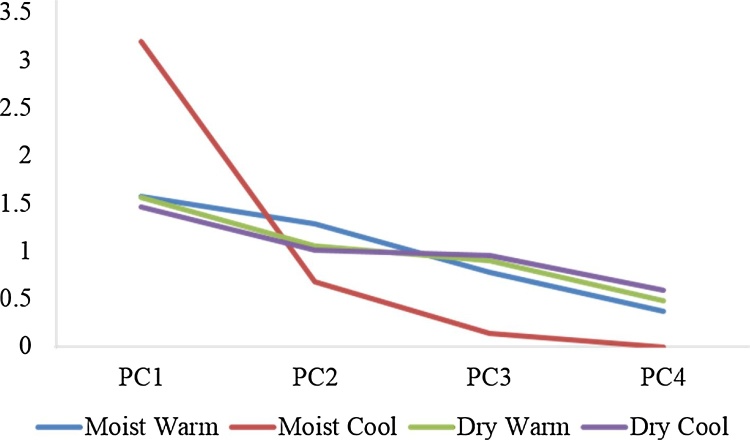
Livestock grazing intensity (GI) is thought to have a major impact on soil organic carbon (SOC) storage and soil quality indicators in grassland agroecosystems. To critically investigate this, we conducted a global review and meta-analysis of 83 studies of extensive grazing, covering 164 sites across different countries and climatic zones. Unlike previous published reviews we normalized the SOC and total nitrogen (TN) data to a 30 cm depth to be compatible with IPCC guidelines. We also calculated a normalized GI and divided the data into four main groups depending on the regional climate (dry warm, DW; dry cool, DC; moist warm, MW; moist cool, MC). Our results show that taken across all climatic zones and GIs, grazing (below the carrying capacity of the systems) results in a decrease in SOC storage, although its impact on SOC is climate-dependent. When assessed for different regional climates, all GI levels increased SOC stocks under the MW climate (+7.6%) whilst there were reductions under the MC climate (-19%). Under the DW and DC climates, only the low (+5.8%) and low to medium (+16.1%) grazing intensities, respectively, were associated with increased SOC stocks. High GI significantly increased SOC for C4-dominated grassland compared to C3-dominated grassland and C3-C4 mixed grasslands. It was also associated with significant increases in TN and bulk density but had no effect on soil pH. To protect grassland soils from degradation, we recommend that GI and management practices should be optimized according to climate region and grassland type (C3, C4 or C3-C4 mixed).
Keywords: Grassland; Grazing; Grazing intensity; Soil organic carbon; Total nitrogen.
Figures


References
-
- Abril A., Bucher E.H. The effects of overgrazing on soil microbial community and fertility in the Chaco dry savannas of Argentina. Appl. Soil Ecol. 1999;12:159–167.
-
- Allard V., Soussana J.-F., Falcimagne R., Berbigier P., Bonnefond J.M., Ceschia E., D’hour P., Henault C., Laville P., Martin C., Pinares-Patino C. The role of grazing management for the net biome productivity and greenhouse gas budget (CO2, N2O, and CH4) of semi-natural grassland. Agric. Ecosyst. Environ. 2007;121:47–58.
-
- Altesor A.I., Pineiro G., Lezama F., Jackson R.B., Sarasola M., Paruelo J.M. Ecosystem changes associated with grazing in sub-humid grasslands of South America. J. Veg. Sci. 2006;17:323–332.
-
- Angassa A. Effects of grazing intensity and bush encroachment on herbaceous specie and rangeland condition in southern Ethiopia. Land Degrad. Dev. 2014;25:438–451.
-
- Asgharnezhad L., Akbarlou M., Karkaj E.S. Influences of grazing and enclosure on carbon sequestration Puccenilia distans (Jacq.) Parl. and soil carbon sequestration (case study: Gomishan wetlands) Int. J. Agron. Plant Prod. 2013;4:1936–1941.
Publication types
Grants and funding
LinkOut - more resources
Full Text Sources
Other Literature Sources
Miscellaneous