. 2017 Nov 20;7(3):e1393598.
doi: 10.1080/2162402X.2017.1393598. eCollection 2018.

CCL3 augments tumor rejection and enhances CD8+ T cell infiltration through NK and CD103+ dendritic cell recruitment via IFNγ

Affiliations

CCL3 augments tumor rejection and enhances CD8+ T cell infiltration through NK and CD103+ dendritic cell recruitment via IFNγ

Frederick Allen et al. Oncoimmunology. .

Abstract

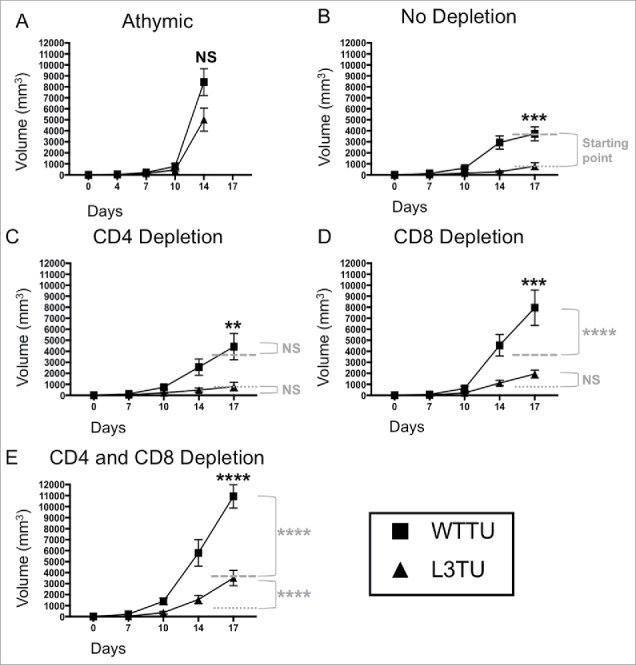
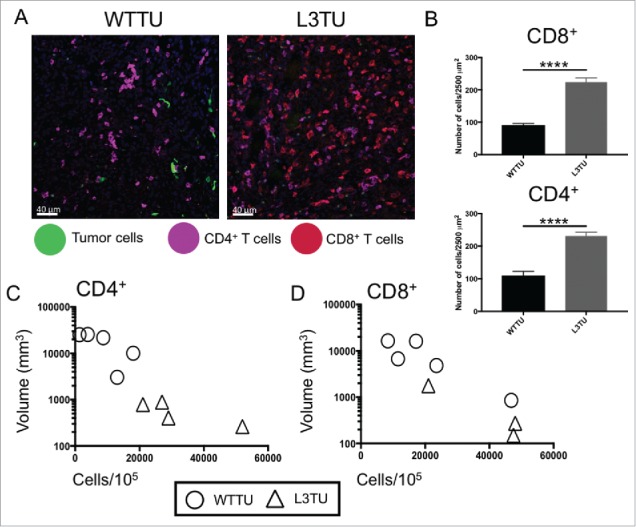
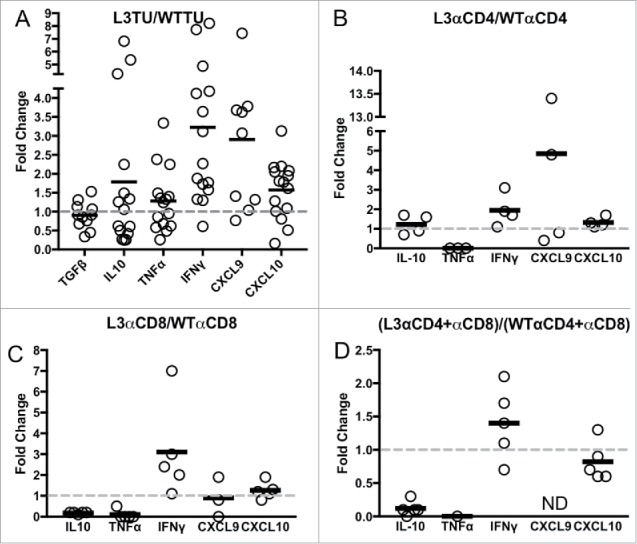
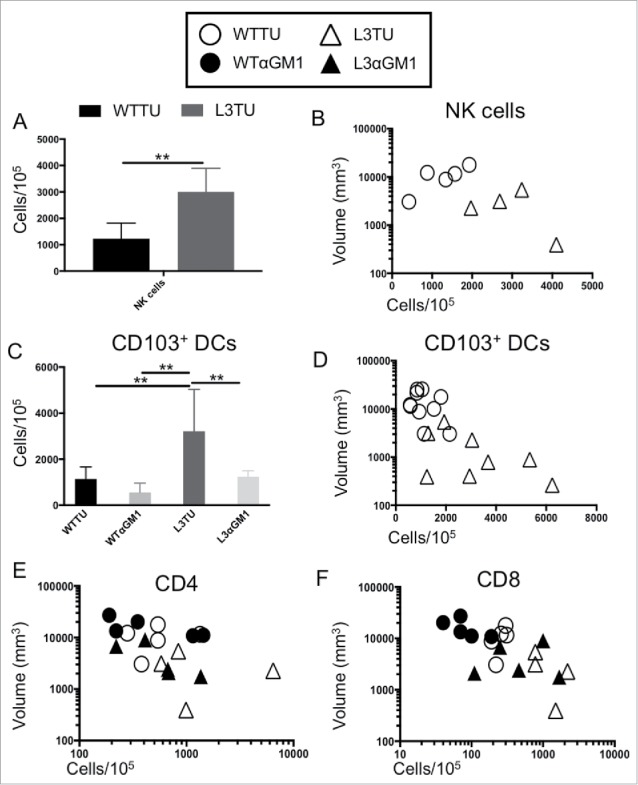
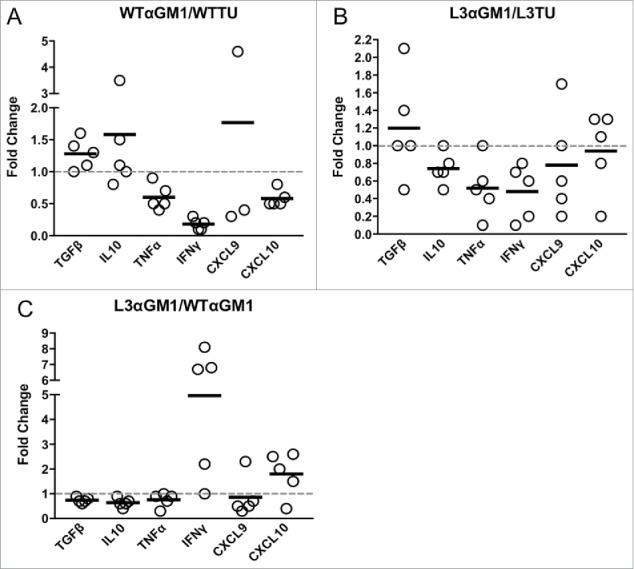
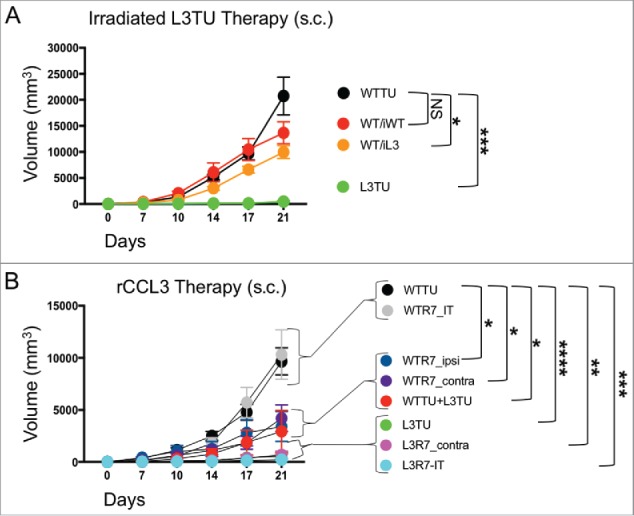
Inflammatory chemokines are critical contributors in attracting relevant immune cells to the tumor microenvironment and driving cellular interactions and molecular signaling cascades that dictate the ultimate outcome of host anti-tumor immune response. Therefore, rational application of chemokines in a spatial-temporal dependent manner may constitute an attractive adjuvant in immunotherapeutic approaches against cancer. Existing data suggest that the macrophage inflammatory protein (MIP)-1 family and related proteins, consisting of CCL3 (MIP-1α), CCL4 (MIP-1β), and CCL5 (RANTES), can be major determinant of immune cellular infiltration in certain tumors through their direct recruitment of antigen presenting cells, including dendritic cells (DCs) to the tumor site. In this study, we examined how CCL3 in a murine colon tumor microenvironment, CT26, enhances antitumor immunity. We identified natural killer (NK) cells as a major lymphocyte subtype that is preferentially recruited to the CCL3-rich tumor site. NK cells contribute to the overall IFNγ content, CD103+ DC accumulation, and augment the production of chemokines CXCL9 and CXCL10 for enhanced T cell recruitment. We further demonstrate that both soluble CCL3 and CCL3-secreting irradiated tumor vaccine can effectively halt the progression of established tumors in a spatial-dependent manner. Our finding implies an important contribution of NK in the CCL3 - CD103+ DC - CXCL9/10 signaling axis in determining tumor immune landscape within the tumor microenvironment.

Keywords: CCL3; CD103+ dendritic cells; CD8+ T cells; CXCL10; CXCL9; interferon-gamma; natural killer cells.


Figures

Figure 1.
Figure 1.
Autologous CCL3 retards CT26 growth in vivo with partial dependence on both CD8+ T cells and non-T cell sources. Mice were injected with 1 × 10⁶ WTTU (square) or L3TU (triangle) tumor cells in the left flank. Average tumor growths were shown in BALB/c athymic mice (A), mice without antibody depletion (B), CD4+ depletion antibody (C), CD8+ depletion antibody (D), or in CD4+ and CD8+ double depleted mice (E). N = 12 mice/cohort for WTTU group and n = 15 mice/cohort for L3TU group. Data shown are combined results of 3 independent experiments. Black stars (*) compare WTTU and L3TU groups within each graph. Gray dashed (—-) and dotted (….) lines compare the growth shift of each graph to no depletion WTTU and L3TU in Figure 1B. Gray stars (*) compare the significance between the growth shifts of the gray dashed and dotted lines compared to no depletion WTTU and L3TU in Figure 1B. NS: not significant; *, P = 0.01 to 0.05; **, P = 0.001 to 0.01; ***, P = 0.0001 to 0.001; ****, P < 0.0001. Error bars are shown as standard error of mean (SEM).
Figure 2.
Figure 2.
L3TU enhances CD4+ and CD8+ T cell infiltrations into the primary tumor site. Mice were injected with 1 × 10⁶ WTTU or L3TU cells in the left flank. At day 21, mice were euthanized and only visible tumors were removed for FACS and IF analyses. A, Representative IF images of GFP-labeled tumors (green), CD4+ T cells (purple) and CD8+ T cells (red). B, Quantification of IF showing T cell number per 2500 um. Shown are data obtained from a total of 4 tumors with 16 sections per tumor and 3 areas per section. C-D, Correlation of CD4+ or CD8+ T cell numbers per 1 × 10⁵ total cells by FACS versus WTTU (circle) or L3TU (triangle) tumor volume; N = 5 experiments with 5 biological replicates for each group. ****, P < 0.0001. Error bars are shown as standard deviation (SD).
Figure 3.
Figure 3.
IFNγ levels are sustained in L3TU tumors despite T cell depletions. Mice were injected with 1 × 10⁶ WTTU or L3TU cells in the left flank. On day 21, mice were euthanized and tumors removed for qPCR analysis of TGFβ, IL-10, FOXp3, TNFα, IFNγ, CXCL9, and CXCL10. A, Expressions of various cytokine mRNAs in L3TU compared to WTTU. B-D, Relative cytokine mRNA levels of L3TU compared to WTTU in animals depleted of CD4+ cells (L3αCD4 or WTαCD4), CD8+ cells (L3αCD8 or WTαCD8), or both CD4+ and CD8+ cells (L3αCD4+αCD8 or WTαCD4+αCD8). Each symbol represents an individual animal. The expressions of TNFα and CXCL9 were below detection levels in some of the groups. Data represent a compilation of 3 independent experiments. ND: Not detected.
Figure 4.
Figure 4.
CCL3 recruits NK cells to drive infiltration of CD103+ DCs and support T cell function at tumor sites. Mice were injected with 1 × 10⁶ WTTU (circles) or L3TU (triangles) cells in the left flank. At day 21, only visible tumor masses were removed for FACS analysis. A, Enumeration of NK cells (CD49+ CD3). N = 5 biological replicates. B, Correlation of data in A with individual tumor volume. C, Enumeration of dermal-resident (CD103+ CD11c+) DC subset in tumor masses with or without NK cell depletion (WTαGM1 or L3αGM1). D, Correlation of data in C with individual tumor volume. E, Correlation of CD4+ T cell density in individual tumor mass with (black) or without (white) NK cell depletion. F, Correlation of CD8+ T cell density in individual tumor mass with (black) or without (white) NK cell depletion. N = 2 independent experiments with 5 biological replicates each. **, P = 0.001 to 0.01. Error bars denote standard deviation (SD).
Figure 5.
Figure 5.
NK cells and CCL3 support inflammation and T cell homing. Mice were injected with 1 × 10⁶ WTTU or L3TU cells in the left flank. At day 21, tumors were analyzed by qPCR for TGFβ, IL-10, TNF-α, IFNγ, CXCL9, and CXCL10. A, Relative change in cytokine expression in WTTU mass with or without NK cell depletion. B, Relative change in cytokine expression in L3TU tumor mass with or without NK cell depletion. C, Relative changes in cytokine production by L3TU and WTTU with NK cell depletion. Each symbol represents an individual animal.
Figure 6.
Figure 6.
rCCL3 or irradiated L3TU significantly slows established tumor growth. Mice were injected with 1 × 10⁶ WTTU cells in the left flank. 7 days later mice were injected in the footpad or intra-tumorally (i.t.) with whole tumor lysate from lethally irradiated WTTU (iWT) or L3TU (iL3), or recombinant CCL3 (rCCL3; 100 ng). A, WTTU tumor growth in mice that received whole cell lysates of iWT or iL3. B, Tumor growth in mice that received either i.t. or s.c. injections of rCCL3. Subcutaneous injections were administered either ipsilaterally (ipsi) or contralaterally (contra) relative to WTTU 7-days post tumor injection (R7). Data shown as compilation of 2 independent experiments with n = 5–10 mice per group. NS: not significant; *, P = 0.01 to 0.05; **, P = 0.001 to 0.01; ***, P = 0.0001 to 0.001; ****, P < 0.0001. Standard error is shown as SD.

References

    1. Dunn GP, Old LJ, Schreiber RD. The three Es of cancer immunoediting. Annu Rev Immunol. 2004;22:329–360. doi:10.1146/annurev.immunol.22.012703.104803. PMID:15032581. - DOI - PubMed
    1. Nakashima E et al.. A candidate for cancer gene therapy: MIP-1 alpha gene transfer to an adenocarcinoma cell line reduced tumorigenicity and induced protective immunity in immunocompetent mice. Pharm Res. 1996;13:1896–1901. doi:10.1023/A:1016057830271. PMID:8987092. - DOI - PubMed
    1. He S, Wang L, Wu Y, Li D, Zhang Y. CCL3 and CCL20-recruited dendritic cells modified by melanoma antigen gene-1 induce anti-tumor immunity against gastric cancer ex vivo and in vivo. J Exp Clin Cancer Res. 2010;29:37. doi:10.1186/1756-9966-29-37. PMID:20420712. - DOI - PMC - PubMed
    1. Spranger S, Bao R, Gajewski TF. Melanoma-intrinsic beta-catenin signalling prevents anti-tumour immunity. Nature. 2015;523:231–235. doi:10.1038/nature14404. PMID:25970248. - DOI - PubMed
    1. Harlin H et al.. Chemokine expression in melanoma metastases associated with CD8+ T-cell recruitment. Cancer Res. 2009;69:3077–3085. doi:10.1158/0008-5472.CAN-08-2281. PMID:19293190. - DOI - PMC - PubMed

Publication types