. 2017 Dec 26;7(3):e1407897.
doi: 10.1080/2162402X.2017.1407897. eCollection 2018.

Oncolytic viruses sensitize human tumor cells for NY-ESO-1 tumor antigen recognition by CD4+ effector T cells

Affiliations

Oncolytic viruses sensitize human tumor cells for NY-ESO-1 tumor antigen recognition by CD4+ effector T cells

Tiphaine Delaunay et al. Oncoimmunology. .

Abstract

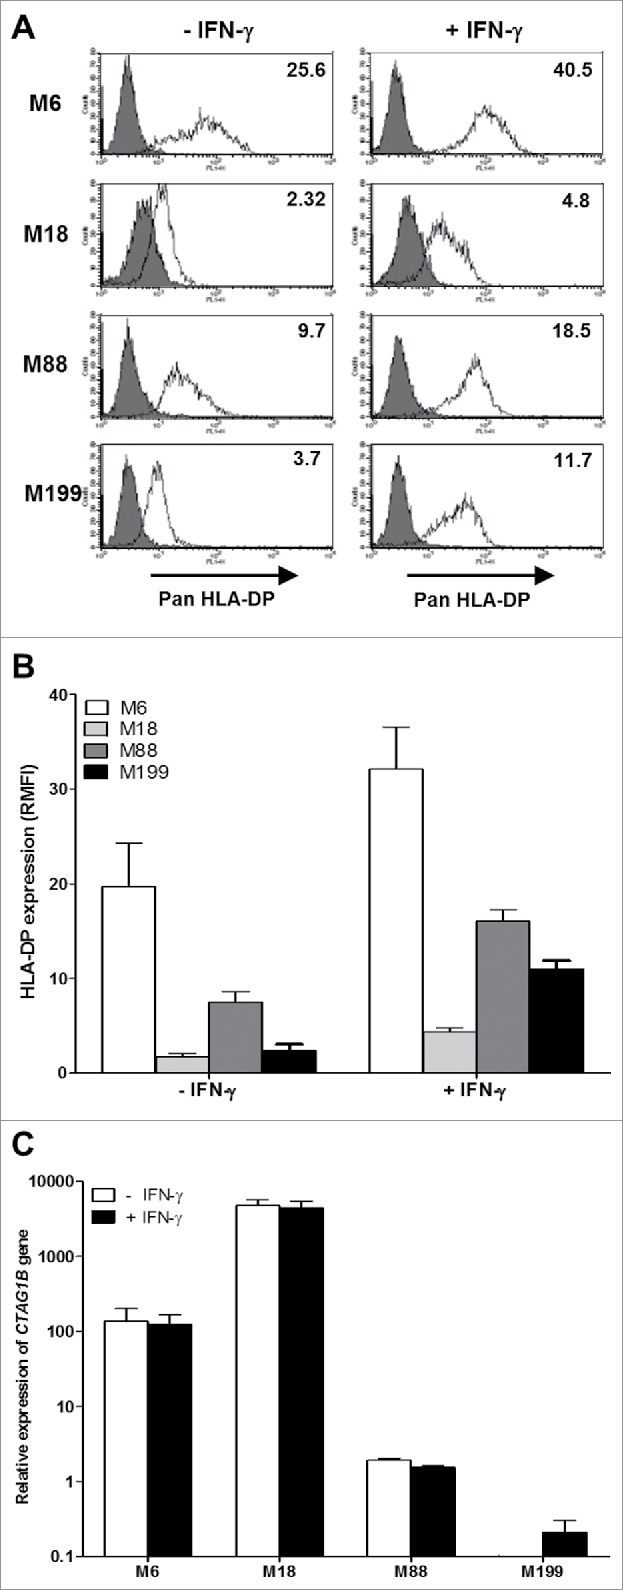
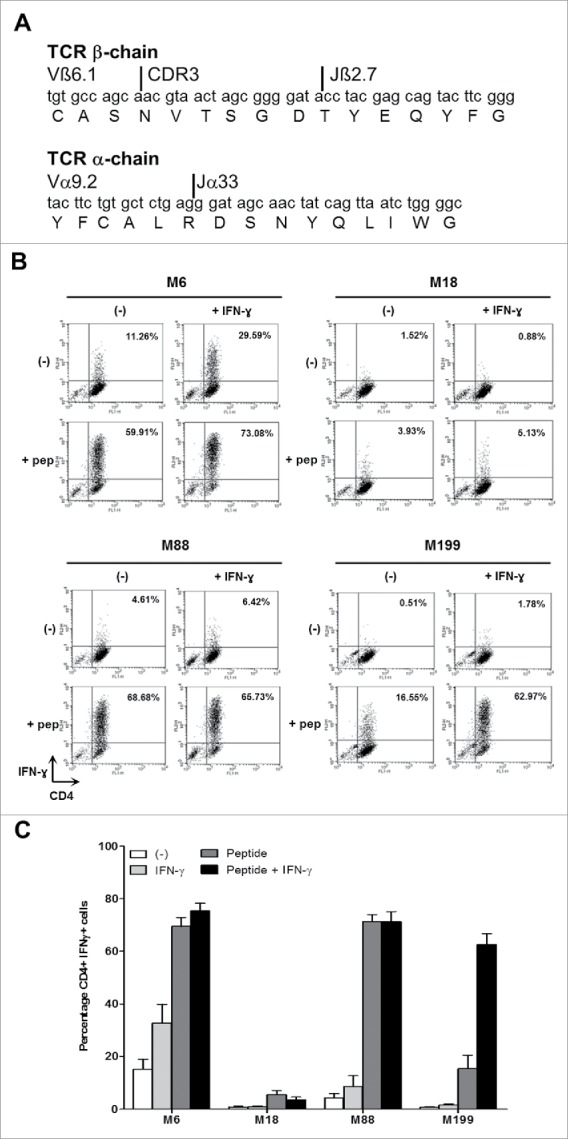
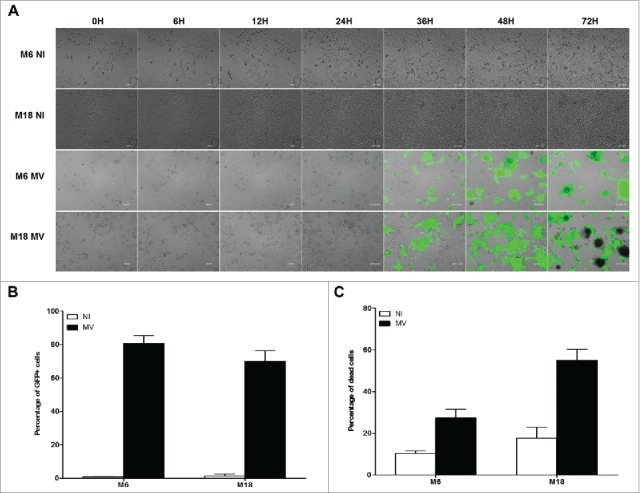
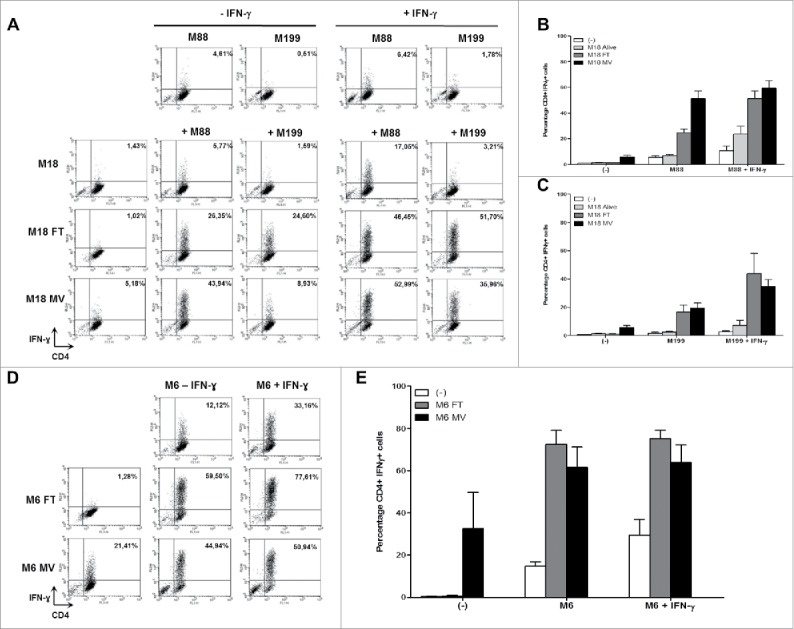
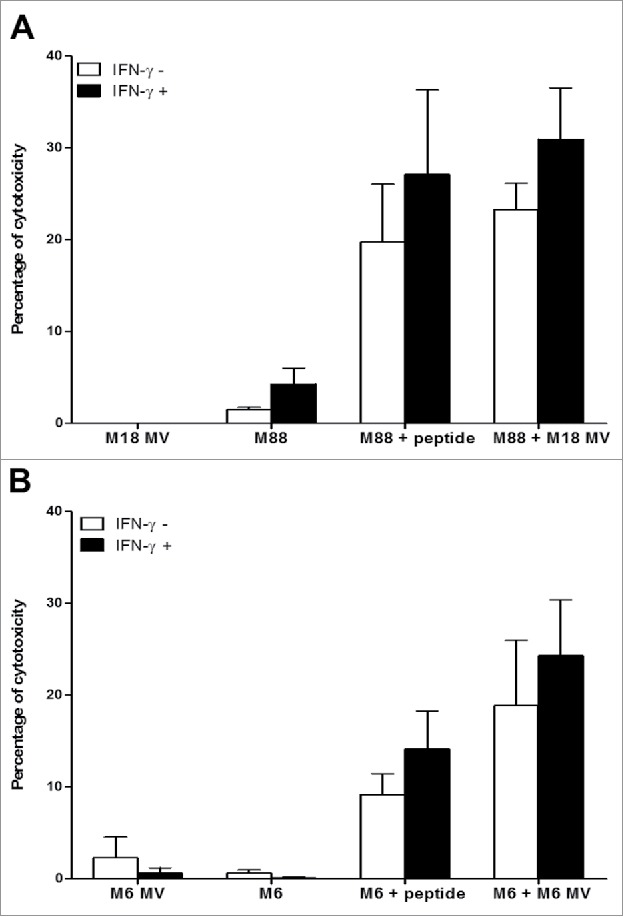
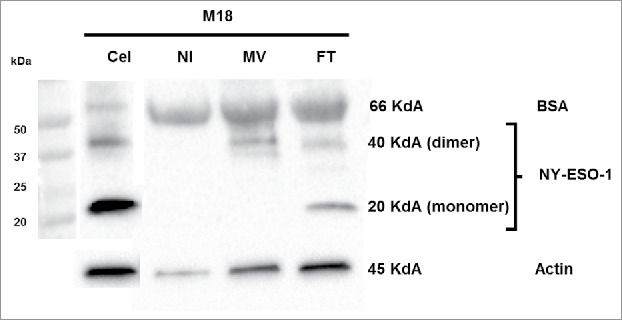
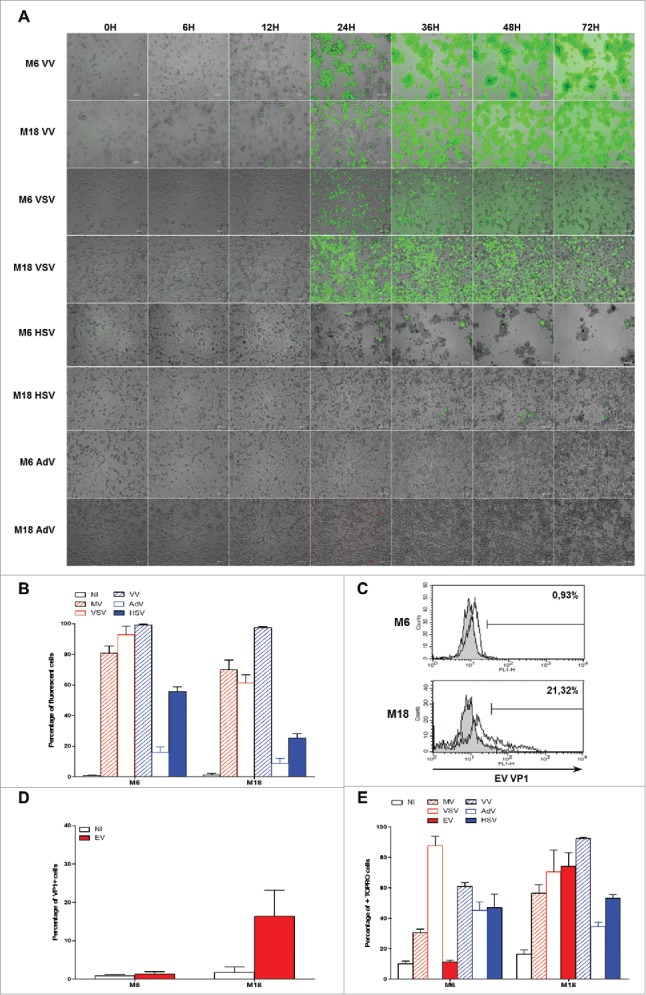
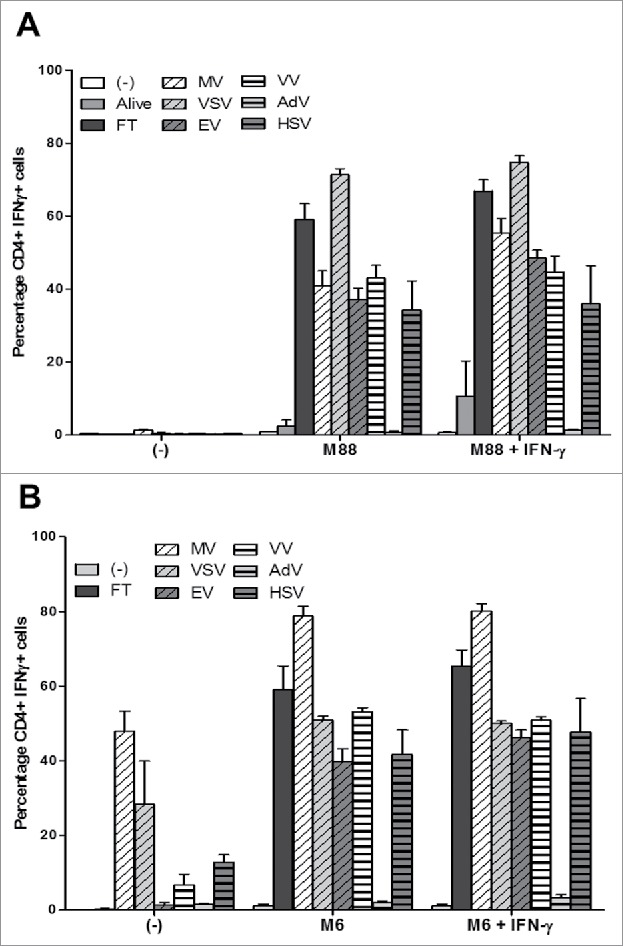
Oncolytic immunotherapy using oncolytic viruses (OV) has been shown to stimulate the antitumor immune response by inducing the release of tumor-associated antigens (TAA) and danger signals from the dying infected tumor cells. In this study, we sought to determine if the lysis of tumor cells induced by different OV: measles virus, vaccinia virus, vesicular stomatitis virus, herpes simplex type I virus, adenovirus or enterovirus, has consequences on the capacity of tumor cells to present TAA, such as NY-ESO-1. We show that the co-culture of NY-ESO-1neg/HLA-DP4pos melanoma cells with NY-ESO-1pos/HLA-DP4neg melanoma cells infected and killed by different OV induces an intercellular transfer of NY-ESO-1 that allows the recognition of NY-ESO-1neg/HLA-DP4pos tumor cells by an HLA-DP4/NY-ESO-1(157-170)-specific CD4+ cytotoxic T cell clone, NY67. We then confirmed this result in a second model with an HLA-DP4+ melanoma cell line that expresses a low amount of NY-ESO-1. Recognition of this cell line by the NY67 clone is largely increased in the presence of OV productive infection. Altogether, our results show for the first time another mechanism of stimulation of the anti-tumor immune response by OV, via the loading of tumor cells with TAA that sensitizes them for direct recognition by specific effector CD4+ T cells, supporting the use of OV for cancer immunotherapy.

Keywords: CD4+ T Lymphocytes; Melanoma; Oncolytic Viruses; Oncolytic immunotherapy; Tumor-Associated Antigens.


Figures

Figure 1.
Figure 1.
HLA-DP and NY-ESO-1 expression by melanoma cell lines. (A) The melanoma cell lines were cultured for 24 h in the absence or presence of 500IU/mL IFN-γ and then labeled with an IgG1 isotype control antibody (grey) or a monoclonal antibody directed against HLA-DP (white) followed by a staining with a fluorescent secondary antibody. Fluorescence was analyzed by flow cytometry. RMFI is shown on histograms. (B) Results are expressed as the mean ± SEM of RMFI of three independent HLA-DP staining experiments. (C) The melanoma cell lines were cultured for 24 h in the absence or presence of 500IU/ml of IFN-γ. Relative expression of the CTAG1B gene that encodes NY-ESO-1 was measured by RT-qPCR and determined with RPLPO gene expression used as reference. Indicated values are means ± SEM of relative expression of three independent experiments.
Figure 2.
Figure 2.
IFN-γ response of the CD4+ T cell clone NY67. (A) Nucleotide and amino acid sequences of the CDR3 of the beta and alpha chains of the TCR of the T cell clone NY67. (B) Melanoma cell lines were cultured in the presence or absence of IFN-γ and then loaded or not with the NY-ESO-1(157-170) peptide and washed. They were then cultured for 5 h with the CD4+ T cell clone NY67. IFN-γ response of the clone was measured by flow cytometry after CD4/IFN-γ staining. (C) Results are expressed as the mean ± SEM of the percentage of IFN-γ producing CD4+ T cells obtained from three independent experiments.
Figure 3.
Figure 3.
Melanoma cell lines are sensitive to the oncolytic activity of MV. (A) M6 and M18 melanoma lines were cultured alone (NI, not infected) or infected by MV-eGFP at an MOI of 2 (MV). Pictures were taken every 6 h during the next 72 h. (B) M6 and M18 cell lines were cultured alone (NI) or infected by MV-eGFP at MOI of 2 (MV). After 72 h, the percentage of GFP+ cells was measured by flow cytometry. Indicated value are means ± SEM of three independent experiments. (C) M6 and M18 cell lines were cultured alone (NI) or infected by MV at MOI of 2 (MV). After 72 h cells were labeled with Annexin V-APC and propidium iodide (PI). Percentage of Annexin V+ and/or PI+ cells was measured by flow cytometry. Indicated values are means ± SEM of three independent experiments.
Figure 4.
Figure 4.
MV infection of the NY-ESO-1 donor cell lines sensitizes presenting cell lines to recognition by the NY-ESO-1-specific CD4+ T cell clone NY67. (A-E) NY-ESO-1 donor cell lines, M6 or M18, were cultured alone, infected for 3 days with MV at an MOI of 2, or underwent 3 freeze/thaw cycles (FT). They were then cultured for 24 h alone or with presenting cell lines in the presence or absence of IFN-γ. The NY-ESO-1-specific CD4+ T cell clone NY67 was added to these cultures in presence of brefeldin A. 5 h later, IFN-γ response of the clone was measured by flow cytometry after CD4/IFN-γ staining. (A) Example of CD4/IFN-γ staining of the clone NY67 obtained in one experiment where M18 is the NY-ESO-1 donor cell line and M88 and M199 are the presenting cells lines. (B and C) Results are expressed as mean ± SEM of the percentage of IFN-γ-producing CD4+ T cells obtained from three independent experiments with M88 (B) or M199 (C) as presenting cell lines, respectively. (D) Example of CD4/IFN-γ staining of the clone NY67 obtained in one experiment where M6 is the NY-ESO-1 donor and also the presenting cell line. (E) Results are expressed as mean ± SEM of the percentage of IFN-γ-producing CD4+ T cells obtained from three independent experiments with M6.
Figure 5.
Figure 5.
MV infection of the NY-ESO-1 donor cell lines sensitizes presenting cell lines to cytotoxic activity of the NY-ESO-1-specific CD4+ T cell clone NY67. NY-ESO-1 donor cell line (M6 or M18) were cultured alone or infected for 3 days with MV at an MOI of 2 (MV). Donor cells were then cultured 24 h alone or with the presenting cell lines (M6 or M88) in the presence or absence of IFN-γ. A part of the presenting cells were pulsed with the NY-ESO-1(157-170) peptide. Cells were then loaded with 51Cr and exposed for 4 h to the NY-ESO-1-specific CD4+ T cell clone NY67. Then, supernatants were harvested and analyzed for the presence of 51Cr. (A) results obtained using M18 as donor cell line and M88 as presenting cell line. (B) Results obtained using M6 donor and presenting cell line. Results are expressed as mean ± SEM of percent of cytotoxicity obtained from three independent experiments.
Figure 6.
Figure 6.
Release of NY-ESO-1 by MV-infected M18 tumor cells. M18 tumor cells were cultured alone (NI), infected by MV or lyzed by freeze/thaw (FT) cycles. NY-ESO-1 was measured in M18 cellular lysate (20 μg protein deposit) and supernatants of NI, MV or FT M18 tumor cells (50 μg protein deposit). NY-ESO-1 appears as a monomer (band at 20kD) or dimer (band at 40kD).
Figure 7.
Figure 7.
Sensitivity of NY-ESO-1 donor melanoma cell lines M6 and M18 to six different OV. M6 and M18 melanoma cell lines were infected with VV (MOI = 0.1), VSV (MOI = 0.01), HSV (MOI = 1), AdV (MOI = 100) during 72 h. (A) Pictures were taken every 6 h. (B) 72 h later, the percentage of GFP+ cells for MV-eGFP, VV, VSV and HSV, or RFP+ cells for AdV was measured by flow cytometry. (C and D) M6 and M18 melanoma cell lines were infected with EV (MOI = 5). 72 h later, cells were stained with an antibody against VP-1 of EV and an Alexa-488 secondary antibody. Fluorescence was measured by flow cytometry. (C) Histogram plots of control (grey) and VP1 (white) stainings. (D) Results are expressed as mean ± SEM of three independent VP1 stainings. (E) M6 and M18 cell lines were infected with MV-eGFP (MOI = 2), VV (MOI = 0.1), VSV (MOI = 0.01), HSV (MOI = 1), AdV (MOI = 100) and EV (MOI = 5). 72 h later, cells were labeled with TO-PRO®-3. TO-PRO®-3+ cells were measured by flow cytometry. Indicated value are means ± SEM of three independent experiments.
Figure 8.
Figure 8.
OV infection of the NY-ESO-1 donor cell lines sensitizes presenting cell lines to recognition by the NY-ESO-1-specific CD4+ T cell clone NY67. (A) The NY-ESO-1 donor cell line M18 was cultured alone, infected for 3 days with MV (MOI = 2), VSV (MOI = 0.01), EV (MOI = 5), VV (MOI = 0.1), AdV (MOI = 100), HSV (MOI = 1) or underwent 3 freeze/thaw cycles (FT). Cells were then cultured 24 h alone or with the presenting cell line M88 in the presence or absence of IFN-γ. The NY-ESO-1-specific CD4+ T cell clone NY67 was added to the culture in presence of brefeldin A. 5 h later, IFN-γ response of the clone was measured by flow cytometry after CD4/IFN-γ staining. (B) The NY-ESO-1 donor cell line M6 was cultured alone, infected for 72 h with MV (MOI = 2), VSV (MOI = 0.01), EV (MOI = 5), VV (MOI = 0.1), AdV (MOI = 100), HSV (MOI = 1) or underwent 3 FT cycles. Cells were then cultured 24 h alone or with the autologous presenting cell line M6 in the presence or absence of IFN-γ. The NY-ESO-1-specific CD4+ T cell clone NY67 was added to the culture in presence of brefeldin A. 5 h later, IFN-γ response of the clone was measured by flow cytometry after CD4/IFN-γ staining. Results are expressed as mean ± SEM of three independent experiments.

References

    1. Russell SJ, Peng KW, Bell JC. Oncolytic virotherapy. Nat Biotechnol. 2012;30(7):658–70. doi:10.1038/nbt.2287. - DOI - PMC - PubMed
    1. Lichty BD, Breitbach CJ, Stojdl DF, Bell JC. Going viral with cancer immunotherapy. Nat Rev Cancer. 2014;14(8):559–67. doi:10.1038/nrc3770. - DOI - PubMed
    1. Bartlett DL, Liu Z, Sathaiah M, Ravindranathan R, Guo Z, He Y, Guo ZS. Oncolytic viruses as therapeutic cancer vaccines. Mol Cancer. 2013;12(1):103. doi:10.1186/1476-4598-12-103. - DOI - PMC - PubMed
    1. Workenhe ST, Mossman KL. Oncolytic virotherapy and immunogenic cancer cell death: sharpening the sword for improved cancer treatment strategies. Mol Ther. 2014; 22(2):251–6. doi:10.1038/mt.2013.220. - DOI - PMC - PubMed
    1. Coulie PG, Van den Eynde BJ, van der Bruggen P, Boon T. Tumour antigens recognized by T lymphocytes: at the core of cancer immunotherapy. Nat Rev Cancer. 2014;14(2):135–46. doi:10.1038/nrc3670. - DOI - PubMed

Publication types

LinkOut - more resources