. 2018 Jan 31;3(1):273-285.
doi: 10.1021/acsomega.7b01472. Epub 2018 Jan 10.

Sphingomyelin and GM1 Influence Huntingtin Binding to, Disruption of, and Aggregation on Lipid Membranes

Affiliations

Sphingomyelin and GM1 Influence Huntingtin Binding to, Disruption of, and Aggregation on Lipid Membranes

Maxmore Chaibva et al. ACS Omega. .

Abstract

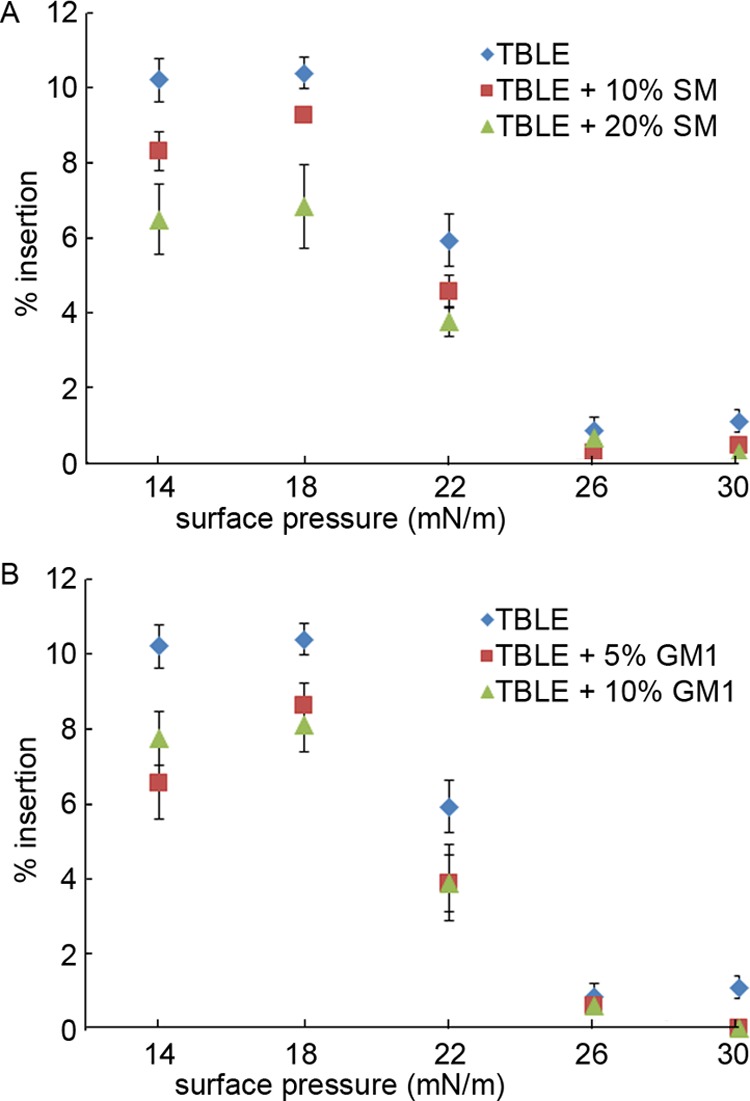
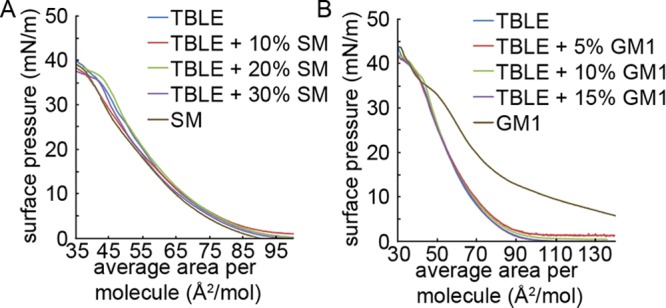
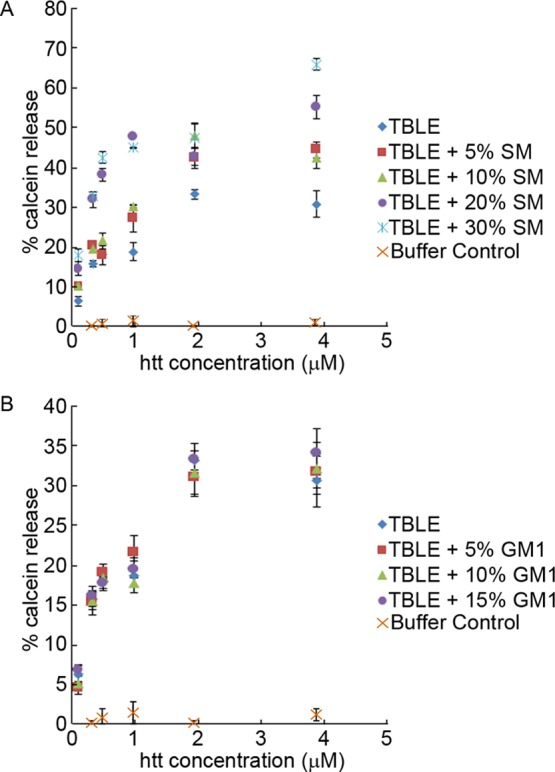
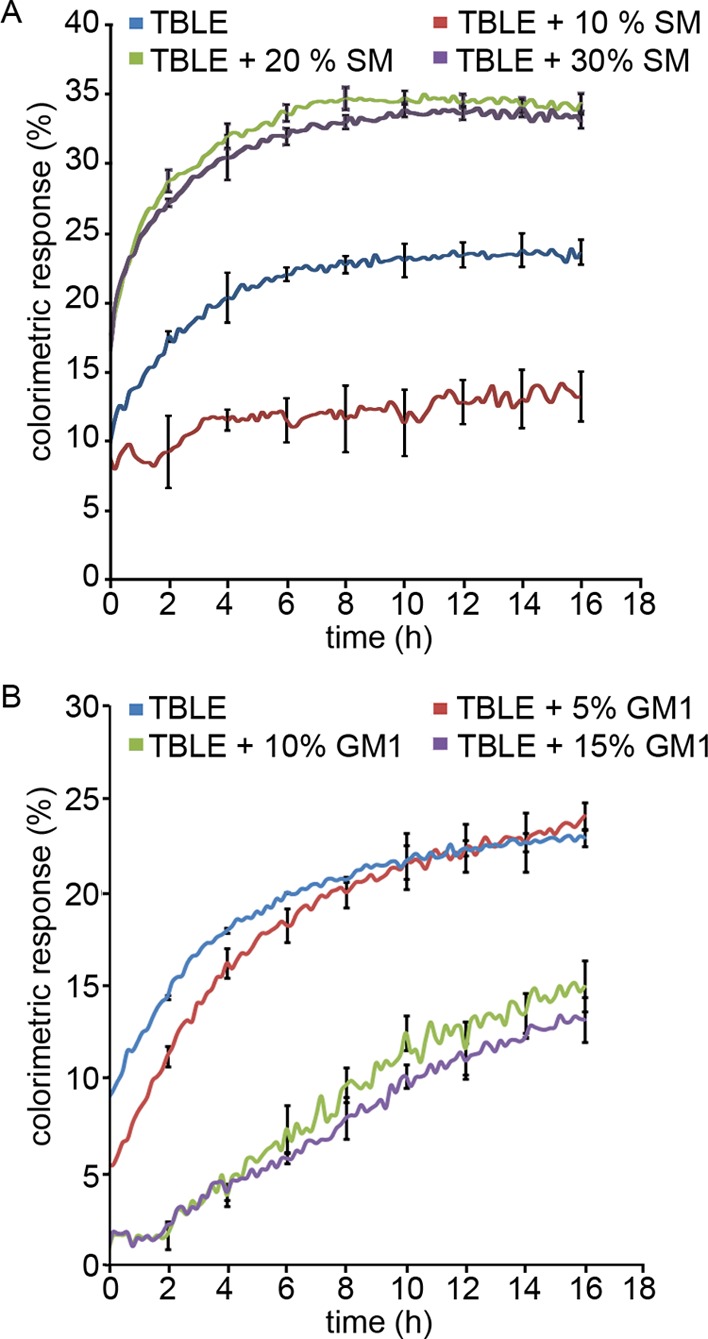
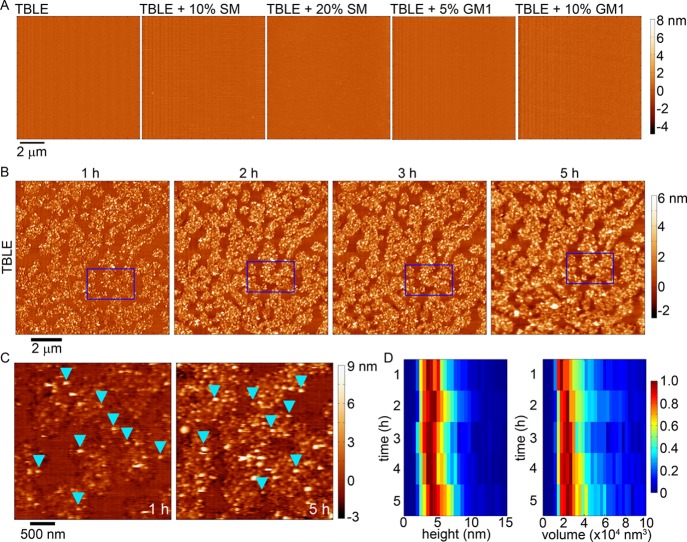
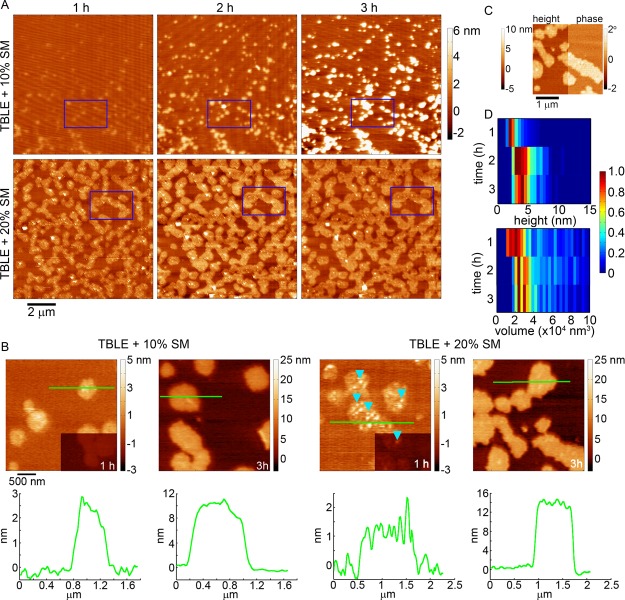
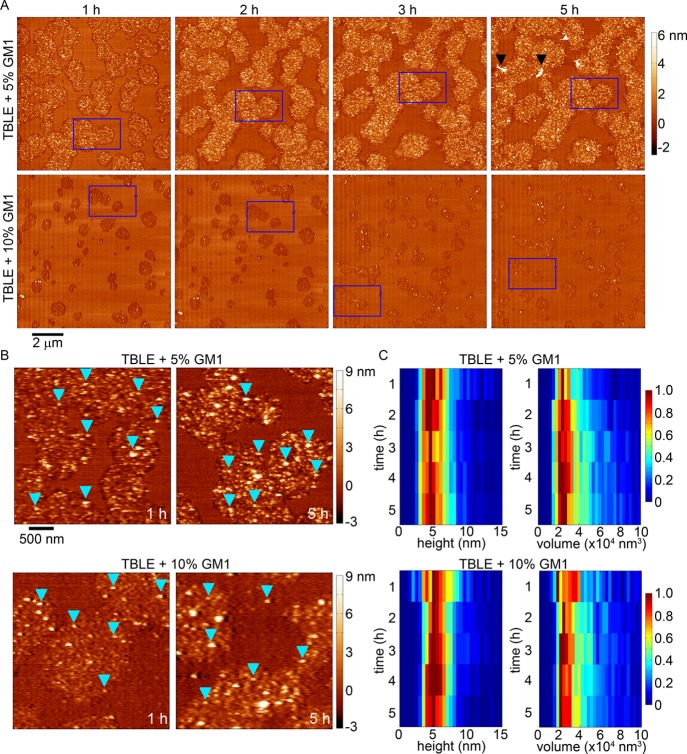
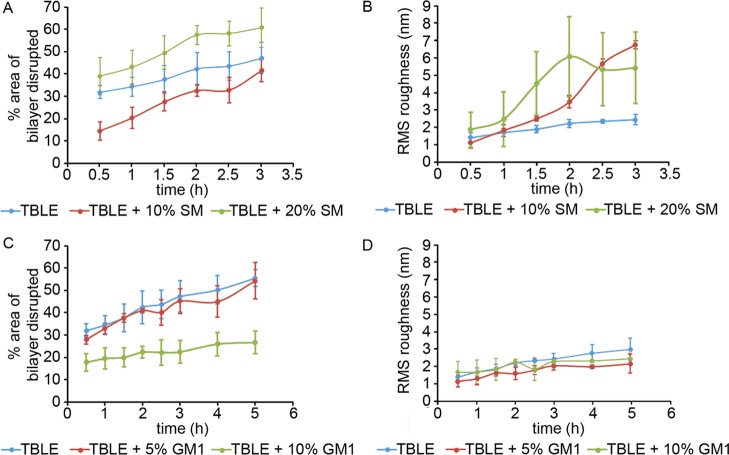
Huntington disease (HD) is an inherited neurodegenerative disease caused by the expansion beyond a critical threshold of a polyglutamine (polyQ) tract near the N-terminus of the huntingtin (htt) protein. Expanded polyQ promotes the formation of a variety of oligomeric and fibrillar aggregates of htt that accumulate into the hallmark proteinaceous inclusion bodies associated with HD. htt is also highly associated with numerous cellular and subcellular membranes that contain a variety of lipids. As lipid homeostasis and metabolism abnormalities are observed in HD patients, we investigated how varying both the sphingomyelin (SM) and ganglioside (GM1) contents modifies the interactions between htt and lipid membranes. SM composition is altered in HD, and GM1 has been shown to have protective effects in animal models of HD. A combination of Langmuir trough monolayer techniques, vesicle permeability and binding assays, and in situ atomic force microscopy (AFM) were used to directly monitor the interaction of a model, synthetic htt peptide and a full-length htt-exon1 recombinant protein with model membranes comprised of total brain lipid extract (TBLE) and varying amounts of exogenously added SM or GM1. The addition of either SM or GM1 decreased htt insertion into the lipid monolayers. However, TBLE vesicles with an increased SM content were more susceptible to htt-induced permeabilization, whereas GM1 had no effect on permeablization. Pure TBLE bilayers and TBLE bilayers enriched with GM1 developed regions of roughened, granular morphologies upon exposure to htt-exon1, but plateau-like domains with a smoother appearance formed in bilayers enriched with SM. Oligomeric aggregates were observed on all bilayer systems regardless of induced morphology. Collectively, these observations suggest that the lipid composition and its subsequent effects on membrane material properties strongly influence htt binding and aggregation on lipid membranes.


Conflict of interest statement

The authors declare no competing financial interest.

Figures

Figure 1
Figure 1
Insertion of Nt17-Q35-P10-KK into lipid monolayers of varying (A) TBLE/SM and (B) TBLE/GM1 ratios at the air/buffer interface, expressed as % insertion at each surface pressure. The error bars represent the standard deviation (n = 3 separate experiments).
Figure 2
Figure 2
Monolayer compression isotherms of (A) pure TBLE, pure SM, and binary mixtures of TBLE and SM and (B) pure TBLE, pure GM1, and binary mixtures of TBLE and GM1, measured at 30 °C. Average area per molecule was calculated assuming an average TBLE molecular weight of 850 g/mol.
Figure 3
Figure 3
Calcein leakage, measured as relative fluorescence, from LUVs composed of different (A) TBLE/SM ratios or (B) TBLE/GM1 ratios, exposed to Nt17-Q35-P10-KK (or buffer acting as a control) as a function of the peptide concentration. The error bars indicate one standard deviation (n = 3 separate experiments).
Figure 4
Figure 4
Percent colorimetric response (% CR) of TBLE/ polydiacetylene (PDA) vesicles containing various amounts of exogenous (A) SM or (B) GM1 upon exposure to htt-exon1(51Q) plotted as a function of time. The error bars indicate 1 standard deviation (n = 3).
Figure 5
Figure 5
(A) AFM height images taken in-solution of continuous, supported lipid bilayers of TBLE, TBLE + 10% SM, TBLE + 20% SM, TBLE + 5% GM1, and TBLE + 10% GM1 prior to exposure to any htt-exon1(51Q). (B) Sequential AFM height images taken in-solution of supported TBLE bilayers exposed to htt-exon1(51Q). Blue rectangles identify the same region of the surface in the sequential images. (C) Zoomed-in AFM images demonstrating the rough, grainy morphological changes induced in a pure TBLE bilayer by htt-exon1(51Q). Blue arrows indicate oligomeric aggregates. (D) Height and volume histograms of oligomeric aggregates observed on TBLE bilayers presented as a function of time. To ease visualization, the histograms were normalized for each time point by setting the value of the most common height or volume to 1.
Figure 6
Figure 6
(A) Sequential AFM height images taken in-solution of supported TBLE bilayers enriched with either 10 or 20% SM exposed to htt-exon1(51Q). Blue rectangles identify the same region of the surface in the sequential images. (B) Zoomed-in AFM images demonstrating the morphological changes induced in TBLE bilayers enriched in SM. Blue arrows indicate oligomeric aggregates. Green lines correspond to the height profiles presented directly below the images. The lower right corners of the images for the 1 h time point are presented at the same height scale as the 3 h images for easier comparison. (C) AFM image split into height and phase data of a region of a TBLE + 20% SM bilayer exposed to htt-exon1(51Q). (D) Height and volume histograms of oligomeric aggregates observed on TBLE bilayers enriched with 20% SM, presented as a function of time. To ease visualization, the histograms were normalized for each time point by setting the value of the most common height or volume to 1.
Figure 7
Figure 7
(A) Sequential AFM height images taken in-solution of supported TBLE bilayers enriched with either 5 or 10% GM1 exposed to htt-exon1(51Q). Blue rectangles identify the same region of the surface in the sequential images. Black arrows indicate fibrillar aggregates. (B) Zoomed-in AFM images demonstrating the rough, grainy morphological changes induced in TBLE bilayers enriched in GM1. Blue arrows indicate oligomeric aggregates. (C) Height and volume histograms of oligomeric aggregates observed on TBLE bilayers enriched with GM1 presented as a function of time. To ease visualization, the histograms were normalized for each time point by setting the value of the most common height or volume to 1.
Figure 8
Figure 8
Percent area of disrupted bilayer morphology and increased rms roughness associated with exposure of lipid bilayers containing various amounts of (A,B) SM or (C,D) GM1 to htt-exon1(51Q), presented as a function of time. The error bars indicate 1 standard deviation over three separate experiments.

References

    1. The Huntington’s Disease Collaborative Research Group A Novel Gene Containing a Trinucleotide Repeat That Is Expanded and Unstable on Huntington’s Disease Chromosomes. Cell 1993, 72, 971–983. 10.1016/0092-8674(93)90585-E. - DOI - PubMed
    1. DiFiglia M.; Sapp E.; Chase K. O.; Davies S. W.; Bates G. P.; Vonsattel J. P.; Aronin N. Aggregation of huntingtin in neuronal intranuclear inclusions and dystrophic neurites in brain. Science 1997, 277, 1990–1993. 10.1126/science.277.5334.1990. - DOI - PubMed
    1. Legleiter J.; Mitchell E.; Lotz G. P.; Sapp E.; Ng C.; DiFiglia M.; Thompson L. M.; Muchowski P. J. Mutant Huntingtin Fragments Form Oligomers in a Polyglutamine Length-dependent Manner in Vitro and in Vivo. J. Biol. Chem. 2010, 285, 14777–14790. 10.1074/jbc.m109.093708. - DOI - PMC - PubMed
    1. Gu X.; Greiner E. R.; Mishra R.; Kodali R.; Osmand A.; Finkbeiner S.; Steffan J. S.; Thompson L. M.; Wetzel R.; Yang X. W. Serines 13 and 16 Are Critical Determinants of Full-Length Human Mutant Huntingtin Induced Disease Pathogenesis in HD Mice. Neuron 2009, 64, 828–840. 10.1016/j.neuron.2009.11.020. - DOI - PMC - PubMed
    1. Wetzel R. Physical Chemistry of Polyglutamine: Intriguing Tales of a Monotonous Sequence. J. Mol. Biol. 2012, 421, 466–490. 10.1016/j.jmb.2012.01.030. - DOI - PMC - PubMed