. 2018 Mar 1;128(3):1026-1042.
doi: 10.1172/JCI96481. Epub 2018 Feb 5.

Clonally expanded γδ T cells protect against Staphylococcus aureus skin reinfection

Affiliations

Clonally expanded γδ T cells protect against Staphylococcus aureus skin reinfection

Carly A Dillen et al. J Clin Invest. .

Abstract

The mechanisms that mediate durable protection against Staphylococcus aureus skin reinfections are unclear, as recurrences are common despite high antibody titers and memory T cells. Here, we developed a mouse model of S. aureus skin reinfection to investigate protective memory responses. In contrast with WT mice, IL-1β-deficient mice exhibited poor neutrophil recruitment and bacterial clearance during primary infection that was rescued during secondary S. aureus challenge. The γδ T cells from skin-draining LNs utilized compensatory T cell-intrinsic TLR2/MyD88 signaling to mediate rescue by trafficking and producing TNF and IFN-γ, which restored neutrophil recruitment and promoted bacterial clearance. RNA-sequencing (RNA-seq) of the LNs revealed a clonotypic S. aureus-induced γδ T cell expansion with a complementarity-determining region 3 (CDR3) aa sequence identical to that of invariant Vγ5+ dendritic epidermal T cells. However, this T cell receptor γ (TRG) aa sequence of the dominant CDR3 sequence was generated from multiple gene rearrangements of TRGV5 and TRGV6, indicating clonotypic expansion. TNF- and IFN-γ-producing γδ T cells were also expanded in peripheral blood of IRAK4-deficient humans no longer predisposed to S. aureus skin infections. Thus, clonally expanded γδ T cells represent a mechanism for long-lasting immunity against recurrent S. aureus skin infections.

Keywords: Adaptive immunity; Bacterial infections; Immunology; Infectious disease; Skin.


Conflict of interest statement

Conflict of interest: L.S. Miller reports grant support from MedImmune, Regeneron Pharmaceuticals, Moderna Therapeutics, and Pfizer, which are developing therapeutics and vaccines against Staphylococcus aureus and other pathogens. M.R. Yeaman is a shareholder of NovaDigm Therapeutics, which is developing new vaccines, including NDV-3 targeting S. aureus and other pathogens.

Figures

Figure 1
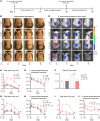
Figure 1. IL-1β–/– mice are protected against an S. aureus skin reinfection.
(A) Time line for S. aureus skin reinfection model. (B) Representative photographs of skin lesions. (C) Mean total lesion size (cm2) ± SEM (n = 10/group). (D) Representative S. aureus in vivo bioluminescent signals. (E) Mean total flux (photons/s) ± SEM (n = 10/group). (F) Ex vivo CFUs from d7 infected skin (n = 5/group). (GJ) Mean total lesion size (cm2) ± SEM and mean total flux (photons/s) ± SEM after 8-week (G and H) or 20-week (I and J) convalescent period (n = 5–10/group). P < 0.01,; P < 0.001, compared with 1° mice, as calculated by 2-way ANOVA (C, E, GJ) or 2-tailed Student’s t test (F). Results in BE and G and H are a compilation of 2 independent experiments. Results in F are representative of 2 independent experiments.
Figure 2
Figure 2. Neutrophil recruitment is restored in IL-1β–/– mice during secondary infection.
(AD) Representative H&E- (AC) and Gram-stained (D) histologic sections at 3 days after S. aureus inoculation. Scale bars: 240 μm. B and D show higher magnification of the black boxed area in A. C shows higher magnification of the white boxed area in B (n = 5/group). (E) Mean abscess area (cm2) ± SEM and (F) mean bacterial band width (mm) ± SEM from histologic sections (n = 5/group). (G) Mean neutrophil (PMN) number per 10 μl of blood ± SEM from 0 to 6 hours after S. aureus inoculation (n = 5/group). *P < 0.05; P < 0.01, compared with 1° mice, as calculated by 2-tailed Student’s t test (EG). Results in G are representative of 2 independent experiments.
Figure 3
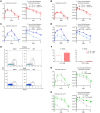
Figure 3. Specific antibodies are not involved in protective immunity.
(A) Mean total and S. aureus–specific serum IgG (pg/ml) ± SEM at d28 (n = 5/group). (B) Mean total and S. aureus–specific IgG levels IgG (pg/mg tissue weight) ± SEM in skin homogenates at 1 day after S. aureus inoculation (n = 5/group). (C) Time line of i.v. serum transfer. (D) Mean total lesion size (cm2) ± SEM and mean total flux (photon/s) ± SEM (n = 10/group). P < 0.01; P < 0.001, as measured by 2-tailed Student’s t test (A and B). Results in D are a compilation of 2 independent experiments.
Figure 4
Figure 4. T cells trafficking from draining LNs mediate the protection.
(A) Time line of FTY720 administration with (B) mean total lesion size (cm2) ± SEM and mean total flux (photon/s) ± SEM (n = 10/group). (C) Representative H&E-stained histologic sections at 3 days after S. aureus inoculation. Scale bars: 240 μm. D shows higher magnification of the black boxed area in C. E shows higher magnification of the white boxed area in D (n = 4/group). (F) Mean abscess area (cm2) ± SEM and (G) mean bacterial band width (mm) ± SEM from histologic sections (n = 4/group). (H) Draining LN cells harvested from d28 IL-1β–/– mice and transferred i.v. 1 day prior to 1° S. aureus inoculation of naive IL-1β–/– mice and (I) mean total lesion size (cm2) ± SEM and mean total flux (photon/s) ± SEM (n = 5/group). (J) Time line of anti-CD4 treatment and (K) mean total lesion size (cm2) ± SEM and mean total flux (photon/s) ± SEM (n = 5/group). P < 0.01, compared with control 1° or 2° mice (B and I) as measured by 2-way ANOVA. Results in B, I, and K are a compilation of 2 independent experiments.
Figure 5
Figure 5. γδ T cells from draining LNs confer protection.
(A) Draining LNs were harvested from d28 IL-1β–/– mice, and γδ T cells or other CD3+ T cells were transferred i.v. 1 day prior to S. aureus inoculation of naive IL-1β–/– mice. (B) Total lesion size (cm2) ± SEM and mean total flux (photon/s) ± SEM (n = 10/group). (C) Draining LNs were harvested from d28 IL-1β–/– mice and γδ T cells, CD4+ T cells, or γδ T cells and CD4+ T cells combined were transferred i.v. 1 day prior to S. aureus inoculation of naive IL-1β–/– mice. (D) Total lesion size (cm2) ± SEM and mean total flux (photon/s) ± SEM (n = 5/group). *P < 0.05; P < 0.01, between the 2 groups (B) or compared with IL-1β–/– mice without cell transfer (1° IL-1β–/–) (D) as measured by 2-way ANOVA. Results in B are a compilation of 2 independent experiments, and results in D are representative of 2 independent experiments.
Figure 6
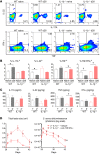
Figure 6. γδ T cells are induced by T cell–intrinsic TLR2/MyD88 signaling.
IL-1β–/– mice (A and B) or TLR2–/– mice (C and D) were treated with an α–IL-1R antibody or isotype control every other day beginning at d–1 and continuing throughout the 1° and 2° infection with total lesion size (cm2) ± SEM and mean total flux (photon/s) ± SEM (n = 5/group) determined. (E and F) Representative flow plots (E) and mean percentage ± SEM (F) of TLR2-expressing γδ and CD4+ T cells in inguinal LNs of naive and d28 IL‑1β–/– mice (n = 5/group). (G and H) Lck-MyD88–/– or WT mice (n = 5) during 1° and 2° infection with mean total lesion size (cm2) ± SEM and mean total flux (photon/s) ± SEM (n = 5/group) determined. *P < 0.05; P < 0.01, compared with control 1° or 2° mice as measured by 2-way ANOVA. Results (AH) are representative of 2 independent experiments.
Figure 7
Figure 7. γδ T cells produced TNF and IFN-γ to mediate protection.
(A and B) Representative flow plots (A) and mean percentage ± SEM (B) are shown for IL‑17A–, IL-22–, TNF-, and IFN-γ–producing γδ T cells in inguinal LNs of naive and d28 WT and IL‑1β–/– mice (n = 5/group). (C) Protein levels of IL17A, IL-22, TNF, and IFN-γ in skin homogenates at d1 after S. aureus inoculation (n = 5/group). (D) Mean total lesion size (cm2) ± SEM and mean total flux (photon/s) ± SEM of IL-1β–/– mice ± anti-TNF/IFN-γ treatment (n = 5/group). *P < 0.05; P < 0.01, as calculated by 2-tailed Student’s t test (B and C) or 2-way ANOVA (D). Results are representative of 2 independent experiments.
Figure 8
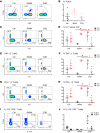
Figure 8. Clonotypic T cell expansion in response to S.
aureus. CDR3 sequences were mined from RNA-seq data set of LNs and skin samples of naive WT and IL-1β–/– mice (n = 5/group) and d28 LNs (WT mice, n = 5; IL-1β–/– mice, n = 7). (A and B) Pooled results from all LN samples presented as the CDR3 aa sequence rank (x axis) versus proportion of the total CDR3 aa reads occupied by that particular CDR aa sequence (y axis). Blue dots indicate each of the different CDR3 aa reads; orange dots indicate public (found in most samples) TRA- and TRB-encoded CDR3 aa sequences; red dots indicate top (dominantly expanded) TRG- and TRD-encoded CDR3 aa sequences in d28 LNs of WT and IL‑1β-/- mice.
Figure 9
Figure 9. TNF/IFN-γ–producing γδ T cells from PBMCs in individuals with IRAK4 deficiency and CGD.
PBMCs from healthy controls (ctrl, n = 6), patients with IRAK4 deficiency (n = 3 samples, including 2 samples from the same individual at age 17, toward the end of the predilection for recurrent infection, and at age 22), and patients with CGD (n = 4) were analyzed. Representative flow plots and mean percentage ± SEM are shown for total γδ T cells in PBMCs (A and B), Vδ1+ versus Vδ2+ γδ T cells (C and D), TNF production (E and F), IFN-γ production (G and H), and IL-17A production (I and J). *P < 0.05; P < 0.01, as measured by 2-tailed Student’s t test with Bonferroni’s correction.

References

    1. Tong SY, Davis JS, Eichenberger E, Holland TL, Fowler VG. Staphylococcus aureus infections: epidemiology, pathophysiology, clinical manifestations, and management. Clin Microbiol Rev. 2015;28(3):603–661. doi: 10.1128/CMR.00134-14. - DOI - PMC - PubMed
    1. Montgomery CP, David MZ, Daum RS. Host factors that contribute to recurrent staphylococcal skin infection. Curr Opin Infect Dis. 2015;28(3):253–258. doi: 10.1097/QCO.0000000000000156. - DOI - PMC - PubMed
    1. Holtfreter S, Kolata J, Bröker BM. Towards the immune proteome of Staphylococcus aureus - The anti-S. aureus antibody response. Int J Med Microbiol. 2010;300(2-3):176–192. doi: 10.1016/j.ijmm.2009.10.002. - DOI - PubMed
    1. Kolata JB, et al. The fall of a dogma? unexpected high t-cell memory response to Staphylococcus aureus in humans. J Infect Dis. 2015;212(5):830–838. doi: 10.1093/infdis/jiv128. - DOI - PubMed
    1. Fowler VG, Proctor RA. Where does a Staphylococcus aureus vaccine stand? Clin Microbiol Infect. 2014;20 Suppl 5:66–75. - PMC - PubMed

Publication types

MeSH terms