. 2018 Mar;24(3):326-337.
doi: 10.1038/nm.4482. Epub 2018 Feb 5.

Pericyte degeneration causes white matter dysfunction in the mouse central nervous system

Affiliations

Pericyte degeneration causes white matter dysfunction in the mouse central nervous system

Axel Montagne et al. Nat Med. 2018 Mar.

Retraction in

Abstract

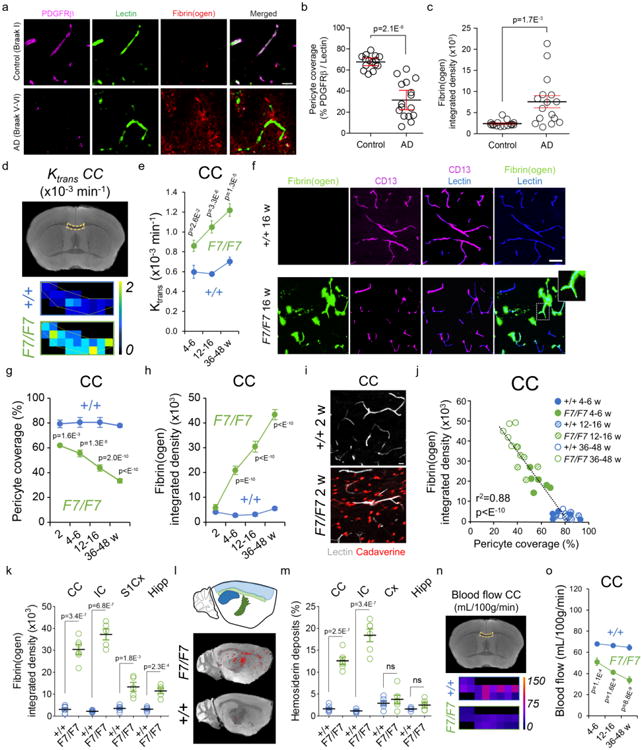
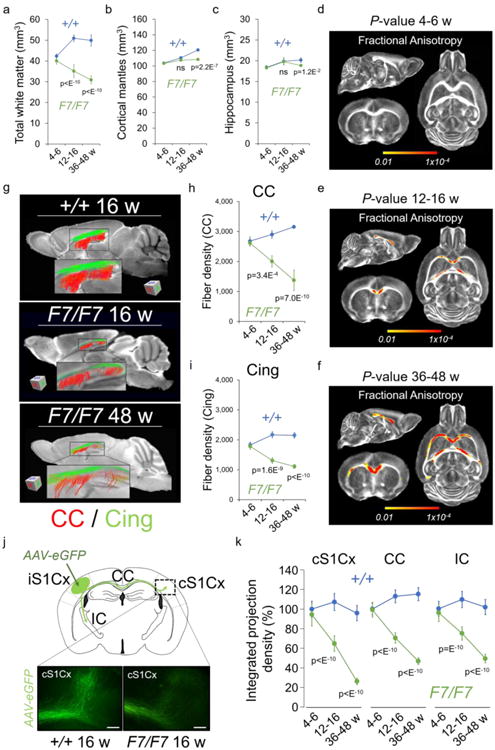
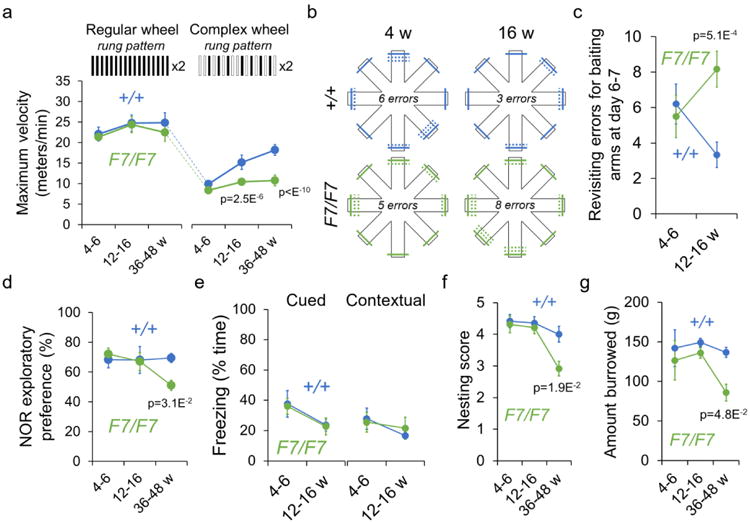
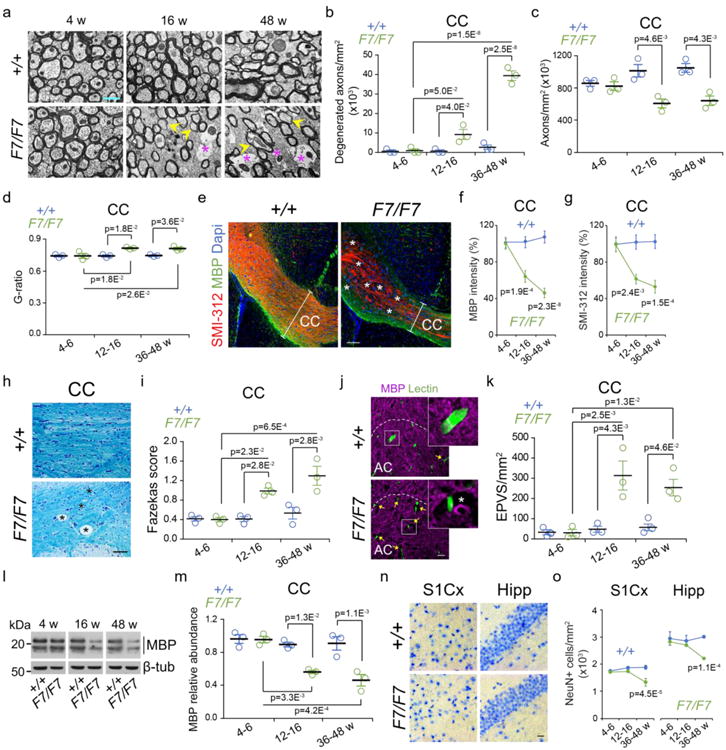
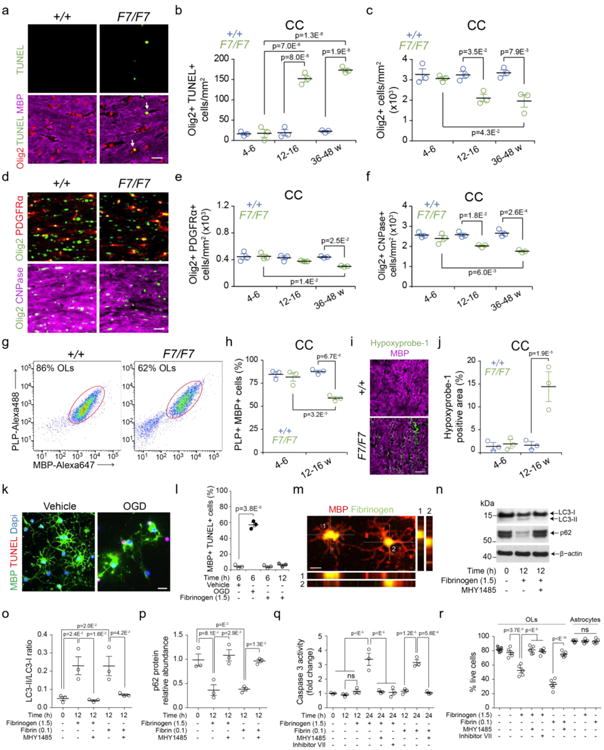
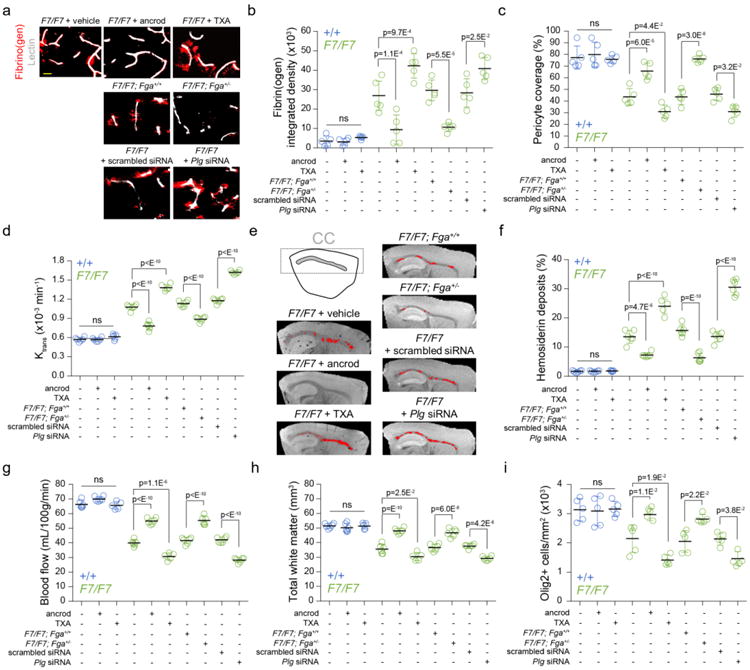
Diffuse white-matter disease associated with small-vessel disease and dementia is prevalent in the elderly. The biological mechanisms, however, remain elusive. Using pericyte-deficient mice, magnetic resonance imaging, viral-based tract-tracing, and behavior and tissue analysis, we found that pericyte degeneration disrupted white-matter microcirculation, resulting in an accumulation of toxic blood-derived fibrin(ogen) deposits and blood-flow reductions, which triggered a loss of myelin, axons and oligodendrocytes. This disrupted brain circuits, leading to white-matter functional deficits before neuronal loss occurs. Fibrinogen and fibrin fibrils initiated autophagy-dependent cell death in oligodendrocyte and pericyte cultures, whereas pharmacological and genetic manipulations of systemic fibrinogen levels in pericyte-deficient, but not control mice, influenced the degree of white-matter fibrin(ogen) deposition, pericyte degeneration, vascular pathology and white-matter changes. Thus, our data indicate that pericytes control white-matter structure and function, which has implications for the pathogenesis and treatment of human white-matter disease associated with small-vessel disease.


Figures

Figure 1
Figure 1. White matter microvascular changes in Alzheimer's disease and pericyte-deficient mice
(a) PDGFRβ-positive pericyte coverage (magenta), lectin-positive endothelial profiles (green), and extravascular fibrin(ogen) deposits (red) in the prefrontal subcortical white matter of an age-matched control (Braak I, upper) and AD case (Braak V–VI, lower) (bar = 20 μm). (b, c) Quantification of pericyte coverage (b) and fibrin(ogen)-positive extravascular deposits (c) in the prefrontal subcortical white matter of controls (n=15) and AD cases (n=16). Mean ± SEM. See Supplementary Table 1 for clinical and neuropathological characteristics. (d) Representative blood-axon barrier permeability constant (Ktrans) maps in the corpus callosum (CC) of 16-week old F7/F7 and age-matched littermate control (+/+) mice generated from dynamic contrast-enhanced magnetic resonance imaging (MRI) scans. (e) The regional Ktrans CC values in 4-6-, 12-16-, and 36-48-week old F7/F7 (green) and age-matched littermate control (+/+; blue) mice. Mean ± SEM; n=6 4-6-week old mice per group; n=7 12-16-week old mice per group; n=5 36-48-week old mice per group. (f, g) CD13-positive pericyte coverage (magenta) and lectin-positive endothelial profiles (blue) in the CC of 12-week old F7/F7 and control (+/+) mice (f, bar = 40 μm), and quantification of pericyte coverage in the CC of 2-, 4-6-, 12-16-, and 36-48-week old F7/F7 (green) and control (+/+, blue) mice (g). Mean ± SEM; n=6 mice per group. (f, h) Fibrin(ogen)-positive extravascular deposits (green) and lectin-positive endothelial profiles (blue) in the CC of 12-week old F7/F7 and control (+/+) mice (f, bar = 40 μm), and quantification of fibrin(ogen) deposits in the CC of 2-, 4-6-, 12-16-, and 36-48-week old F7/F7 (green) and control (+/+, blue) mice (h). Mean ± SEM; n=6 mice per group. (i) Representative images of 5 independent replicates of the CC showing lectin-positive endothelial profiles (white) and cellular uptake of Alexa Fluor 555-conjugated cadaverine (red) in 2-week old F7/F7 and control (+/+) mice (bar = 20 μm). (j) Negative correlation between fibrin(ogen) extravascular deposits and pericyte coverage in the CC; n=36 individual points from F7/F7 and control (+/+) mice at different age; r2, Pearson's coefficient. (k) Fibrin(ogen) deposits in the CC and internal capsule (IC), and the primary somatosensory barrel cortex (S1Cx) and dorsal hippocampus (Hipp) of the grey matter in 12-16-week old F7/F7 and control (+/+) mice. Mean ± SEM; n=6 mice per group for CC and n=5 mice per group for IC, S1Cx and Hipp. (l, m) High-resolution T2*-weighted images (sagittal plane) of iron-containing hemosiderin deposits (red dots) in 16-week old F7/F7 (upper) and control (+/+, lower) mice (l), and quantification of hemosiderin deposits in the white matter (CC and IC) and grey matter (Cx and Hipp) regions in 12-16-week old F7/F7 mice and control (+/+) mice (m). Mean ± SEM; n=6 mice per group. (n) The blood flow maps in the CC in 16-week old F7/F7 and littermate control (+/+) mice generated from dynamic contrast-susceptibility MRI scans. (o) The regional blood flow values in CC in 4-6-, 12-16-, and 36-48-week old F7/F7 (green) and littermate control (+/+, blue) mice. Mean ± SEM; n=6 4-6-week old mice per group; n=7 12-16-week old mice per group; n=5 36-48-week old mice per group. In e, g, h, and o, one-way ANOVA and Bonferroni's post hoc tests were used. Unpaired two-tailed Student's t-tests were used for panels b, c, k and m; ns=non-significant (p>0.05).
Figure 2
Figure 2. White matter structural changes and loss of connectivity in pericyte-deficient mice
(a-c) Total white matter (a), cortical mantles (b), and hippocampus (c) volumes in 4-6-, 12-16-, and 36-48-week old F7/F7 (green) and age-matched littermate control (+/+, blue) mice. Mean ± SD; n=6 4-6-week old mice per group; n=7 12-16-week old mice per group; n=7 36-48-week old mice per group. (d-f) Probabilistic P-value maps for fractional anisotropy generated from diffusion tensor imaging (DTI)-MRI scans in 4-6- (d), 12-16- (e), and 36-48-week (f) old F7/F7 and control (+/+) mice. Yellow-Red voxels, statistically significant changes in the white matter tracts in 12-16-week old (e) and 36-48-week old (f) F7/F7 mice compared to their age-matched littermate controls (+/+) by searchlight-based multivoxel pattern analysis (see Online Methods). No changes were found in younger 4-6-week old (d) F7/F7 mice. P-value color scale from 0.01 to 1×10⁻⁴; n=6 4-6-week old mice per group; n=7 12-16-week old mice per group; n=7 36-48-week old mice per group. (g) Fiber tract maps of the corpus callosum (CC, red) and cingulum (Cing, green) generated from DTI-MRI scans in 16-week old control (+/+, upper), 16-week old F7/F7 (middle), and 48-week old F7/F7 (lower) mice. (h-i) Fiber density quantification in the CC (h) and Cing (i) from reconstructed tract maps. Mean ± SEM; n=5 mice per group. (j) A diagram showing the injection site in the ipsilateral primary somatosensory barrel cortex (iS1Cx) of adeno-associated virus expressing green fluorescent protein (AAV-eGFP) used for the anterograde tract-tracing, and the studied labeled fiber projections from the iS1Cx to the contralateral S1Cx cortex (cS1Cx), through the CC, and towards the internal capsule (IC). Lower panels denote 3D-labeled projections towards the contralateral cS1Cx 21 days after injection of AAV-eGFP neuron labeling in the ipsilateral iS1Cx of 16-week old F7/F7 and control (+/+) mice (bar = 100 μm). (k) Quantification of integrated projection density of indicated brain regions in 4-6-, 12-16-, and 36-48-week old F7/F7 (green) and control (+/+, blue) mice. Mean ± SD; n=5 mice per group. In panels a, b, c, h, i, and k, one-way ANOVA and Bonferroni's post hoc tests were used; ns=non-significant (p>0.05).
Figure 3
Figure 3. White matter-related functional deficits in pericyte-deficient mice
(a) Maximum velocity on regular and complex running wheel in 4-6-, 12-16-, and 36-48-week old F7/F7 (green) and control (+/+, blue) mice. Mean ± SEM; n=8 mice per group. (b, c) Diagram showing the number of revisiting errors for baiting on radial 8-arm maze test in 4- and 16-week old F7/F7 (green) and control (+/+, blue) mice (b; solid lines, first entries; dotted lines, revisiting errors), and quantification (c) in 4-6- and 12-16-week old F7/F7 (green) and control (+/+, blue) mice. Mean ± SEM; n=8 mice per group. (d) Novel object recognition (NOR) in 4-6-, 12-16-, and 36-48-week old F7/F7 (green) and +/+ control (blue) mice. Mean ± SEM; n=8 4-6-week old mice per group; n=11 12-16-week old mice per group; n=8 36-48-week old mice per group. (e) Cued and contextual fear conditioning tests in 4-6 and 12-16-week old F7/F7 (green) and +/+ control (blue) mice. Mean ± SEM; n=8 4-6-week old mice per group; n=11 (cued) and 8 (contextual) 12-16-week old mice per group. (f, g) Nesting (f) and burrowing (g) tests in 4-6-, 12-16-, and 36-48-week old F7/F7 (green) and +/+ control (blue) mice. Mean ± SEM; n=8 4-6-week old mice per group; n=11 12-16-week old mice per group; n=8 36-48-week old mice per group. In panels a and c-g, one-way ANOVA and Bonferroni's post hoc tests were used.
Figure 4
Figure 4. Pericyte-deficient mice develop an early axon degeneration and loss of myelin
(a) Electron microscopy analysis of the medial corpus callosum (CC) in 4-, 16-, and 48-week old F7/F7 and control (+/+) mice. Yellow arrowheads, thinner myelin sheaths; purple stars, degenerated axons (bar = 0.5 μm). (b-d) Quantification of the number of degenerated axons (b), total number of axons (c), and g-ratio (d) in the CC of 4-6-, 12-16-, and 36-48-week old F7/F7 (green) and control (+/+, blue) mice. Mean ± SEM; n=3 mice per group. (e) Immunostaining of myelin basic protein (MBP), neuritic marker SMI-312, and 4′,6-diamidino-2-phenylindole (Dapi) nuclear stain in the CC (coronal sections) of 36-week old F7/F7 and control (+/+) mice (bar = 100 μm); white bars illustrate CC thickness; stars show MBP and SMI-312 loss. (f, g) Quantification of MBP (f) and SMI-312 (g) immunoreactivity in 4-6-, 12-16-, and 36-48-week old F7/F7 (green) and +/+ (blue) mice. Mean ± SEM; n=5 mice per group. (h) Luxol fast blue and cresyl violet staining in the CC of 36-week old F7/F7 and +/+ control mice (bar = 100 μm); stars, vacuoles. Representative of 3 independent replicates. (i) Fazekas score for white matter damage in the CC of in 4-6-, 12-16-, and 36-48-week old F7/F7 (green) and control (+/+, blue) mice. Mean ± SEM; n=3 mice per group. (j) Immunostaining for MBP and endothelial lectin in the anterior cingulum (AC) tract of 16-week old F7/F7 and control (+/+) mice (bar = 20 μm); yellow arrows, enlarged perivascular spaces (EPVS). Insets, high magnification boxed regions; white star, EPVS. (k) Quantification of EPVS per mm2 CC tissue in 4-6-, 12-16-, and 36-48-week old F7/F7 (green) and control (+/+, blue) mice. Mean ± SEM; n=3 mice per group. (l) MBP immunoblotting of white matter homogenates (pooled corpus callosum, internal capsule, external capsule, cingulum) from 4-6, 12-16, and 36-48-week old F7/F7 and +/+ mice. β-tub, β-tubulin loading control. (m) MBP relative abundance in 4-6-, 12-16-, and 36-48-week old F7/F7 (green) and control (+/+, blue) mice. Mean ± SEM; n=3 mice per group. (n) Bright field microscopy (hematoxylin staining) of the primary somatosensory barrel cortex (S1Cx) and CA1 hippocampus subfield (Hipp) in 16-week old F7/F7 and control (+/+) mice (bar = 50 μm). Representative of 3 independent replicates. (o) Quantification of NeuN-positive neurons in the S1Cx region (layers IV-V) and CA1 hippocampus subfield in 4-6-, 12-16-, and 36-48-week old F7/F7 (green) and control (+/+, blue) mice. Mean ± SEM; n=5 mice per group. In panels b-d, f, g, i, k, m, and o, one-way ANOVA and Bonferroni's post hoc tests were used. See Fig. S17 for full scans of all western blots for MBP shown in panel l.
Figure 5
Figure 5. Loss of mature oligodendrocytes in pericyte-deficient mice and fibrinogen and fibrin toxicity to mouse oligodendrocytes
(a) Confocal images (bar = 20 μm) of Olig2 (oligodendrocyte marker), myelin basic protein (MBP), and terminal deoxynucleotidyl transferase dUTP nick end labeling (TUNEL) staining in the CC of 16-week old F7/F7 and control (+/+) mice. Arrows, Olig2- and TUNEL-double positive cells. (b, c) Quantification of Olig2- and TUNEL-double positive cells (b) and Olig2-positive cells (c) in the CC of F7/F7 (green) and control (+/+, blue) mice from 4-6, 12-16, and 36-48 weeks of age. Mean ± SEM; n=3 mice per group. (d) Confocal images (bar = 20 μm) of Olig2, platelet-derived growth factor receptor α (PDGFRα) and cyclic nucleotide phosphodiesterase (CNPase) in the CC of 16-week old F7/F7 and control (+/+) mice). (e, f) Quantification of Olig2- and PDGFRα -double positive oligodendrocyte progenitor cells (e) and Olig2- and CNPase-double positive myelinated mature oligodendrocytes (f) in the CC of 4-6-, 12-16-, and 36-48-week old F7/F7 (green) and +/+ control (blue) mice. Mean ± SEM; n=3 mice per group. (g, h) Representative dot plots of the flow cytometry analysis of MBP-Alexa647 positive and proteolipid protein (PLP)-Alexa488 positive myelinated mature oligodendrocytes (OLs) (isolated from white matter) from 3 independent experiments in 12-16-week old F7/F7 and +/+ mice (g), and quantification of MBP- and PLP-double positive myelinated mature OLs (h) in 4-6, 12-16, and 36-48-week old F7/F7 (green) and control (+/+, blue) animals. Mean ± SEM; n=3 mice per group. (i, j) Confocal analysis of hypoxyprobe-1 (pimonidazole)-positive hypoxic tissue (O2<10 mmHg) in the CC in 16-week old F7/F7 and +/+ mice (i, bar = 5 μm), and quantification of hypoxyprobe-1-positive area (j) expressed as the percentage of total tissue in the CC of 4-6- and 12-16-week old F7/F7 (green) and control (+/+, blue) mice. Mean ± SEM; n=3 mice per group. (k, l) Confocal images of MBP- and TUNEL-double positive cultured primary mouse OLs subjected to oxygen and glucose deprivation (OGD) or vehicle for 6 h (k, bar = 20 μm), and quantification of MBP- and TUNEL-double positive OLs subjected to OGD or vehicle for 6 h, or treated with fibrinogen (1.5 mg/mL) for 6 h (light grey) and 12 h (dark grey) (l). Mean ± SEM from 3 independent experiments (each 5 coverslips averaged per experiment). (m) Representative images (bar = 10 μm) of two MBP- and fibrinogen-double positive OLs. Orthogonal views show internalization of fibrinogen 6 hours after treatment (1.5 mg/mL). Representative of 5 independent replicates. (n-p) Western blots of autophagy markers LC3-I, LC3-II, and p62 (n) and their quantification (o, p) in primary mouse OLs cell lysates after treatment with fibrinogen (1.5 mg/mL), fibrin fibrils (0.1 mg/mL, see Fig. S13g) or vehicle for 12 h with or without MHY1485 (2 μM), a mTOR activator which inhibits autophagy. Western blots are representative of 3 independent experiments. Scanning densitometry of LC3-I, LC3-II, and p62 bands, and LC3-II/LC3-I ratio (o) and p62 relative abundance (p) normalized with β-actin. For o and p, mean ± SEM are from 3 independent experiments. (q) Caspase 3 activity at 12 and 24 h after treatment with vehicle, fibrinogen (1.5 mg/mL) or fibrin fibrils (0.1 mg/mL) with and without autophagy inhibitors MHY1485 (2 μM) or inhibitor VII (100 μM). Mean ± SEM; n=3 independent experiments. (r) Live cells quantified by live and dead assay 24 h after treatment of mature OLs and astrocytes with vehicle, fibrinogen (1.5 mg/mL) or fibrin fibrils (0.1 mg/mL). OLs were also treated with autophagy inhibitors MHY1485 (2 μM) or inhibitor VII (100 μM). Hirudin (4 U/mL) was added to all cultures except in vehicle-control (grey filled circles). Mean ± SEM; n=5 independent experiments (each 3 coverslips averaged per experiment). In all panels, one-way ANOVA and Bonferroni's post hoc tests were used; ns=non-significant (p>0.05). See Fig. S17 for full scans of all western blots for LC3-I, LC3-II, and p62 shown in panel n.
Figure 6
Figure 6. White matter changes in pericyte-deficient mice after pharmacological or genetic manipulations of systemic fibrinogen levels
(a) Extravascular fibrin(ogen) deposits in the corpus callosum (CC) of 12-week old F7/F7 mice treated with vehicle, ancrod and tranexamic acid (TXA) (upper panels); or F7/F7 mice crossed with fibrinogen-(Fga) deficient +/- mice compared to littermate Fga+/+ controls (middle panels); or F7/F7 mice treated with control scrambled siRNA or plasminogen (Plg) siRNA for 7 days (lower panels), as described in Methods (bar = 10 μm). (b-c) Quantification of fibrin(ogen)-positive extravascular deposits (b) and CD13-positive pericyte coverage (c) in the CC of 12-week old F7/F7 (green) and control (+/+, blue) mice. Mean ± SD; n=5 vehicle +/+ and 6 F7/F7 mice; n=6 ancrod-treated +/+ and 5 ancrod-treated F7/F7 mice; n=5 TXA-treated +/+ and F7/F7 mice; n=5 F7/F7; Fga+/+, F7/F7; Fga+/-, F7/F7 + scrambled siRNA, and F7/F7 + Plg siRNA. (d) The Ktrans capillary permeability constant in the CC of 12-week old F7/F7 (green) and littermate control (+/+, blue). Values were generated from dynamic contrast-enhanced MRI scans. Mean ± SD; n=6 vehicle +/+ and F7/F7 mice; n=6 ancrod-treated +/+ and F7/F7 mice; n=5 TXA-treated +/+ and F7/F7 mice; n=6 F7/F7; Fga+/+, F7/F7; Fga+/-, F7/F7 + scrambled siRNA, and F7/F7 + Plg siRNA. (e, f) High-resolution T2*-weighted images (sagittal plane) of iron-containing hemosiderin deposits (red dots) in the CC of 12-week old F7/F7 mice treated with ancrod, TXA or vehicle, crossed with Fga+/- compared to littermate Fga+/+ control mice, and treated with scrambled siRNA or Plg siRNA (e), and quantification of hemosiderin deposits in the CC of 12-week old F7/F7 (green) and control (+/+, blue) mice (f). Mean ± SD; n=6 vehicle +/+ and F7/F7 mice; n=6 ancrod-treated +/+ and F7/F7 mice; n=5 TXA-treated +/+ and F7/F7 mice; n=6 F7/F7; Fga+/+, F7/F7; Fga+/-, F7/F7 + scrambled siRNA, and F7/F7 + Plg siRNA. (g) The blood flow values in the CC of 12-week old F7/F7 (green) and littermate control (+/+, blue) mice generated from dynamic susceptibility-contrast MRI scans. Mean ± SD; n=6 vehicle +/+ and F7/F7 mice; n=6 ancrod-treated +/+ and F7/F7 mice; n=5 TXA-treated +/+ and F7/F7 mice; n=6 F7/F7; Fga+/+, F7/F7; Fga+/-, F7/F7 + scrambled siRNA, and F7/F7 + Plg siRNA. (h) Total white matter volume in the CC of 12-week old F7/F7 (green) and littermate control (+/+, blue) mice. Values were generated from diffusion tensor imaging MRI scans. Mean ± SD; n=6 vehicle +/+ and F7/F7 mice; n=6 ancrod-treated +/+ and F7/F7 mice; n=5 TXA-treated +/+ and F7/F7 mice; n=6 F7/F7; Fga+/+, F7/F7; Fga+/-, F7/F7 + scrambled siRNA, and F7/F7 + Plg siRNA. (i) Quantification of Olig2-positive cells in the CC of 12-week old F7/F7 (green) and littermate control (+/+, blue) mice. Mean ± SD; n=5 mice per group. All data were compared by one-way ANOVA and Bonferroni's post hoc; ns=non-significant (p>0.05).

References

    1. Wardlaw JM, et al. Neuroimaging standards for research into small vessel disease and its contribution to ageing and neurodegeneration. Lancet Neurol. 2013;12:822–838. - PMC - PubMed
    1. Iadecola C. The pathobiology of vascular dementia. Neuron. 2013;80:844–866. - PMC - PubMed
    1. Snyder HM, et al. Vascular contributions to cognitive impairment and dementia including Alzheimer's disease. Alzheimers Dement J Alzheimers Assoc. 2015;11:710–717. - PMC - PubMed
    1. Hachinski V World Stroke Organization. Stroke and Potentially Preventable Dementias Proclamation: Updated World Stroke Day Proclamation. Stroke J Cereb Circ. 2015;46:3039–3040. - PubMed
    1. Phillips OR, et al. The superficial white matter in Alzheimer's disease. Hum Brain Mapp. 2016;37:1321–1334. - PMC - PubMed

Publication types

MeSH terms