. 2018 Mar;24(3):313-325.
doi: 10.1038/nm.4490. Epub 2018 Feb 5.

Haploinsufficiency leads to neurodegeneration in C9ORF72 ALS/FTD human induced motor neurons

Affiliations

Haploinsufficiency leads to neurodegeneration in C9ORF72 ALS/FTD human induced motor neurons

Yingxiao Shi et al. Nat Med. 2018 Mar.

Abstract

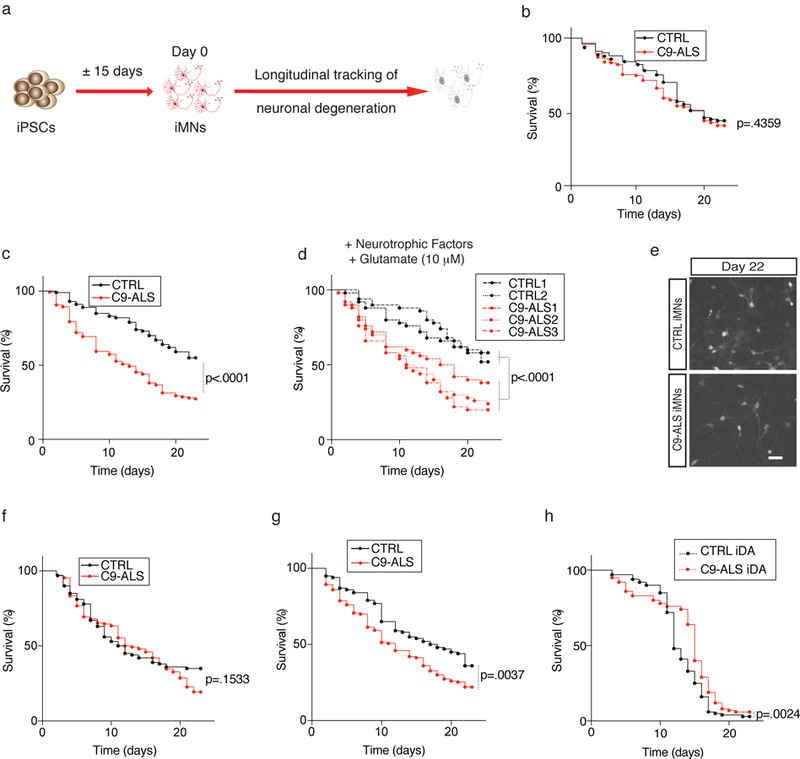
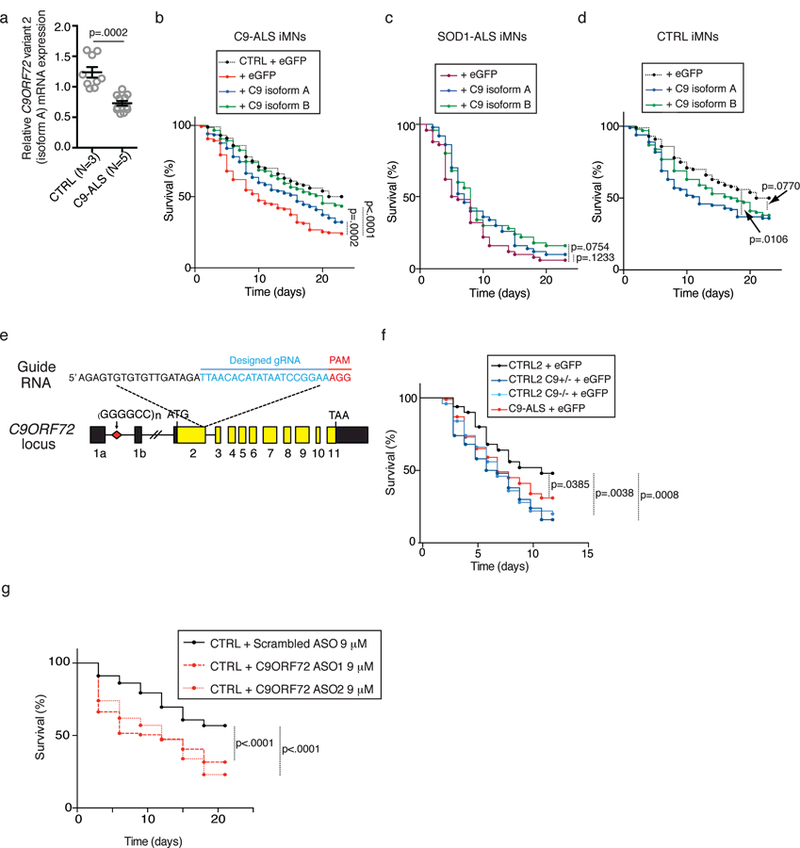
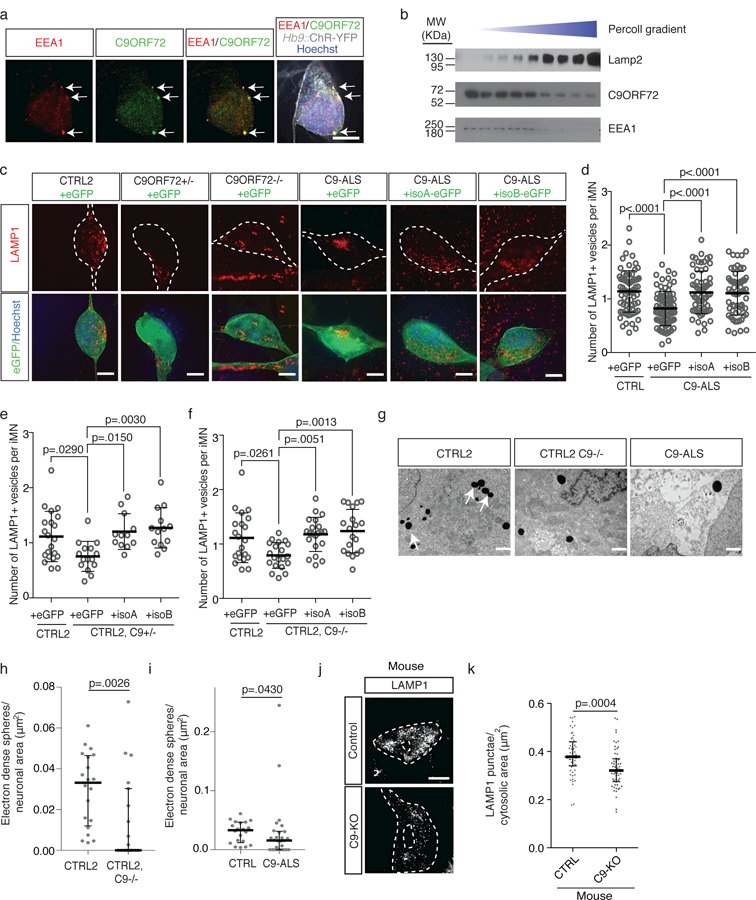
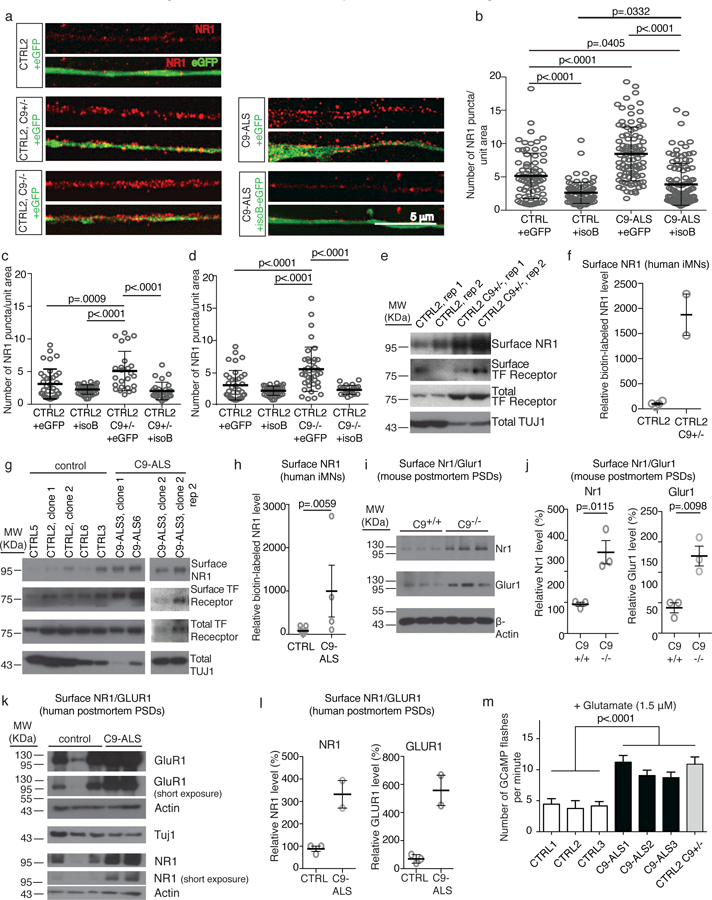
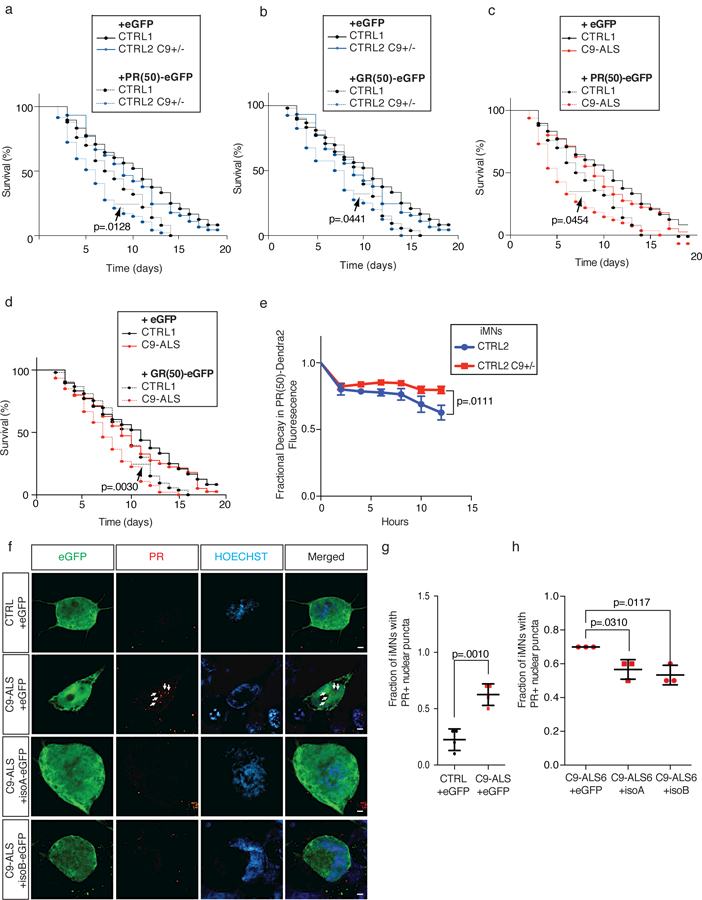
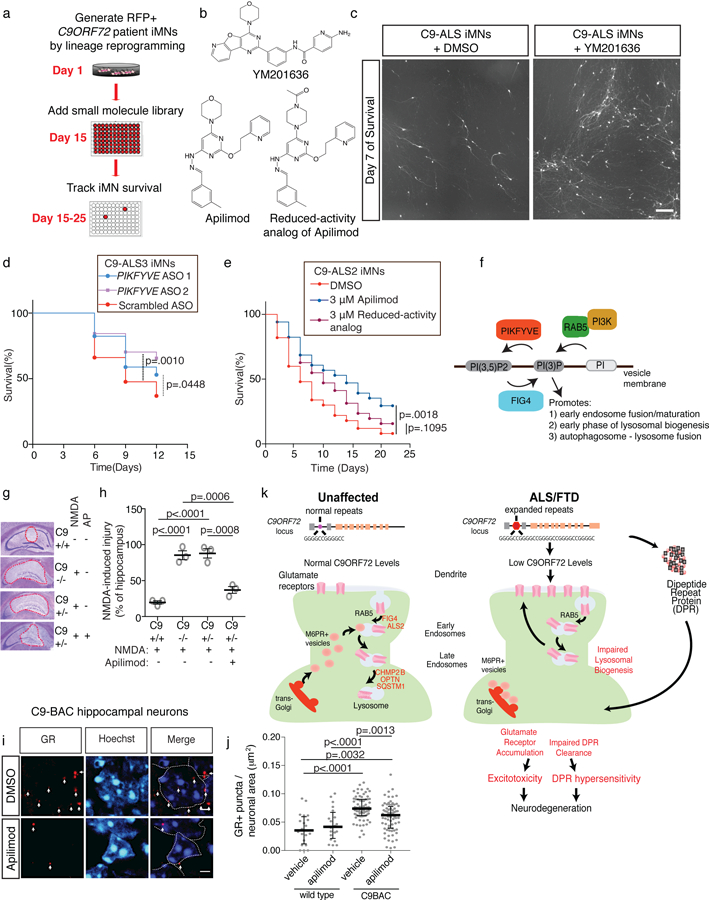
An intronic GGGGCC repeat expansion in C9ORF72 is the most common cause of amyotrophic lateral sclerosis (ALS) and frontotemporal dementia (FTD), but the pathogenic mechanism of this repeat remains unclear. Using human induced motor neurons (iMNs), we found that repeat-expanded C9ORF72 was haploinsufficient in ALS. We found that C9ORF72 interacted with endosomes and was required for normal vesicle trafficking and lysosomal biogenesis in motor neurons. Repeat expansion reduced C9ORF72 expression, triggering neurodegeneration through two mechanisms: accumulation of glutamate receptors, leading to excitotoxicity, and impaired clearance of neurotoxic dipeptide repeat proteins derived from the repeat expansion. Thus, cooperativity between gain- and loss-of-function mechanisms led to neurodegeneration. Restoring C9ORF72 levels or augmenting its function with constitutively active RAB5 or chemical modulators of RAB5 effectors rescued patient neuron survival and ameliorated neurodegenerative processes in both gain- and loss-of-function C9ORF72 mouse models. Thus, modulating vesicle trafficking was able to rescue neurodegeneration caused by the C9ORF72 repeat expansion. Coupled with rare mutations in ALS2, FIG4, CHMP2B, OPTN and SQSTM1, our results reveal mechanistic convergence on vesicle trafficking in ALS and FTD.


Conflict of interest statement

Competing financial interests

J.K.I. and P.A. are co-founders of Acurastem, Inc. P.A. is an employee of Icagen Corporation. J.K.I. and P.A. declare that they are bound by confidentiality agreements that prevent them from disclosing details of their financial interests in this work. S-J.L. is a founder of DRVision Technologies and T-Y.C. is an employee of DRVision Technologies. A.Z. and J.A.C. are co-founders of Verge Genomics and V.H-S., N.W., and T.G.B. are employees of Verge Genomics.

Figures

Figure 1.
Figure 1.. C9ORF72 patient iMNs undergo rapid neurodegeneration.
(a) Production of Hb9::RFP+ iMNs and survival tracking by time-lapse microscopy. (b-d) Survival of control (CTRL) and C9ORF72 patient (C9-ALS) iMNs with neurotrophic factors (b) or in excess glutamate (shown with iMNs from all lines in aggregate (b, c) or for each individual line separately (d)). For (b-d), n=50 iMNs per line for 2 control and 3 C9-ALS lines, iMNs quantified from 3 biologically independent iMN conversions per line. (e) iMNs at day 22 in excess glutamate. This experiment was repeated three times with similar results. (f-g) Survival of control and C9-ALS iMNs in excess glutamate with glutamate receptor antagonists (f) or without neurotrophic factors (g). For (f-g), n=50 iMNs per line for 2 control and 3 C9-ALS lines, iMNs quantified from 3 biologically independent iMN conversions per line. (h) Survival of induced dopaminergic (iDA) neurons in excess glutamate. n=50 iMNs per line for 2 control and 2 C9-ALS lines, iMNs quantified from 3 biologically independent iMN conversions per line. Except in (d), each trace includes neurons from at least 2 donors with the specified genotype; see full detail in Methods. Scale bar: 100 μm (e). All iMN survival experiments were analyzed by two-sided log-rank test, and statistical significance was calculated using the entire survival time course. iMN survival experiments in (b-g) were performed in a Nikon Biostation and experiments in (h) were performed in a Molecular Devices ImageExpress.
Figure 2.
Figure 2.. C9ORF72 protein levels determine iMN survival.
(a) The levels of C9ORF72 variant 2 mRNA transcript (encoding isoform A). Values are mean ± s.e.m., two-tailed t-test with Welch’s correction. t-value: 5.347, degrees of freedom: 11.08. n= 9 biologically independent iMN conversions from 3 control lines and 12 biologically independent iMN conversions from 5 C9-ALS lines. (b–d) iMN survival in excess glutamate following introduction of C9ORF72 (C9 isoform A or B) into C9ORF72 patient iMNs (b), but not control (b, d) or SOD1-ALS iMNs (c). For (b), n=50 iMNs per line for 2 control and 3 C9-ALS lines, iMNs quantified from 3 biologically independent iMN conversions per line. For (c), n=50 iMNs per condition, iMNs scored from 3 biologically independent iMN conversions. For (d), n=50 iMNs per line per condition for 2 control lines, iMNs quantified from 3 biologically independent iMN conversions. Each trace includes iMNs from 2–3 donors with the specified genotype (except SOD1-ALS (c)); see full details in Methods. (e) Strategy for knocking out C9ORF72 from control iPSCs using CRISPR/Cas9. (f) Survival of control (CTRL2) iMNs, the isogenic heterozygous (C9+/−) and homozygous (C9−/−) iMNs and C9ORF72 patient (C9-ALS) iMNs in excess glutamate. n=50 biologically independent iMNs per line per condition for one control and two C9-ALS lines, iMNs quantified from 3 biologically independent iMN conversions. (g) Control iMN survival in excess glutamate with scrambled or C9ORF72 antisense oligonucleotides (ASO). Each trace includes control iMNs from 2 donors. n=50 biologically independent iMNs per line per condition for 2 control lines, iMNs quantified from 3 biologically independent iMN conversions. All iMN survival experiments were analyzed by two-sided log-rank test, and statistical significance was calculated using the entire survival time course. iMN survival experiments in (b, d, and g) were performed in a Nikon Biostation, and (e and f) were performed in a Molecular Devices ImageExpress.
Figure 3.
Figure 3.. Reduced C9ORF72 activity disrupts vesicle trafficking and lysosomal biogenesis in motor neurons.
(a) Super-resolution microscopy images of control iMNs showing colocalization (arrows) of C9ORF72 (green) with EEA1 (red). Scale bar: 5 µm. This experiment was repeated 3 times with similar results. (b) Immunoblot against C9ORF72, EEA1, and LAMP1 on lysates from iPSC-derived motor neurons separated into light (endosomal) and heavy (lysosomal) membrane fractions using percoll gradient centrifugation. This experiment was repeated twice with similar results. (c) Super-resolution microscopy images of LAMP1 immunostaining in iMNs of specified genotypes expressing eGFP or C9ORF72 (isoform A or B)-eGFP. Scale bar: 5 µm. This experiment was repeated 3 times with similar results. (d-f) Number of LAMP1+ vesicles in control (d-f), patient (d), C9ORF72+/− (e), and C9ORF72−/− (f) iMNs overexpressing eGFP or C9ORF72 (isoform A or B)-eGFP. Each grey open circle represents a single iMN, Mean ± s.d. For (d), n=80 (CTRL + GFP), 80 (C9-ALS + GFP), 64 (C9-ALS + isoA), and 61 (C9-ALS + isoB) iMNs quantified from two biologically independent iMN conversions of 3 CTRL or 4 C9-ALS lines. For (e), n=20 (CTRL + GFP), 15 (C9ORF72+/− + GFP), 12 (C9ORF72+/− + isoA), and 13 (C9ORF72+/− + isoB) iMNs f quantified from two biologically independent iMN conversions per condition. For (f), n=20 iMNs quantified from two biologically independent iMN conversions per condition. One-way ANOVA with Tukey correction between CTRL2 and C9ORF72+/− and C9ORF72−/− (e, f), one-way ANOVA with Tukey correction between controls and patient conditions (d). F-value (DFn, DFd): (3, 273)=12.12 (d), (3, 57)=5.64 (e), (3, 77)=6.091 (f). Dotted lines outline iMNs. (g) Representative electron micrographs of control, C9ORF72−/−, and patient iMNs showing lysosomes as electron-dense spherical perinuclear structures (arrows). This experiment was repeated twice with similar results. Scale bar: 1 μm. (h-i) Number of electron-dense spheres per square micron of perinuclear cytosol in control (h-i), C9ORF72−/− (h), and patient iMNs (i) Median ± interquartile range, each data point represents a single cell, Two-sided Mann-Whitney test). For (h), n=20 (CTRL2) and 19 (C9ORF72+/−), and for (i) n=20 (CTRL2) and 26 (C9ORF72 patient) cells quantified from two biologically independent iMN conversions of one line per genotype. (j) Super-resolution microscopy images of Lamp1 immunoreactivity in control and C9-KO mouse spinal neurons. This experiment was repeated twice with similar results. Scale bar: 5 μm. (k) Number of Lamp1+ punctae in Chat+ mouse spinal neurons. Median ± interquartile range, two-tailed t-test. t-value: 3.681. Degrees of freedom: 113. n=59 (CTRL2) and 56 (C9ORF72−/−) cells quantified from sections of two mice per genotype.
Figure 4.
Figure 4.. Low C9ORF72 activity sensitizes neurons to glutamate.
(a) Super-resolution microscopy images of immunofluorescence shows NR1+ puncta on neurites of iMNs overexpressing eGFP or C9ORF72 isoform B-eGFP. Scale bar: 5 µm. This experiment was repeated 3 times with similar results. (b-d) Number of NR1+ puncta per unit area in control (b-d), patient (b), C9ORF72+/− (c), and C9ORF72+/− (d) iMNs. Mean ± s.d. Each grey open circle represents the number of NR1+ puncta per area unit on a single neurite (one neurite quantified per iMN). For (b), n=75 (CTRL + GFP), 84 (C9-ALS + GFP), 95 (C9-ALS + isoA), and 111 (C9-ALS + isoB) iMNs quantified from two biologically independent iMN conversions of 3 CTRL or 4 C9-ALS lines. For (c), n=37 (CTRL + GFP), 37 (C9ORF72+/− + GFP), 25 (C9ORF72+/− + isoA), and 27 (C9ORF72+/− + isoB) iMNs quantified from two biologically independent iMN conversions per condition. For (d), n=37 (CTRL + GFP), 37 (C9ORF72−/− + GFP), 38 (C9ORF72−/− + isoA), and 23 (C9ORF72−/− + isoB) iMNs quantified from two biologically independent iMN conversions per condition. One-way ANOVA with Tukey correction for all comparisons. F-value (DFn, DFd): (3, 360) = 56.63 (b), (3, 122) = 13.42 (c), (3, 131) = 17.11 (d). (e-h) Immunoblotting analysis of surface NR1 after surface protein biotinylation in control (e-h), C9ORF72+/− (e-f), and C9-ALS patient (g-h) iMNs generated with 3 factors (NGN2, ISL1, and LHX3). In (f), n=4 biologically independent iMN conversions from CTRL2 and 2 biologically independent iMN conversions from the C9ORF72+/− line. Mean +/− s.d. In (h), two-tailed Mann-Whitney test. n=11 biologically independent motor neuron cultures from 11 independent control lines and 4 biologically independent motor neuron cultures from 4 independent C9-ALS patient lines. Experiments in (e-h) were repeated twice with similar results. Mean +/− s.e.m. (i-j) Immunoblotting analysis of surface Nr1 and Glur1 in post-synaptic densities (PSDs) from C9orf72 control and knockout mice, two-tailed t-test. t-value: 4.424 (Nr1), 4.632 (Glur1), degrees of freedom: 4 (Nr1), 4 (Glur1). n= 3 control PSD preparations isolated from 3 control mice and 3 C9orf72−/− PSD preparations isolated from 3 C9orf72−/− mice. This experiment was repeated twice with similar results. Mean +/− s.e.m. (k-l) Immunoblotting analysis of surface NR1 and GLUR1 in post-synaptic densities (PSDs) from post mortem control and C9-ALS patient motor cortices, n=3 control and 2 C9-ALS patient PSD preparations isolated from 3 control and 2 C9-ALS patients. This experiment was repeated twice with similar results. Mean +/− s.d. (m) Average Ca2+ flux in the presence of glutamate per minute. n=28 (CTRL1), 15 (CTRL2), 15 (CTRL3), 26 C9-ALS1), 20 (C9-ALS2), 24 (C9-ALS3), and 15 (C9ORF72+/−) iMNs analyzed from two biologically independent iMN conversions for each line. Mean ± s.e.m. One-way ANOVA with Tukey correction between all controls and all patients and C9ORF72+/−. F-value (DFn, DFd): (6, 136) = 11.21.
Figure 5.
Figure 5.. C9ORF72 levels determine dipeptide repeat turnover.
(a-b) Survival of control and CRISPR-mutant iMNs without excess glutamate with overexpression of eGFP or PR(50)-eGFP (a) or GR(50)-eGFP (b). (c-d) Survival of control and C9-ALS iMNs without excess glutamate with overexpression of eGFP or PR(50)-eGFP (c) or GR(50)-eGFP (d). For (a), n=50 (CTRL1 + GFP AND CTRL1 + PR(50)), 49 (C9ORF72+/− + GFP), and 47 (C9ORF72+/− + PR(50)) iMNs per line, iMNs quantified from 3 biologically independent iMN conversions per line. For (b), n=50 (CTRL1 + GFP AND CTRL1 + GR(50)), 49 (C9ORF72+/− + GFP), and 40 (C9ORF72+/− + GR(50)) iMNs per line, iMNs quantified from 3 biologically independent iMN conversions per line. For (c), n=50 (CTRL1 + GFP AND CTRL1 + PR(50)), 50 (from each of two C9-ALS lines + GFP), and 41 (from each of two C9-ALS lines + PR(50)) iMNs per line, iMNs quantified from 3 biologically independent iMN conversions per line per condition. For (d), n=50 (CTRL1 + GFP AND CTRL1 + GR(50)), 50 (from each of two C9-ALS lines + GFP), and 46 and 47 (from two C9-ALS lines + GR(50)) iMNs per line, iMNs quantified from 3 biologically independent iMN conversions per line per condition. All iMN survival experiments in (a-d) were analyzed by two-sided log-rank test, and statistical significance was calculated using the entire survival time course. Survival curves for the “+GFP” condition were included as a reference, but were not used in statistical analyses. (e) Relative decay in Dendra2 fluorescence over 12 hours in iMNs of specified genotypes. Mean +/− s.e.m. n = 18 (control) and 24 (C9ORF72+/−) iMNs quantified from two biologically independent iMN conversions each, two-tailed t-test with Welch’s correction between data points at each time point, t-value: 2.739, degrees of freedom: 25.62). (f-h) Immunostaining to determine endogenous PR+ puncta in control or C9-ALS iMNs with or without overexpression of C9ORF72 isoform A or B. Scale bar = 2 μm. This experiment was repeated twice with similar results. (g) Mean +/− s.d. n= 4 biologically independent iMN conversions generated from two different iPSC lines per genotype. Quantified values represent the average number of PR+ puncta in 40 iMNs from a single iMN conversion. Two-tailed t-test, t-value: 5.908, degrees of freedom: 6. (h) Mean +/− s.e.m. n= 3 biologically independent iMN conversions per condition. Quantified values represent the average number of PR+ puncta in 40 iMNs from a single iMN conversion. One-way ANOVA with Tukey correction, F-value (DFn, DFd): (2, 6)=10.5. iMN survival experiments in (a-d) were performed in a Molecular Devices ImageExpress.
Figure 6.
Figure 6.. Small molecule modulators of vesicle trafficking rescue neurodegeneration in vitro and in vivo.
(a) Phenotypic screening for small molecules that enhance the survival of C9-ALS iMNs. (b) Chemical structure of the PIKFYVE inhibitors YM201636 and Apilimod, and a reduced-activity analog of Apilimod. (c) Live cell images of iMNs at day 7 of treatment with DMSO or YM201636 (scale bar: 1 mm). This experiment was performed 3 times with similar results. (d) Survival effect of scrambled or PIFKVYE ASOs on C9-ALS iMNs in excess glutamate. n=50 iMNs per condition, iMNs quantified from 3 biologically independent iMN conversions per condition. (e) Survival effect of Apilimod and the reduced-activity analog on C9-ALS patient iMNs with neurotrophic factor withdrawal. n=50 iMNs per condition, iMNs quantified from 3 biologically independent iMN conversions per condition. All iMN survival experiments in (d, e) were analyzed by two-sided log-rank test, and statistical significance was calculated using the entire survival time course. (f) Activities of therapeutic targets in C9ORF72 ALS. (g, h) The effect of 3 μM Apilimod on NMDA-induced hippocampal injury in control, C9orf72+/−, or C9orf72−/− mice. (Mean +/− s.e.m. of n=3 mice per condition, one-way ANOVA with Tukey correction across all comparisons, F-value (DFn, DFd): (3, 8)=43.55, AP = Apilimod, red dashed lines outline the injury sites). (i, j) The effect of 3 μM Apilimod on the level of GR+ puncta in the dentate gyrus of control or C9-BAC mice. Mean +/− s.d. of the number of GR+ puncta per cell, each data point represents a single cell. n=20 (wild-type + DMSO), 20 (wild-type + Apilimod), 87 (C9-BAC + DMSO), and 87 (C9-BAC + Apilimod) cells quantified from 3 mice per condition, one-way ANOVA with Tukey correction for all comparisons, F-value (DFn, DFd): (3, 180) = 16.29. Scale bars = 2 μm, dotted lines outline nuclei, and white arrows denote GR+ punctae (i). (k) Model for the mechanisms that cooperate to cause neurodegeneration in C9ORF72 ALS/FTD. Proteins in red are known to be mutated in ALS or FTD. iMN survival experiments in (d, e) were performed in a Molecular Devices ImageExpress.

Comment in

References

    1. Renton AE, Chio A & Traynor BJ State of play in amyotrophic lateral sclerosis genetics. Nat Neurosci 17, 17–23 (2014). - PMC - PubMed
    1. Majounie E, et al. Frequency of the C9orf72 hexanucleotide repeat expansion in patients with amyotrophic lateral sclerosis and frontotemporal dementia: a cross-sectional study. Lancet Neurol 11, 323–330 (2012). - PMC - PubMed
    1. DeJesus-Hernandez M, et al. Expanded GGGGCC hexanucleotide repeat in noncoding region of C9ORF72 causes chromosome 9p-linked FTD and ALS. Neuron 72, 245–256 (2011). - PMC - PubMed
    1. Renton AE, et al. A hexanucleotide repeat expansion in C9ORF72 is the cause of chromosome 9p21-linked ALS-FTD. Neuron 72, 257–268 (2011). - PMC - PubMed
    1. Zhang Y, et al. An RNA-sequencing transcriptome and splicing database of glia, neurons, and vascular cells of the cerebral cortex. J Neurosci 34, 11929–11947 (2014). - PMC - PubMed

Publication types

MeSH terms

Supplementary concepts