

HIV-TRACE (TRAnsmission Cluster Engine): a Tool for Large Scale Molecular Epidemiology of HIV-1 and Other Rapidly Evolving Pathogens
- PMID: 29401317
- PMCID: PMC5995201
- DOI: 10.1093/molbev/msy016
HIV-TRACE (TRAnsmission Cluster Engine): a Tool for Large Scale Molecular Epidemiology of HIV-1 and Other Rapidly Evolving Pathogens
Abstract
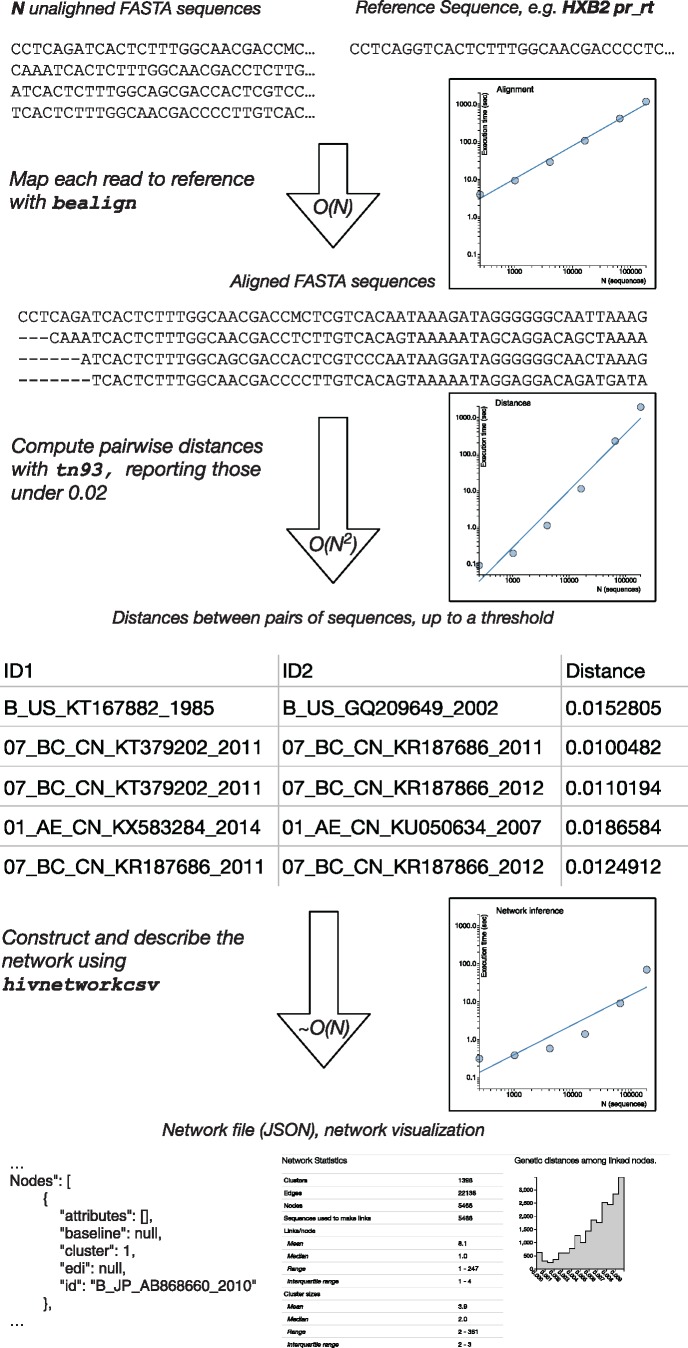
In modern applications of molecular epidemiology, genetic sequence data are routinely used to identify clusters of transmission in rapidly evolving pathogens, most notably HIV-1. Traditional 'shoe-leather' epidemiology infers transmission clusters by tracing chains of partners sharing epidemiological connections (e.g., sexual contact). Here, we present a computational tool for identifying a molecular transmission analog of such clusters: HIV-TRACE (TRAnsmission Cluster Engine). HIV-TRACE implements an approach inspired by traditional epidemiology, by identifying chains of partners whose viral genetic relatedness imply direct or indirect epidemiological connections. Molecular transmission clusters are constructed using codon-aware pairwise alignment to a reference sequence followed by pairwise genetic distance estimation among all sequences. This approach is computationally tractable and is capable of identifying HIV-1 transmission clusters in large surveillance databases comprising tens or hundreds of thousands of sequences in near real time, that is, on the order of minutes to hours. HIV-TRACE is available at www.hivtrace.org and from www.github.com/veg/hivtrace, along with the accompanying result visualization module from www.github.com/veg/hivtrace-viz. Importantly, the approach underlying HIV-TRACE is not limited to the study of HIV-1 and can be applied to study outbreaks and epidemics of other rapidly evolving pathogens.
Figures
References
-
- Bartlett SR, Wertheim JO, Bull RA, Matthews GV, Lamoury FM, Scheffler K, Hellard M, Maher L, Dore GJ, Lloyd AR et al. , . 2017. A molecular transmission network of recent hepatitis C infection in people with and without HIV: implications for targeted treatment strategies. J Viral Hepat. 245:404–411. - PMC - PubMed
-
- Campbell MS, Mullins JI, Hughes JP, Celum C, Wong KG, Raugi DN, Sorensen S, Stoddard JN, Zhao H, Deng W, Partners in Prevention HSV/HIV Transmission Study Team, et al. 2011. Viral linkage in HIV-1 seroconverters and their partners in an HIV-1 prevention clinical trial. PLoS One 63:e16986. - PMC - PubMed
-
- Chaillon A, Avila-Ríos S, Wertheim JO, Dennis A, García-Morales C, Tapia-Trejo D, Mejía-Villatoro C, Pascale JM, Porras-Cortés G, Quant-Durán CJ, Mesoamerican Project Group, et al. 2017. Identification of major routes of HIV transmission throughout Mesoamerica. Infect Genet Evol. 54:98–107. - PMC - PubMed
Publication types
MeSH terms
Grants and funding
LinkOut - more resources
Full Text Sources
Other Literature Sources
Medical
