. 2018 May 31;122(21):5389-5399.
doi: 10.1021/acs.jpcb.7b11367. Epub 2018 Feb 15.

Flex ddG: Rosetta Ensemble-Based Estimation of Changes in Protein-Protein Binding Affinity upon Mutation

Affiliations

Flex ddG: Rosetta Ensemble-Based Estimation of Changes in Protein-Protein Binding Affinity upon Mutation

Kyle A Barlow et al. J Phys Chem B. .

Abstract

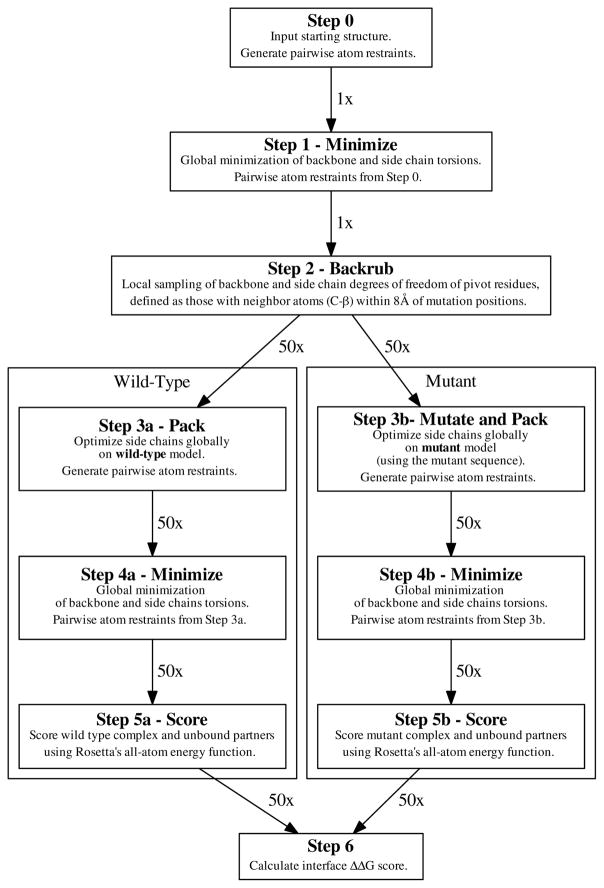
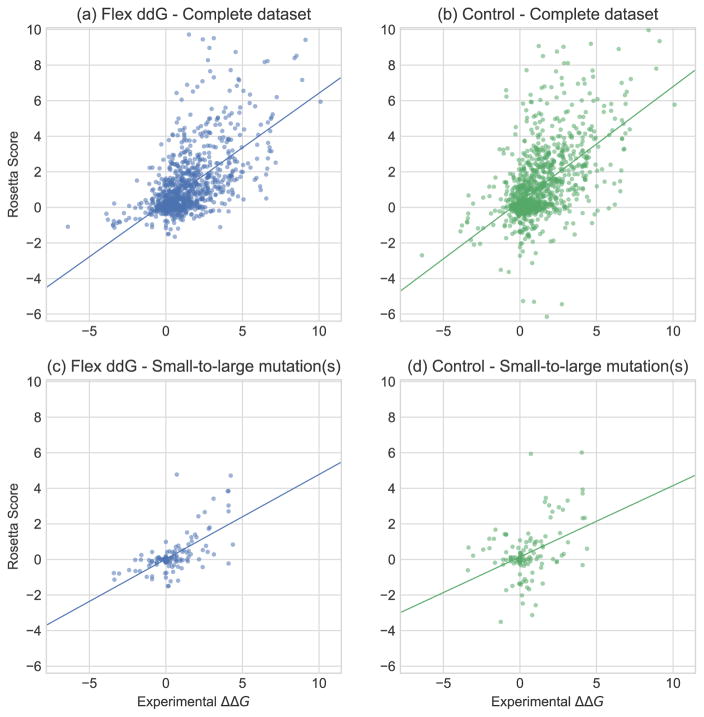
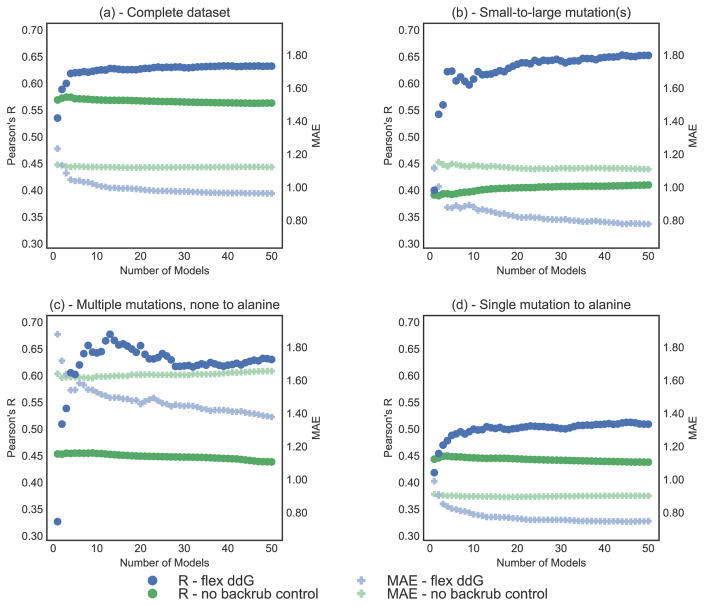
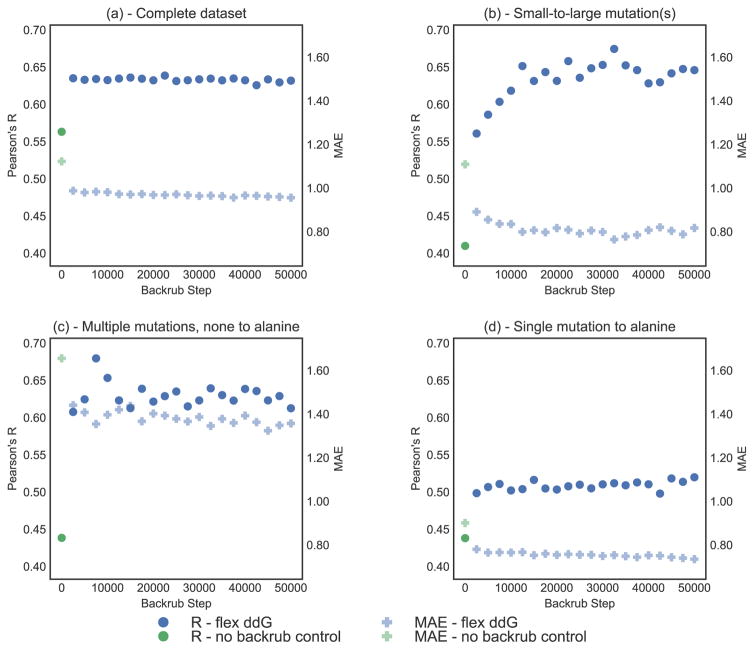
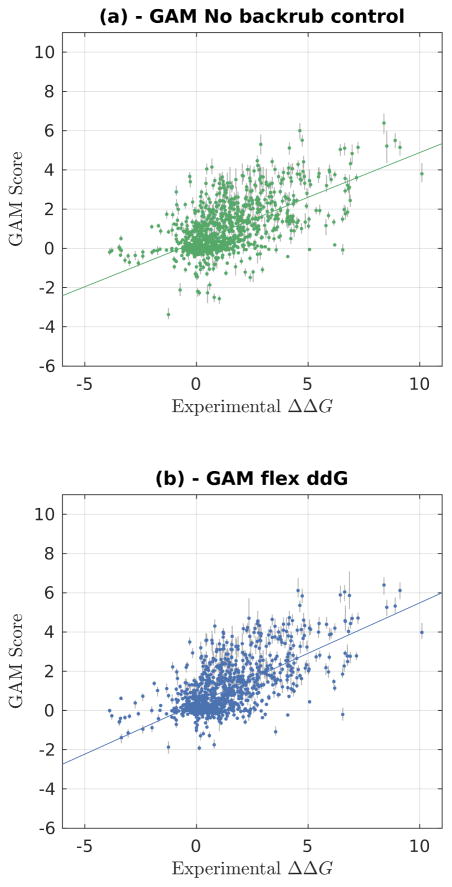
Computationally modeling changes in binding free energies upon mutation (interface ΔΔ G) allows large-scale prediction and perturbation of protein-protein interactions. Additionally, methods that consider and sample relevant conformational plasticity should be able to achieve higher prediction accuracy over methods that do not. To test this hypothesis, we developed a method within the Rosetta macromolecular modeling suite (flex ddG) that samples conformational diversity using "backrub" to generate an ensemble of models and then applies torsion minimization, side chain repacking, and averaging across this ensemble to estimate interface ΔΔ G values. We tested our method on a curated benchmark set of 1240 mutants, and found the method outperformed existing methods that sampled conformational space to a lesser degree. We observed considerable improvements with flex ddG over existing methods on the subset of small side chain to large side chain mutations, as well as for multiple simultaneous non-alanine mutations, stabilizing mutations, and mutations in antibody-antigen interfaces. Finally, we applied a generalized additive model (GAM) approach to the Rosetta energy function; the resulting nonlinear reweighting model improved the agreement with experimentally determined interface ΔΔ G values but also highlighted the necessity of future energy function improvements.


Figures

Figure 1
Figure 1
Schematic of the flex ddG protocol method.
Figure 2
Figure 2
Experimentally determined ΔΔG values (x-axis) versus Rosetta predictions. Rosetta scores are in Rosetta Energy Units (REU) using the Rosetta Talaris energy function. ,, (a) flex ddG method (35000 backrub steps); Complete dataset (n=1240). (b) no backrub control; Complete dataset (n=1240). (c) flex ddG method (35000 backrub steps); Small-to-large mutation(s) (n=130). (d) no backrub control; Small-to-large mutation(s) (n=130).
Figure 3
Figure 3
Correlation (Pearson’s R, left y-axis) and MAE (Mean Absolute Error, right y-axis) vs. number of averaged models (x-axis), on the complete ZEMu set, and subsets. Pearson’s R is shown as circles, and MAE as faded plusses. Predictions generated with the Flex ddG protocol are shown in blue. Predictions generated with the no backrub control protocol are shown in green. A selection of key data underlying this figure can be found in Table S4. Flex ddG is run with 35000 backrub steps. Structures are sorted by their minimized wild-type complex energy. (a) Complete dataset (n = 1240) (b) Small-to-large mutation(s) (n = 130) (c) Multiple mutations, none to alanine (n = 45) (d) Single mutation to alanine (n = 748).
Figure 4
Figure 4
Correlation (Pearson’s R) and MAE (Mean Absolute Error) vs. number of backrub steps, on the complete ZEMu set, and subsets. Pearson’s R is shown as circles, and MAE as faded plusses. Predictions generated with the Flex ddG protocol are shown in blue. Predictions generated with the no backrub control protocol are shown in green. A selection of key data underlying this figure can be found in Table S7. (a) Complete dataset (n=1240) (b) Small-to-large mutation(s) (n=130) (c) Multiple mutations, none to alanine (n=45) (d) Single mutation to alanine (n=748)
Figure 5
Figure 5
Experimentally determined ΔΔG values (x-axis) versus predictions using a Generalized additive model (GAM). The complete dataset is shown. GAM scores are refit from values in Rosetta Energy Units (REU) using the Rosetta Talaris ,, energy function. The error bars in gray represent the range from minimum to maximum fit predicted ΔΔG value for the 1000 sampled GAM models. (a): Control (no backrub) Rosetta predictions. (b): Flex ddG Rosetta predictions using 35,000 backrub steps and 50 output models. A line of best fit is shown in each of the panels.

References

    1. Jubb HC, Pandurangan AP, Turner MA, Ochoa-Montaño B, Blundell TL, Ascher DB. Mutations at Protein-Protein Interfaces: Small Changes Over Big Surfaces Have Large Impacts on Human Health. Progress in Biophysics and Molecular Biology. 2017;128:3–13. doi: 10.1016/j.pbiomolbio.2016.10.002. - DOI - PubMed
    1. Guerois R, Nielsen JE, Serrano L. Predicting Changes in the Stability of Proteins and Protein Complexes: A Study of More Than 1000 Mutations. Journal of Molecular Biology. 2002;320:369–387. doi: 10.1016/S0022-2836(02)00442-4. - DOI - PubMed
    1. Kamisetty H, Ramanathan A, Bailey-Kellogg C, Langmead CJ. Accounting for Conformational Entropy in Predicting Binding Free Energies of Protein-Protein Interactions. Proteins: Structure, Function, and Bioinformatics. 2011;79:444–462. doi: 10.1002/prot.22894. - DOI - PubMed
    1. Dehouck Y, Kwasigroch JM, Rooman M, Gilis D. BeAtMuSiC: Prediction of Changes in Protein-Protein Binding Affinity on Mutations. Nucleic Acids Research. 2013;41:W333–W339. doi: 10.1093/nar/gkt450. - DOI - PMC - PubMed
    1. Moal IH, Fernandez-Recio J. Intermolecular Contact Potentials for Protein-Protein Interactions Extracted From Binding Free Energy Changes Upon Mutation. Journal of Chemical Theory and Computation. 2013;9:3715–3727. doi: 10.1021/ct400295z. - DOI - PubMed

Publication types

LinkOut - more resources