. 2018 May;32(5):2866-2877.
doi: 10.1096/fj.201700984RR. Epub 2018 Jan 10.

Dysregulated bile acid synthesis and dysbiosis are implicated in Western diet-induced systemic inflammation, microglial activation, and reduced neuroplasticity

Affiliations

Dysregulated bile acid synthesis and dysbiosis are implicated in Western diet-induced systemic inflammation, microglial activation, and reduced neuroplasticity

Prasant Kumar Jena et al. FASEB J. 2018 May.

Abstract

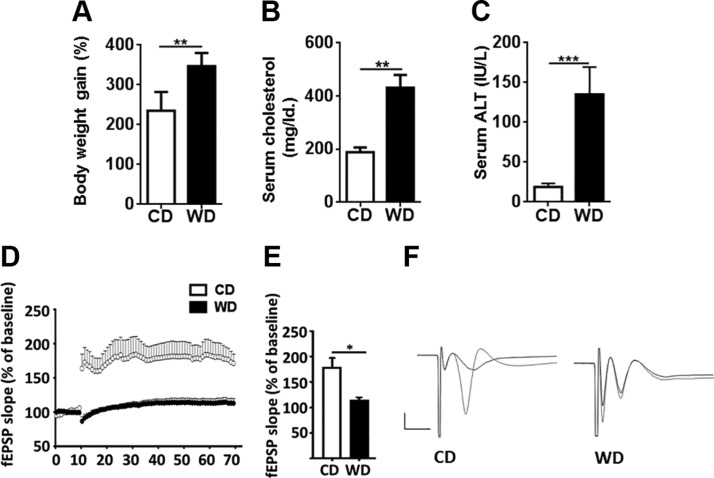
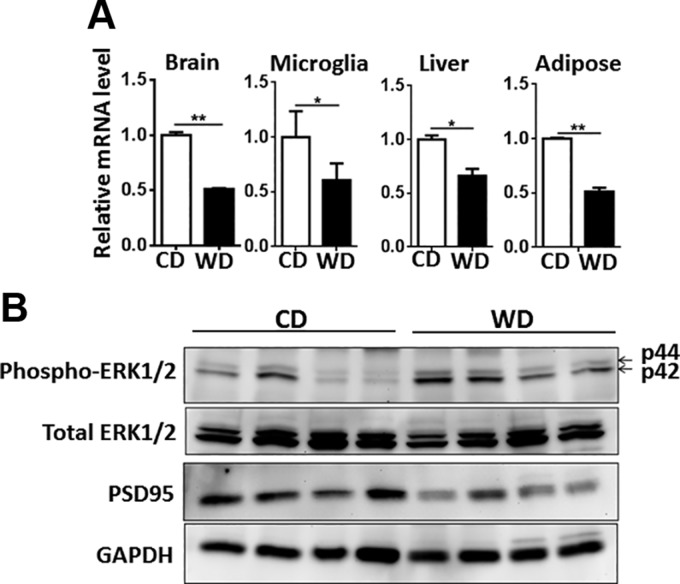
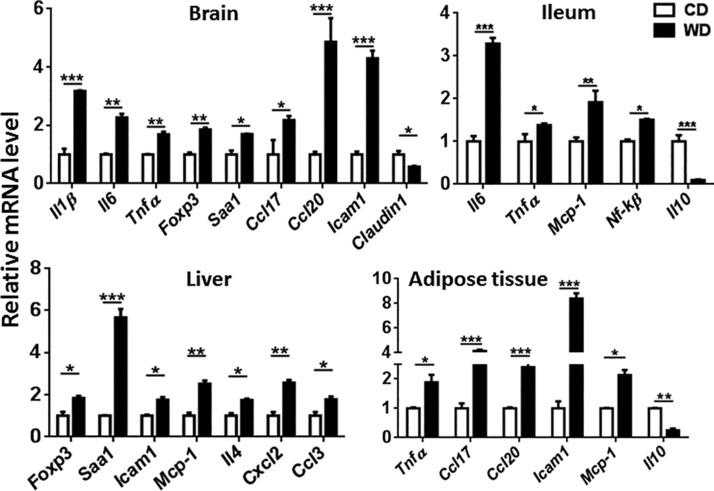
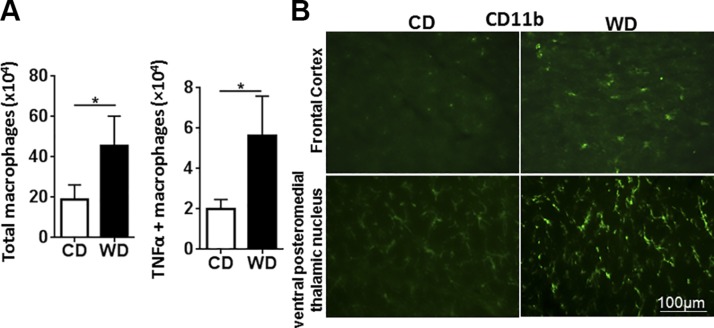
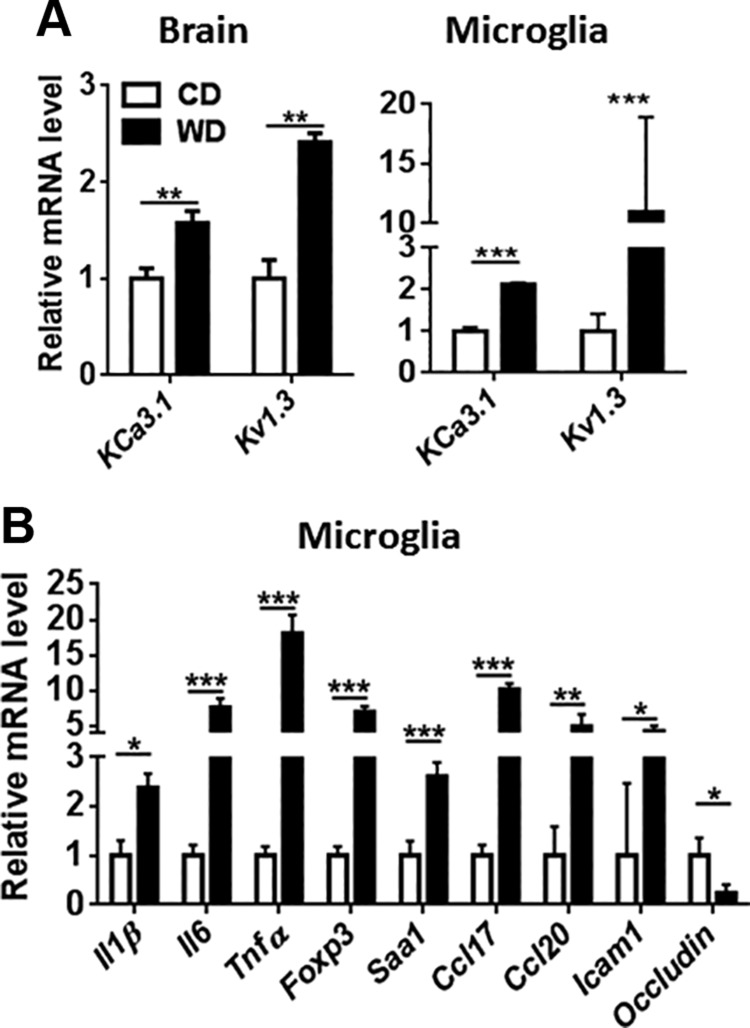
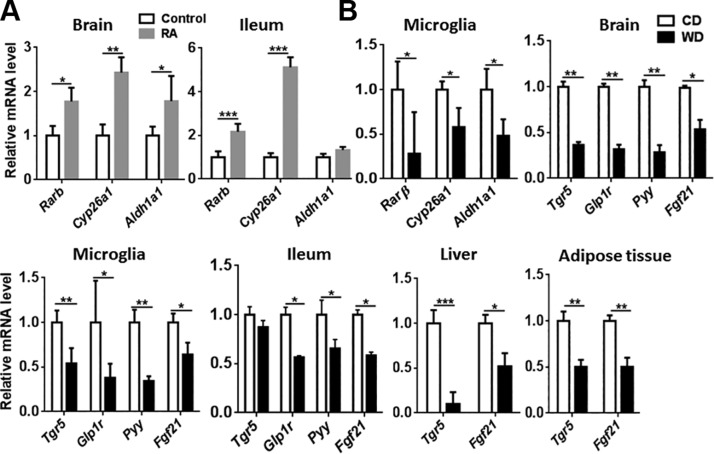
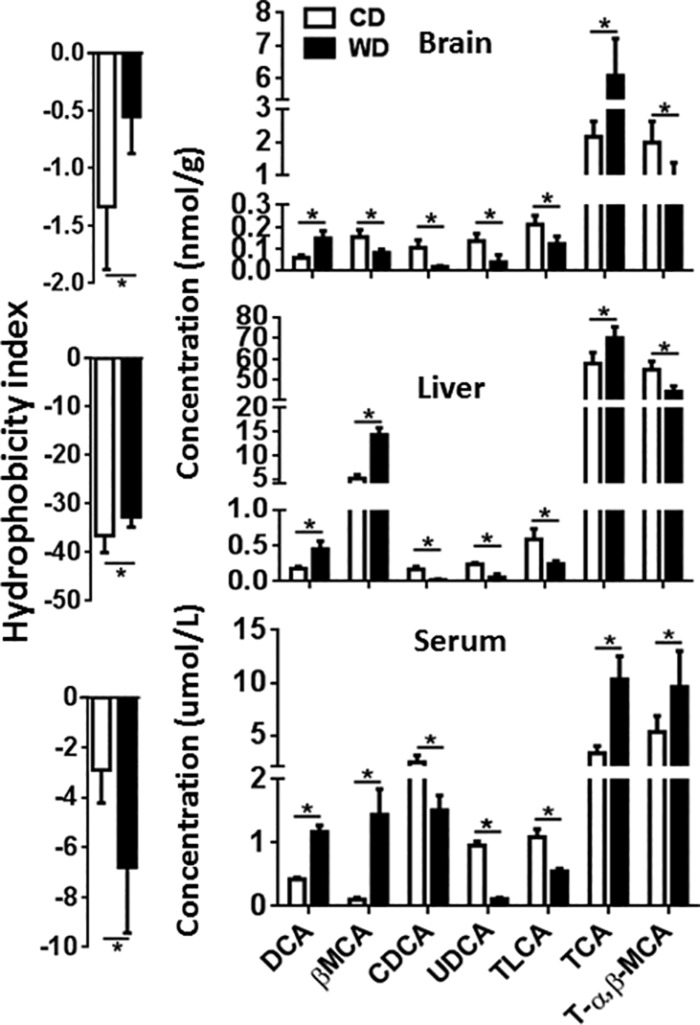
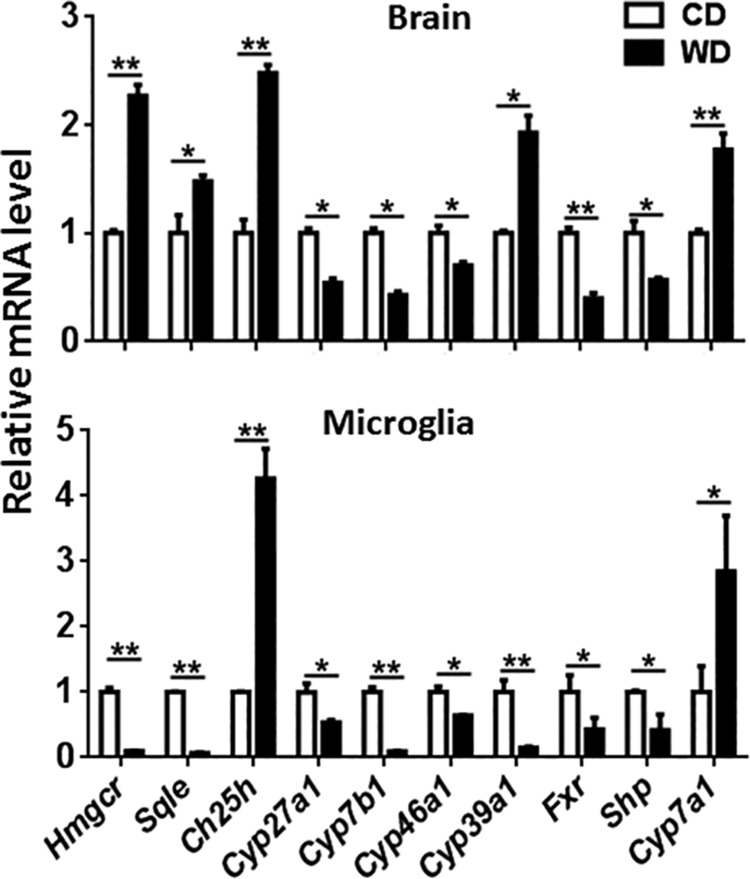
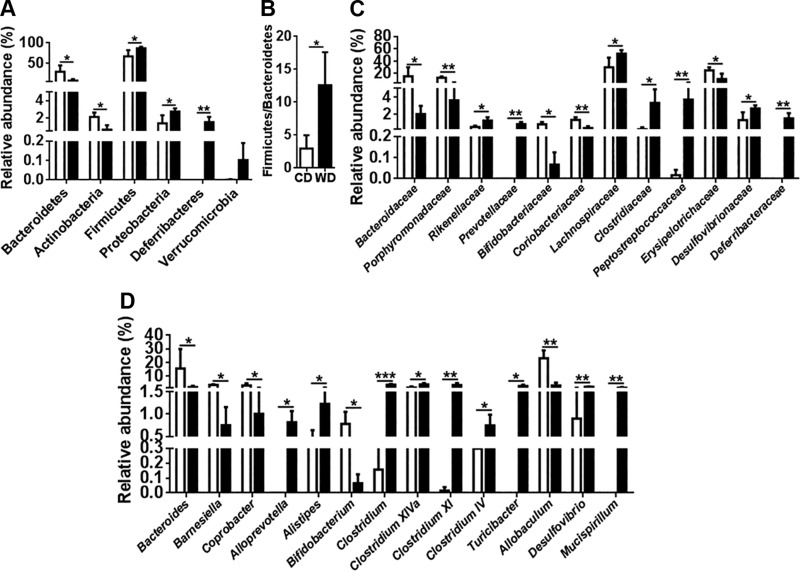
The goal of this study was to identify the intrinsic links that explain the effect of a Western diet (WD) on cognitive dysfunction. Specific pathogen-free, wild-type mice were fed either a control diet (CD) or a high-fat, high-sucrose WD after weaning and were euthanized at 10 mo of age to study the pathways that affect cognitive health. The results showed that long-term WD intake reduced hippocampal synaptic plasticity and the level of brain-derived neurotrophic factor mRNA in the brain and isolated microglia. A WD also activated ERK1/2 and reduced postsynaptic density-95 in the brain, suggesting postsynaptic damage. Moreover, WD-fed mice had increased inflammatory signaling in the brain, ileum, liver, adipose tissue, and spleen, which was accompanied by microglia activation. In the brain, as well as in the digestive tract, a WD reduced signaling regulated by retinoic acid and bile acids (BAs), whose receptors form heterodimers to control metabolism and inflammation. Furthermore, a WD intake caused dysbiosis and dysregulated BA synthesis with reduced endogenous ligands for BA receptors, i.e., farnesoid X receptor and G-protein-coupled bile acid receptor in the liver and brain. Together, dysregulated BA synthesis and dysbiosis were accompanied by systemic inflammation, microglial activation, and reduced neuroplasticity induced by WD.-Jena, P. K., Sheng, L., Di Lucente, J., Jin, L.-W., Maezawa, I., Wan, Y.-J. Y. Dysregulated bile acid synthesis and dysbiosis are implicated in Western diet-induced systemic inflammation, microglial activation, and reduced neuroplasticity.

Keywords: Alzheimer’s disease; FXR; TGR5; cognition; gut microbiota.


Conflict of interest statement

The authors thank Dr. Betty P. Guo for extensive review and editing of this manuscript, and Niki Taylor DeGeorge for editing (both from the University of California, Davis). This study was supported by U.S. National Institutes of Health (NIH) National Cancer Institute Grant U01CA179582, and NIH National Institute on Aging Grants P30AG010129 and R01AG043788. The authors declare no conflicts of interest.

Figures

Figure 1.
Figure 1.
Phenotypic analysis and synaptic deficits present in the CA3–CA1 region of mice. A–C) Percentage of body weight gain (A), serum cholesterol (B), and serum ALT (C) of CD- and WD-fed mice. D–F) Scatter plot showing high-frequency stimulation-induced LTP (D), a bar graph showing LTP calculated by averaging the change in fEPSP slope apparent between 50 and 60 min after high-frequency stimulation (E), and representative fEPSP traces showing evoked responses before (black) and 90 min after (red) high-frequency stimulation (F) of CD- and WD-fed mice. Calibration bar, 1 mV/5 ms. All data are presented as the percentage change in fEPSP slope means ± sem from baseline [n = 6 (A, C); n = 3 for DF). *P < 0.05, **P < 0.01, ***P < 0.001.
Figure 2.
Figure 2.
WD diet reduces synaptic plasticity. (A) Bdnf mRNA levels in the brain, isolated microglia, liver, and adipose tissue. B) Western blot analysis of phospho-ERK1/2, total ERK1/2, and PSD-95 of CD- and WD-fed mice [n = 6 for liver, ileum, and adipose tissue; n = 3 for isolated microglia (A); n = 4 (B)]. All data are presented as means ± sd. *P < 0.05, ** P < 0.01.
Figure 3.
Figure 3.
WD intake-induced systemic inflammation. The mRNA level of inflammatory genes in the brain, ileum, liver, and adipose tissue of CD- and WD-fed mice (n = 6/group). Data are presented as means ± sd. *P < 0.05, **P < 0.01, ***P < 0.001.
Figure 4.
Figure 4.
WD increased total and TNF-α–positive macrophage and activated microglia. A) Flow cytometry analysis of macrophages derived from spleens. B) Immunofluorescence staining of CD11b in the frontal cortex and ventral posteromedial thalamic nucleus of CD- and WD-fed mice. Data are expressed as means ± sd [n = 6 (A); n = 4 (B)]. *P < 0.05.
Figure 5.
Figure 5.
WD-induced potassium channel mRNA levels and inflammatory signaling. Potassium channel mRNA level in the brain and isolated microglia (A), and mRNA level of inflammatory genes in the isolated microglia (B) of CD- and WD-fed mice. Data are expressed as means ± sd (n = 3 for isolated microglia; n = 6 for brain). *P < 0.05, **P < 0.01, ***P < 0.001.
Figure 6.
Figure 6.
The effect of diet on RA and TGR5-regulated signaling. A) The mRNA level of RA target genes in the brain and ileum of healthy mice supplemented with and without retinoic acid. The mRNA level of RA-regulated signaling genes in isolated microglia (B) and TGR5-regulated signaling genes in brain, isolated microglia, ileum, liver, and adipose tissue of CD- and WD-fed mice. Data are expressed as means ± sd (n = 6 for brain, ileum, liver, and adipose tissue; n = 3 for isolated microglia). *P < 0.05, **P < 0.01, ***P < 0.001.
Figure 7.
Figure 7.
Brain, liver, and serum BA profiles. Hydrophobicity and BA profile of CD- and WD-fed mice. Hydrophobicity was derived from summation of the values of individual BA’s hydrophobicity index multiplied by its concentration. Hydrophobicity indices of individual BAs are listed: TCA = 0, T-α–MCA = −0.84, T-β–MCA = −0.78, taurohyodeoxycholic acid = −0.35, taurine-conjugated chenodeoxycholic acid = 0.46, taurine-conjugated deoxycholic acid = 0.59, TLCA = 1, glycoursodeoxycholic acid = −0.43. Data are expressed as means ± sd (n = 6/group). *P < 0.05.
Figure 8.
Figure 8.
Expression of cholesterol and BA homeostasis genes in the brain and isolated microglia of CD- and WD-fed mice. Data are expressed as means ± sd (n = 6 for brain; n = 3 for isolated microglia). *P < 0.05, **P < 0.01.
Figure 9.
Figure 9.
Relative abundance of cecal microbiota of CD- and WD-fed mice at phylum (A), Firmicutes to Bacteroidetes ratio (B), family (C), and genus (D) levels. Data are expressed as means ± sd (n = 4/group). *P < 0.05, **P < 0.01, ***P < 0.001.

References

    1. Swerdlow R. H. (2011) Brain aging, Alzheimer’s disease, and mitochondria. Biochim. Biophys. Acta 1812, 1630–1639 - PMC - PubMed
    1. Jayaraman A., Pike C. J. (2014) Alzheimer’s disease and type 2 diabetes: multiple mechanisms contribute to interactions. Curr. Diab. Rep. 14, 476. - PMC - PubMed
    1. Hu N., Yu J. T., Tan L., Wang Y. L., Sun L., Tan L. (2013) Nutrition and the risk of Alzheimer’s disease. BioMed Res. Int. 2013, 524820. - PMC - PubMed
    1. Friedland R. P. (2015) Mechanisms of molecular mimicry involving the microbiota in neurodegeneration. J. Alzheimers Dis. 45, 349–362 - PubMed
    1. Pistollato F., Sumalla Cano S., Elio I., Masias Vergara M., Giampieri F., Battino M. (2016) Role of gut microbiota and nutrients in amyloid formation and pathogenesis of Alzheimer disease. Nutr. Rev. 74, 624–634 - PubMed

Publication types

MeSH terms

Substances

LinkOut - more resources