. 2018 Jun;32(6):3149-3165.
doi: 10.1096/fj.201701127R. Epub 2018 Jan 17.

Methionine oxidized apolipoprotein A-I at the crossroads of HDL biogenesis and amyloid formation

Affiliations

Methionine oxidized apolipoprotein A-I at the crossroads of HDL biogenesis and amyloid formation

Andrzej Witkowski et al. FASEB J. 2018 Jun.

Abstract

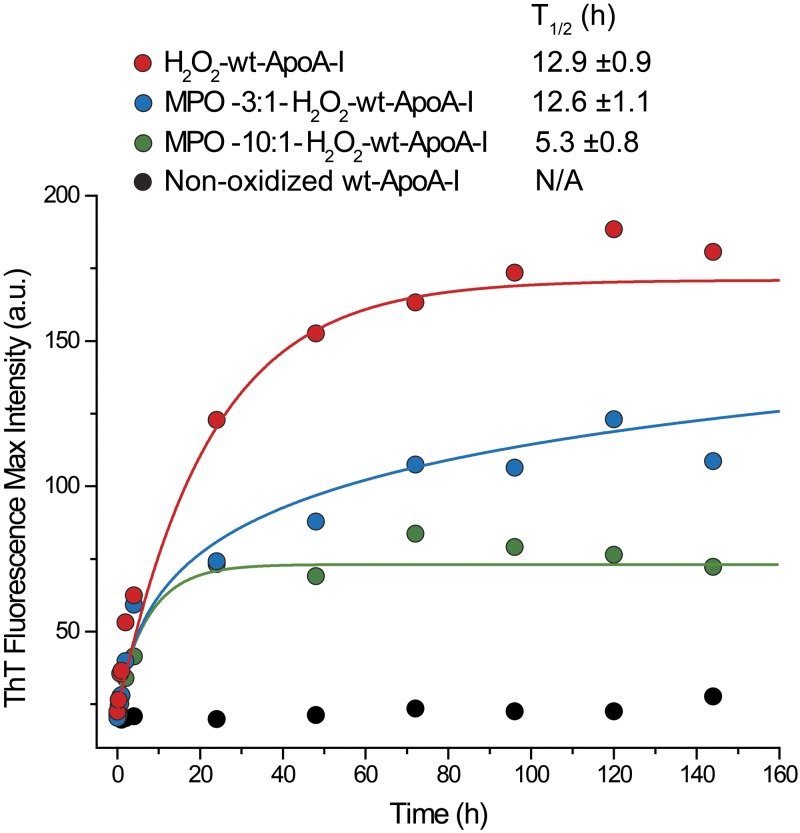
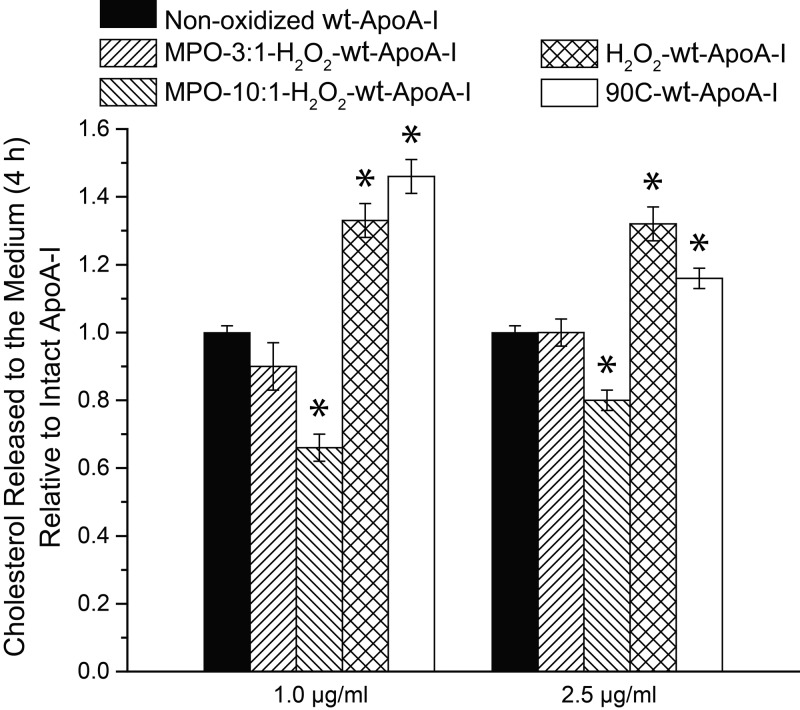
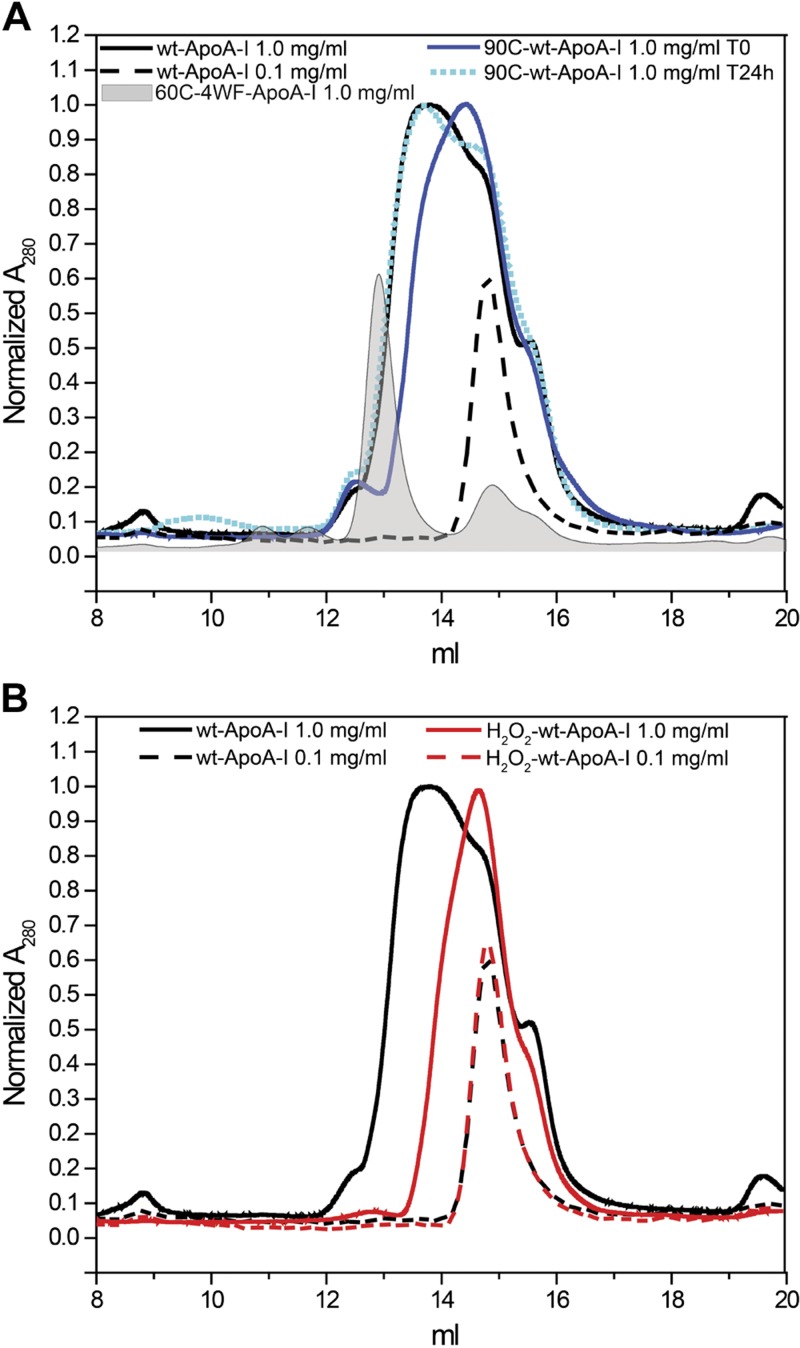
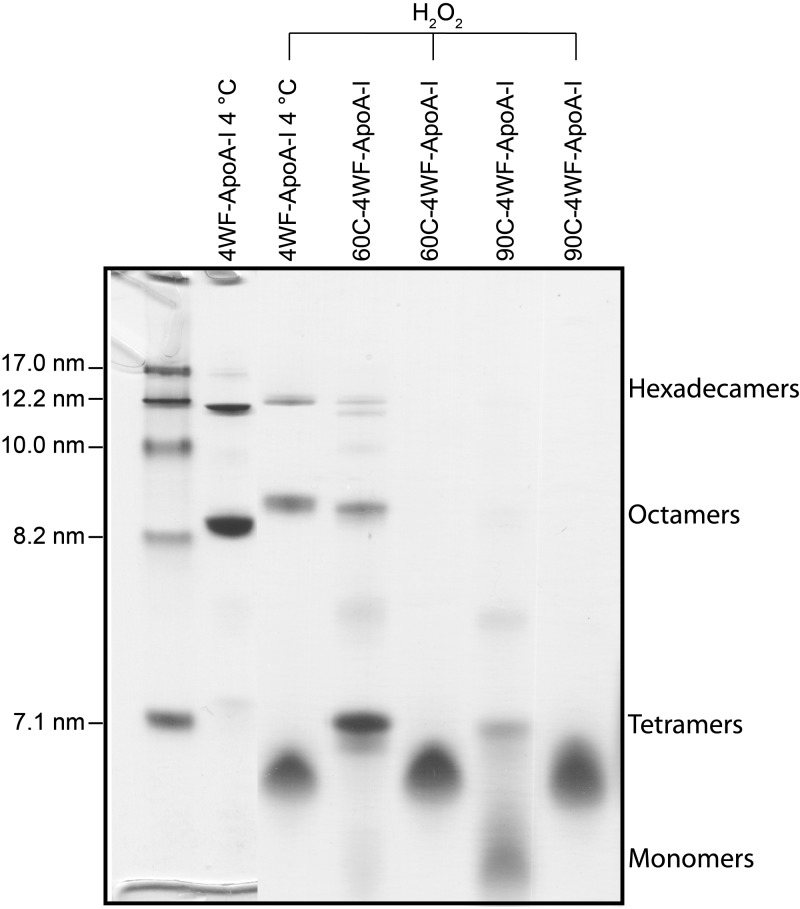
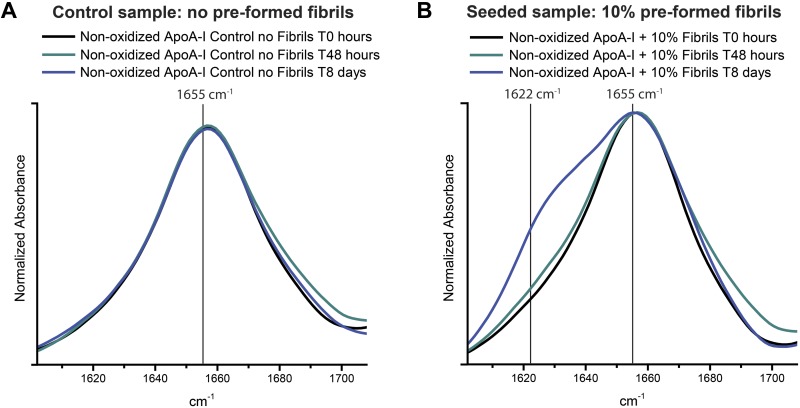
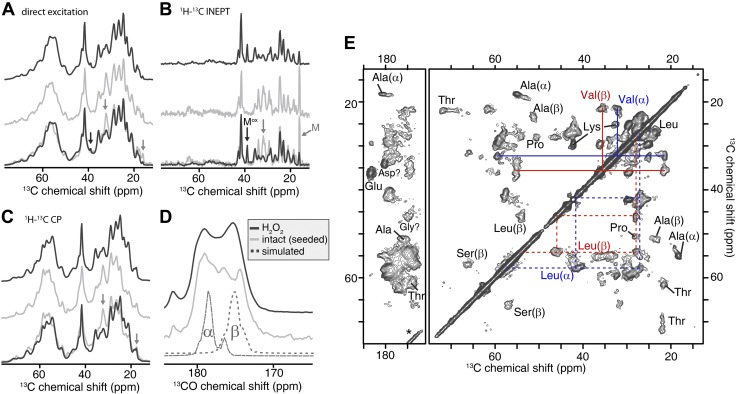
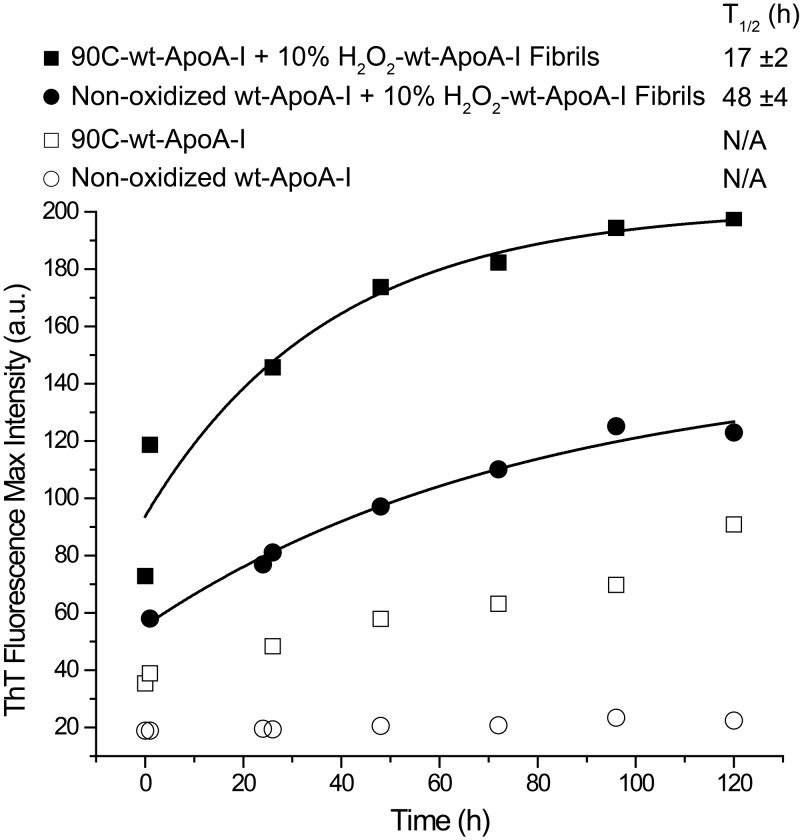
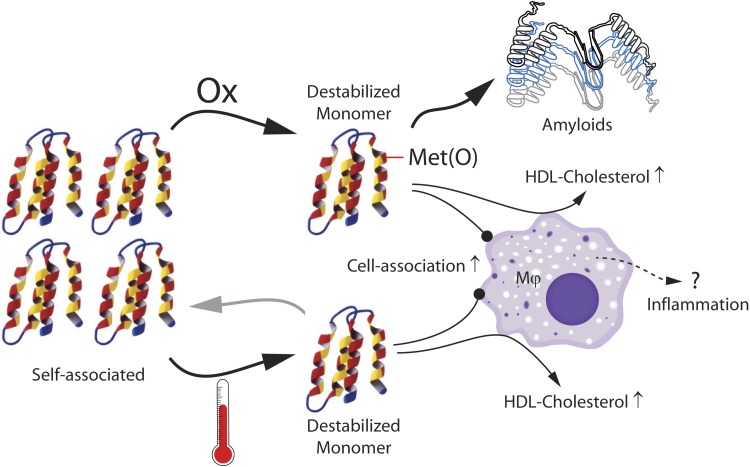
Apolipoprotein A-I (apoA-I) shares with other exchangeable apolipoproteins a high level of structural plasticity. In the lipid-free state, the apolipoprotein amphipathic α-helices interact intra- and intermolecularly, providing structural stabilization by self-association. We have reported that lipid-free apoA-I becomes amyloidogenic upon physiologically relevant (myeloperoxidase-mediated) Met oxidation. In this study, we established that Met oxidation promotes amyloidogenesis by reducing the stability of apoA-I monomers and irreversibly disrupting self-association. The oxidized apoA-I monomers also exhibited increased cellular cholesterol release capacity and stronger association with macrophages, compared to nonoxidized apoA-I. Of physiologic relevance, preformed oxidized apoA-I amyloid fibrils induced amyloid formation in nonoxidized apoA-I. This process was enhanced when self-association of nonoxidized apoA-I was disrupted by thermal treatment. Solid state NMR analysis revealed that aggregates formed by seeded nonoxidized apoA-I were structurally similar to those formed by the oxidized protein, featuring a β-structure-rich amyloid fold alongside α-helices retained from the native state. In atherosclerotic lesions, the conditions that promote apoA-I amyloid formation are readily available: myeloperoxidase, active oxygen species, low pH, and high concentration of lipid-free apoA-I. Our results suggest that even partial Met oxidation of apoA-I can nucleate amyloidogenesis, thus sequestering and inactivating otherwise antiatherogenic and HDL-forming apoA-I.-Witkowski, A., Chan, G. K. L., Boatz, J. C., Li, N. J., Inoue, A. P., Wong, J. C., van der Wel, P. C. A., Cavigiolio, G. Methionine oxidized apolipoprotein A-I at the crossroads of HDL biogenesis and amyloid formation.

Keywords: cholesterol efflux; myeloperoxidase; protein structure; self-association; solid-state NMR.


Conflict of interest statement

The authors thank Dr. Gordon L. Watson [Children’s Hospital Oakland Research Institute (CHORI)] for contributing the wild-type mice for bone marrow extraction and Dorothy Tabron (CHORI) for taking care of the animals and extracting the bone marrow. The CD36-KO mice were generously provided by Prof. Andreas Stahl (University of California at Berkeley, Berkeley, CA, USA). The authors are also grateful to Prof. Shinji Yokoyama and Prof. Rui Lu (Nutritional Health Science Research Center, Chubu University, Kasugai, Japan) for assistance in troubleshooting the cellular cholesterol release protocol and to Dr. Trudy M. Forte (CHORI) and Dr. Shobini Jayaraman (Boston University School of Medicine. Boston, MA, USA) for useful discussions. This work was supported in whole or part by U.S. National Institutes of Health (NIH), National Heart, Lung, and Blood Institute Grant R01HL113059 (to G.C)., and NIH National Institute of General Medical Sciences Grants R01GM112678 (to P.C.A.V.D.W.) and T32 GM088119 (to J.C.B.). The Agilent 6490 triple quadrupole mass spectrometer was purchased through Grant 1S10OD018070, from the Office of the Director of the NIH. The article’s content is solely the responsibility of the authors and does not necessarily represent the official views of the NIH. The authors declare no conflicts of interest.

Figures

Figure 1.
Figure 1.
Kinetics of amyloid fibril formation measured by ThT fluorescence. Representative ThT kinetics curves for H2O2-wt-ApoA-I, MPO-3:1-H2O2-wt-ApoA-I, MPO-10:1-H2O2-ApoA-I, and nonoxidized wt-ApoA-I. A portion of fibrillation incubation mixture was combined with the ThT stock solution at the indicated time points and the fluorescence emission spectrum of the sample recorded. Solid lines are fitting of the experimental values by exponential (H2O2-wt-ApoA-I and MPO-10:1-H2O2-ApoA-I) or logarithmic (MPO-3:1-H2O2-wt-ApoA-I) curves. T1/2 data (means ± sem) from ≥3 independent experiments are shown.
Figure 2.
Figure 2.
Release of cholesterol from cells into cell culture medium during a 4 h incubation in the presence of 1.0 and 2.5 µg/ml ApoA-I samples. To induce expression of ABCA1, cells were preincubated overnight with cAMP, as described in the Supplemental Data. Data are normalized to the cholesterol levels released in the presence of nonoxidized wt-ApoA-I at the indicated concentration. Data are reported as means ± sem of 3 independent experiments with 3 replications per experiment. *P ≤ 0.01, probability that the reported means are not significantly different from the cholesterol release efficiency of nonoxidized wt-ApoA-I (which is normalized to 1). Remaining histograms represent values not significantly different from nonoxidized wt-ApoA-I. P > 0.01.
Figure 3.
Figure 3.
Western blot analysis of BMDM cell extracts. Cell-association of apoA-I samples with BMDM from wild-type mice (A) and CD36-KO mice (B).
Figure 4.
Figure 4.
SEC analysis of 100 µl apoA-I samples at 1.0 or 0.1 mg/ml in iPBS. A) 90C-wt-ApoA-I was injected into the column after incubation at 90°C for 1 h and 10 min cooling at room temperature. B) After oxidation, H2O2-wt-ApoA-I was dialyzed against iPBS for 2 d with 2 buffer exchanges at 4°C before SEC analysis. To facilitate the comparison of different chromatograms, the y-axes were manually adjusted to normalize the intensity of the most prominent peak in each chromatogram to 1. 60C-4WF-ApoA-I and the 0.1 mg/ml sample chromatograms were arbitrarily normalized to 0.6.
Figure 5.
Figure 5.
NDGGE analysis of heated and oxidized 4WF-ApoA-I samples. Protein samples at 1.0 mg/ml were incubated for 1 h at the indicated temperatures. After cooling at room temperature for 10 min, the samples were loaded on gel (3 µg/lane) for NDGGE analysis or oxidized by 1000:1 molar excess of H2O2, dialyzed against iPBS for 2 d with 2 buffer exchanges and then analyzed. Left lane: molecular weight markers. Molecular weight marker diameters (nm) are indicated on the left. Labels on the right identify the different oligomeric species of nonoxidized 4WF-ApoA-I (19). Met-oxidized oligomers and monomers have slightly reduced electrophoretic mobilities compared to nonoxidized samples.
Figure 6.
Figure 6.
SDS-PAGE analysis of wt-ApoA-I, 3ML-ApoA-I, and 4WF-ApoA-I (1.0 mg/ml) upon oxidation by different methods. At the end of oxidation incubations (overnight for H2O2 oxidation and 90 min for MPO-mediated oxidation), 3 μg/lane of samples were loaded on gel. Electrophoresis was executed as described in Supplemental Data. Molecular masses of protein standards are indicated on the right. Met-oxidized apoA-I samples have slightly reduced electrophoretic mobility vs. nonoxidized samples.
Figure 7.
Figure 7.
Seeding of nonoxidized wt-ApoA-I with molar 10% and 1% of preformed H2O2-wt-ApoA-I aggregates. As a control, nonoxidized wt-ApoA-I was incubated in the absence of seeds. Total protein concentration in each sample was 1.0 mg/ml. The samples were incubated in fibrillation buffer (pH 6.0) at 37°C with continuous vortexing at 800 rpm. ThT fluorescence was measured at the indicated time points. Solid lines show fitting of the experimental values by sigmoidal curves. T1/2 data (means ± sem) from ≥3 independent experiments are shown.
Figure 8.
Figure 8.
FTIR spectra in the amide I region (1602–1708 cm−1) of nonoxidized wt-ApoA-I after seeding with preformed H2O2-wt-ApoA-I aggregates. Control (A) and 10% (molar) seeded (B) mixtures before incubation under fibrillation conditions (T0) and after 48 h and 8 d incubations.
Figure 9.
Figure 9.
MAS ssNMR spectra of pelleted [U-13C,15N] wt-ApoA-I aggregates. A) Direct excitation 13C spectra of H2O2-wt-13C,15N-ApoA-I aggregates (black trace) and aggregates formed by nonoxidized wt-13C,15N-ApoA-I incubated for 8 d with 10% (molar) of unlabeled H2O2-wt-ApoA-I seeds (light gray trace). An overlay of the 2 spectra is shown at the bottom. Black and gray arrows: the 13C signals of oxidized and unoxidized Met side chains, respectively. B) 13C spectra obtained via 1H-13C refocused INEPT, which shows only highly dynamic residues. C) 13C spectra of the same samples using 1H-13C cross polarization, which is selective for the more rigid parts of the pelleted protein samples. AC) Only aliphatic spectral regions are shown; full spectra are reported in Supplemental Fig. S6. D) 1H-13C CP spectra in the carbonyl region of H2O2-wt-13C,15N-ApoA-I (black trace) and nonoxidized wt-13C,15N-ApoA-I after seeding (light gray trace). Dotted lines (bottom) show simulated spectra for hypothetical fully α-helical and β-sheet structural models of ApoA-I, to illustrate the secondary structure dependence. E) 2D 13C-13C spectrum of the same H2O2-wt-13C,15N-ApoA-I as in AD, using 20 ms dipolar-assisted rotational resonance mixing. The amino acid type assignments of select cross peaks are indicated. Color-coded lines connect sets of peaks from coexisting α-helical and β-sheet Val and Leu. All spectra were acquired at 600 MHz (1H frequency).
Figure 10.
Figure 10.
Seeding of nonoxidized wt-ApoA-I and 90C-wt-ApoA-I with molar 10% of preformed H2O2-wt-ApoA-I aggregates. In control experiments, nonoxidized wt-ApoA-I and 90C-wt-ApoA-I were incubated in the absence of seeds. Total protein concentration was 1.0 mg/ml. The samples were incubated in fibrillation buffer (pH 6.0) at 37°C with continuous vortexing at 1100 rpm. ThT fluorescence was measured at the indicated time points. Solid lines show fitting of the experimental values by monomolecular growth exponential curves. T1/2 data (means ± sem) from ≥3 independent experiments are shown.
Figure 11.
Figure 11.
Summary of the presented results. ApoA-I native self-association is disrupted by thermal treatment or Met oxidation. Destabilized monomeric apoA-I associates with macrophages more strongly and extracts cholesterol more efficiently than native apoA-I. Destabilized monomeric Met(O)-ApoA-I is also amyloidogenic.

References

    1. Lau D., Baldus S. (2006) Myeloperoxidase and its contributory role in inflammatory vascular disease. Pharmacol. Ther. 111, 16–26 10.1016/j.pharmthera.2005.06.023 - DOI - PubMed
    1. Podrez E. A., Abu-Soud H. M., Hazen S. L. (2000) Myeloperoxidase-generated oxidants and atherosclerosis. Free Radic. Biol. Med. 28, 1717–1725 10.1016/S0891-5849(00)00229-X - DOI - PubMed
    1. Shao B. (2012) Site-specific oxidation of apolipoprotein A-I impairs cholesterol export by ABCA1, a key cardioprotective function of HDL. Biochim. Biophys. Acta 1821, 490–501 10.1016/j.bbalip.2011.11.011 - DOI - PMC - PubMed
    1. Shao B., Bergt C., Fu X., Green P., Voss J. C., Oda M. N., Oram J. F., Heinecke J. W. (2005) Tyrosine 192 in apolipoprotein A-I is the major site of nitration and chlorination by myeloperoxidase, but only chlorination markedly impairs ABCA1-dependent cholesterol transport. J. Biol. Chem. 280, 5983–5993 10.1074/jbc.M411484200 - DOI - PubMed
    1. Zheng L., Nukuna B., Brennan M. L., Sun M., Goormastic M., Settle M., Schmitt D., Fu X., Thomson L., Fox P. L., Ischiropoulos H., Smith J. D., Kinter M., Hazen S. L. (2004) Apolipoprotein A-I is a selective target for myeloperoxidase-catalyzed oxidation and functional impairment in subjects with cardiovascular disease. J. Clin. Invest. 114, 529–541 10.1172/JCI200421109 - DOI - PMC - PubMed

Publication types

LinkOut - more resources