. 2018 Jun;32(6):3346-3360.
doi: 10.1096/fj.201700862RR. Epub 2018 Jan 24.

Dynamic structure mediates halophilic adaptation of a DNA polymerase from the deep-sea brines of the Red Sea

Affiliations

Dynamic structure mediates halophilic adaptation of a DNA polymerase from the deep-sea brines of the Red Sea

Masateru Takahashi et al. FASEB J. 2018 Jun.

Abstract

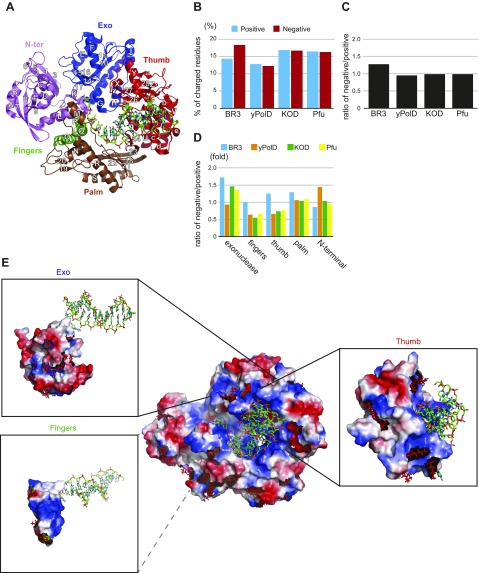
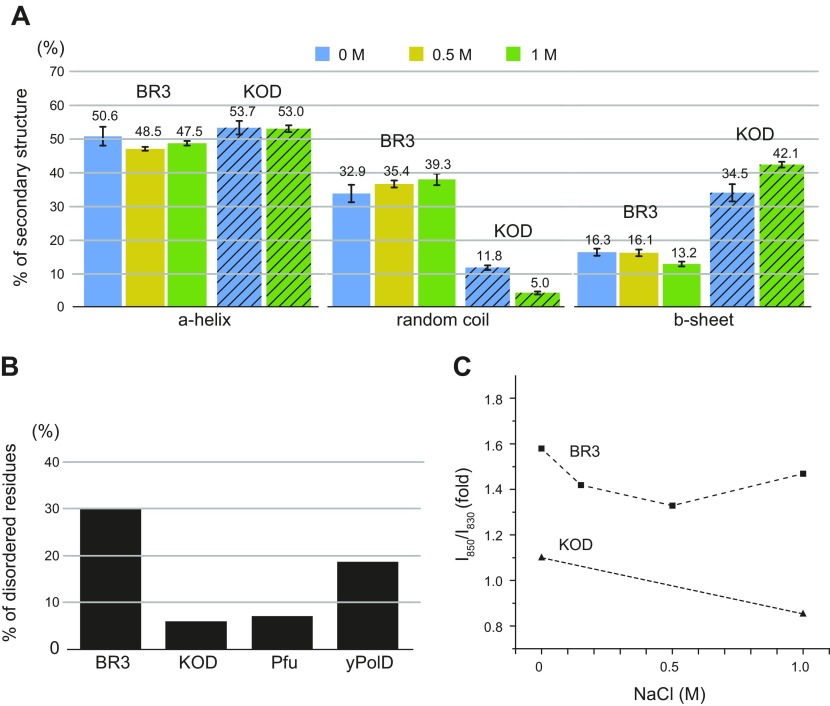
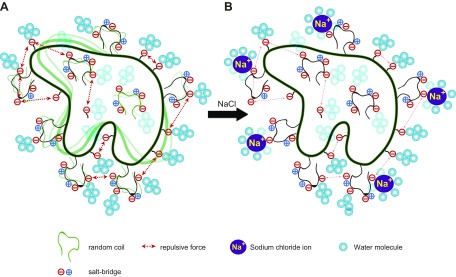
The deep-sea brines of the Red Sea are remote and unexplored environments characterized by high temperatures, anoxic water, and elevated concentrations of salt and heavy metals. This environment provides a rare system to study the interplay between halophilic and thermophilic adaptation in biologic macromolecules. The present article reports the first DNA polymerase with halophilic and thermophilic features. Biochemical and structural analysis by Raman and circular dichroism spectroscopy showed that the charge distribution on the protein's surface mediates the structural balance between stability for thermal adaptation and flexibility for counteracting the salt-induced rigid and nonfunctional hydrophobic packing. Salt bridge interactions via increased negative and positive charges contribute to structural stability. Salt tolerance, conversely, is mediated by a dynamic structure that becomes more fixed and functional with increasing salt concentration. We propose that repulsive forces among excess negative charges, in addition to a high percentage of negatively charged random coils, mediate this structural dynamism. This knowledge enabled us to engineer a halophilic version of Thermococcus kodakarensis DNA polymerase.-Takahashi, M., Takahashi, E., Joudeh, L. I., Marini, M., Das, G., Elshenawy, M. M., Akal, A., Sakashita, K., Alam, I., Tehseen, M., Sobhy, M. A., Stingl, U., Merzaban, J. S., Di Fabrizio, E., Hamdan, S. M. Dynamic structure mediates halophilic adaptation of a DNA polymerase from the deep-sea brines of the Red Sea.

Keywords: DNA polymerase engineering; halophilic enzymes; structural adaptation; structure dynamism; thermophilic enzymes.


Conflict of interest statement

The authors thank the King Abdullah University of Science and Technology (KAUST) BioScience Core Laboratory for providing Pfu polymerase. This research was funded by the Saudi Economic and Development Company (SEDCO) Research Excellence Project and baseline funding from KAUST to S.M.H. The authors declare no conflicts of interest.

Figures

Figure 1.
Figure 1.
Primary sequence analysis of BR3 Pol. A) Structure of KOD Pol bound to DNA in the polymerization mode. The protein is depicted as a cartoon and DNA as sticks (PDB ID: 4K8Z) (46). The 5 domains in the polymerase and their secondary structure elements are colored as indicated. B) Traits of positively and negatively charged residues in BR3 Pol compared with the catalytic subunit of yPolD and to the archaeal polymerases KOD Pol and Pfu Pol. Percentages of positively charged residues (basic residues: Arg and Lys) and negatively charged residues (acidic residues: Glu and Asp) in BR3 Pol, yPolD, KOD Pol, and Pfu Pol are shown. C) Ratio of negatively charged to positively charged residues in BR3 Pol, yPolD, KOD Pol, and Pfu Pol. D) Ratio of negatively charged to positively charged residues for the 5 domains in the polymerase in BR3 Pol, yPolD, KOD Pol, and Pfu Pol. E) Molecular surface with electrostatic potential map in KOD Pol. The red and blue surfaces are acidic (negatively charged) and basic (positively charged) residues, respectively. The residues on the surface of KOD Pol that were replaced with unique acidic residues (Glu or Asp) in BR3 Pol on the surface are shown as red sticks. The electrostatic potential maps of the exonuclease, fingers, and thumb domains with DNA and the locations of unique acidic residues in BR3 Pol in each domain are highlighted.
Figure 2.
Figure 2.
Protein structure analysis of BR3 Pol and KOD Pol. A) Percentages of α-helices, random coils, and β-sheets in BR3 Pol (solid) and in KOD Pol (hatched) analyzed by using Raman spectroscopy. Supplemental Fig. 5A illustrates fitting of the secondary structure region. The numbers above each bar indicate the value in a percentage, and sd is shown. B) Percentage of amino acids identified as a disordered region in BR3 Pol, KOD Pol, Pfu Pol, and yPolD. Disorder probability was calculated by RONN (28), and plots of disorder probability are presented in Supplemental Fig. 6A. C) Hydroxyl group interaction with hydrogen bonds of BR3 Pol and KOD Pol as a function of NaCl concentration. Supplemental Fig. 5B illustrates curve fitting of the doublet of the Tyr band.
Figure 3.
Figure 3.
Dependence of the polymerase activity on salt and metal ions. A) Salt-dependent polymerization activity of BR3 Pol. Polymerase activity was measured on a short primer/template substrate consisting of a 15-mer primer labeled at its 5′ end with Cy3 and a 35-mer template strand (insert schematic). Reactions were performed in a buffer containing the indicated concentration of NaCl for 4 min at 45°C and stopped by EDTA, as described in the Materials and Methods section. Products were analyzed on a denaturing 20% polyacrylamide urea gel. B, C) Salt-dependent polymerization activity of Pfu Pol and KOD Pol, respectively. D) Effect of different metal ions on the polymerization activity of BR3 Pol compared with Pfu Pol. Different metal ions were added at a constant concentration of 2 mM with the reaction performed in a buffer containing either 300 mM KCl (left panel) or 0 mM KCl (right panel). E) Effect of increasing ZnSO4 concentration on the polymerization activities of BR3 Pol in a reaction buffer containing 300 mM KCl. Reactions in BE were performed and analyzed as in A.
Figure 4.
Figure 4.
Single-molecule measurements of rate and processivity of BR3 Pol and Pfu Pol. A) Schematic depiction of the single-molecule assay for observing the primer extension reaction. B) Representative primer extension trajectories by BR3 Pol and Pfu Pol. Dotted lines indicate pausing of the primer extension, which represents points where a minimum of 3 s of no change in DNA length was detected. C) Distribution of rate of DNA synthesis by BR3 Pol and Pfu Pol extracted from the slope of the DNA lengthening phase in B fitted with a gaussian distribution. D) Distribution of processivity of DNA synthesis by BR3 Pol and Pfu Pol, extracted from the magnitude of the DNA lengthening phase in B fitted with a single exponential decay. Reactions were performed in a buffer containing 250 mM KCl for BR3 Pol and 0 mM KCl for Pfu Pol. The uncertainty corresponds to the sd of the fit.
Figure 5.
Figure 5.
Salt-dependent polymerization activity of KOD Pol and its chimera proteins. A) Schematic of KOD Pol WT and chimeric proteins constructed between KOD Pol and BR3 Pol. The exonuclease, fingers, and thumb domains of KOD Pol swapped with those from BR3 Pol are shown in purple, green, and red, respectively. BE) are the polymerization activities at increasing NaCl concentrations for KOD Pol WT, KODBR3exo, KODBR3thumb, and KODBR3fingers. The reaction was conducted and the product was analyzed as described in Fig. 3A. F) PCR test of KOD chimera proteins. PCR reactions were performed as described in the Materials and Methods section by KOD Pol WT, KODBR3fingers, KODBR3thumb, and KODBR3exo.
Figure 6.
Figure 6.
Interactions of BR3 Pol, KOD Pol WT, and KOD chimera proteins with DNA by SPR. A) Schematic of the experiment showing the 3 different biotinylated DNA constructs that were immobilized on 3 independent flow cells on a streptavidin (SA)-sensor chip and the injection of the polymerase in solution; a fourth flow cell with no DNA was used to subtract nonspecific interactions between the protein and the surface and the buffer’s refractive index. The 3 tested DNA constructs are primer/template strands (left panel), ssDNA (middle panel), and dsDNA (right panel). B) Binding of BR3 Pol to primer/template strands in a buffer containing 100 mM NaCl. Upper panel: serial concentrations of BR3 Pol were injected (10, 20, 50, 100, 200, 400, and 600 nM concentrations) with a surface-regeneration step to remove the bound protein in between. Lower panel: the maximum RUs reached at each protein concentration were fitted using the steady-state affinity mode to obtain the equilibrium dissociation constant (Kd) for each DNA substrate. The uncertainty corresponds to the sd of the fit. C) Binding of KOD Pol to primer/template strands in a buffer containing 100 mM NaCl. Experiments were performed and analyzed as in B and the protein concentrations used were 10, 20, 50, 100, 200, 400, and 600 nM. D) Binding of BR3 Pol to primer/template strands in a buffer containing 300 mM NaCl. Experiments were performed and analyzed as in B, and the protein concentrations used were 10, 20, 50, 100, 200, 400, and 600 nM. E, F) Kd of KODBR3exo and KODBR3thumb to primer/template strands in a buffer containing 100 or 300 mM NaCl, respectively. Kd was calculated as described in B.
Figure 7.
Figure 7.
Negatively charged random coils mediate salt-induced transitioning from a flexible to a defined structure. A) In the absence of salt, the polymerase experiences dynamic structural fluctuations as a result of its increased percentage of random coils. Excess negative charges (Asp and Glu) on the surface and/or on the random coils mediate this flexibility through repulsive forces. B) In the presence of salt, the binding of hydrated Na+ ions to acidic residues stabilizes the random coils and reduces the dynamic structural fluctuations leading to the formation of a more functional conformer.

References

    1. Antunes A., Ngugi D. K., Stingl U. (2011) Microbiology of the Red Sea (and other) deep-sea anoxic brine lakes. Environ. Microbiol. Rep. 3, 416–433 10.1111/j.1758-2229.2011.00264.x - DOI - PubMed
    1. Hartmann M., Scholten J. C., Stoffers P., Wehner F. (1998) Hydrographic structure of brine-filled deeps in the Red Sea—new results from the Shaban, Kebrit, Atlantis II, and Discovery Deep. Mar. Geol. 144, 311–330 10.1016/S0025-3227(97)00055-8 - DOI
    1. Bäcker H., Schoell M. (1972) New deeps with brines and metalliferous sediments in the Red Sea. Nat. Phys. Sci. 240, 153–158 10.1038/physci240153a0 - DOI
    1. Amann R. I., Ludwig W., Schleifer K. H. (1995) Phylogenetic identification and in situ detection of individual microbial cells without cultivation. Microbiol. Rev. 59, 143–169 - PMC - PubMed
    1. Antunes A., Alam I., Bajic V. B., Stingl U. (2011) Genome sequence of Halorhabdus tiamatea, the first archaeon isolated from a deep-sea anoxic brine lake. J. Bacteriol. 193, 4553–4554 10.1128/JB.05462-11 - DOI - PMC - PubMed

Publication types

MeSH terms

Substances