

In vitro assessment of nutraceutical compounds and novel nutraceutical formulations in a liver-steatosis-based model
- PMID: 29402273
- PMCID: PMC5800044
- DOI: 10.1186/s12944-018-0663-2
In vitro assessment of nutraceutical compounds and novel nutraceutical formulations in a liver-steatosis-based model
Erratum in
-
Correction to: In vitro assessment of nutraceutical compounds and novel nutraceutical formulations in a liver-steatosis-based model.Lipids Health Dis. 2022 Apr 6;21(1):37. doi: 10.1186/s12944-022-01646-6. Lipids Health Dis. 2022. PMID: 35382833 Free PMC article. No abstract available.
Abstract
Background: Steatosis is a chronic liver disease that depends on the accumulation of intracellular fatty acids. Currently, no drug treatment has been licensed for steatosis; thus, only nutritional guidelines are indicated to reduce its progression. The aim of this study is to combine different nutraceutical compounds in order to evaluate their synergistic effects on a steatosis in vitro model compared to their separate use. In particular, three different formulations based on silymarin, curcumin, vitamin E, docosahexaenoic acid (DHA), choline, and phosphatidylcholine were assayed.
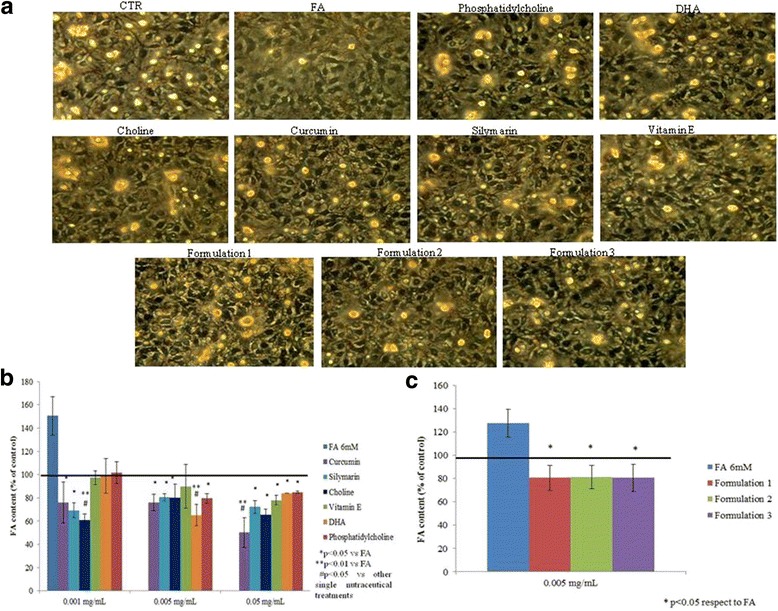
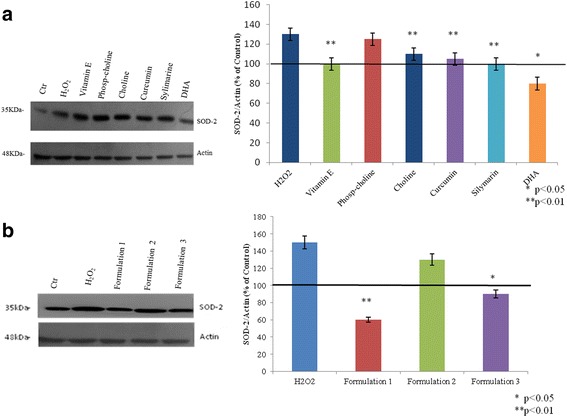
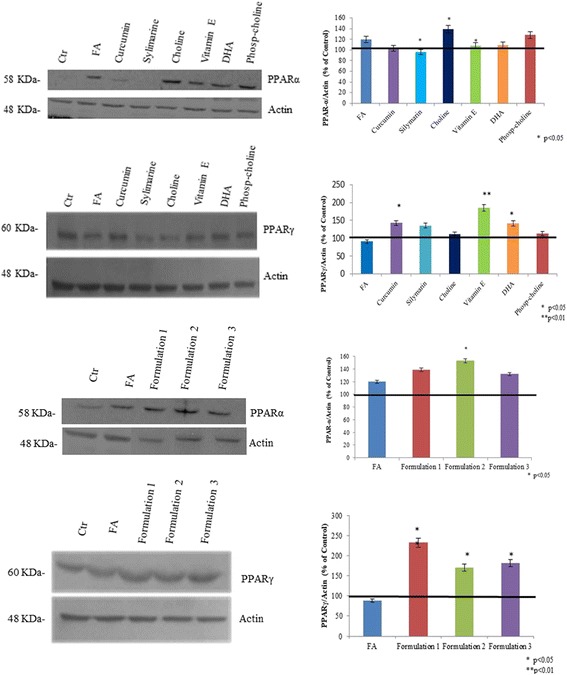
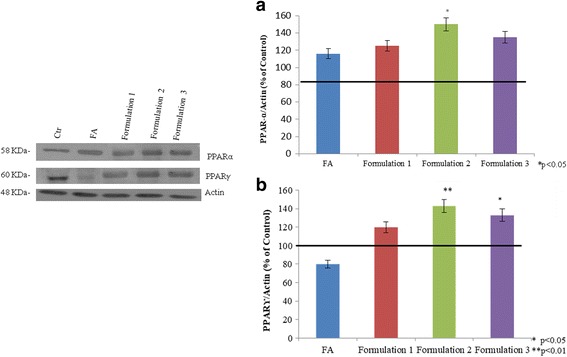
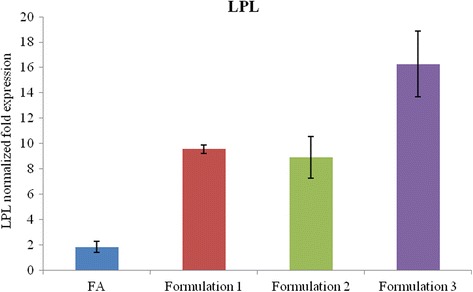
Methods: Human hepatocellular carcinoma cells (HepG2 cell line) were treated with a mixture of fatty acids in order to induce an in vitro model of steatosic cells, and then the amount of intracellular fat was evaluated by Oil Red O staining. The peroxisome proliferator-activated receptors α and γ (PPARα and γ) expression, closely correlated to lipid metabolism, was evaluated. The efficiency of these receptors was evaluated through the study of LPL mRNA expression, a marker involved in the lipolysis mechanism. Superoxide dismutase (SOD-2) and malondialdehydes (MDA) in lipid peroxidation were assayed as specific biomarkers of oxidative stress. In addition, experiments were performed using human liver cells stressed to obtain a steatosis model. In particular, the content of the intracellular fat was assayed using Oil Red O staining, the activation of PPARα and γ was evaluated through western blotting analyses, and the LPL mRNA expression level was analyzed through qRT-PCR.
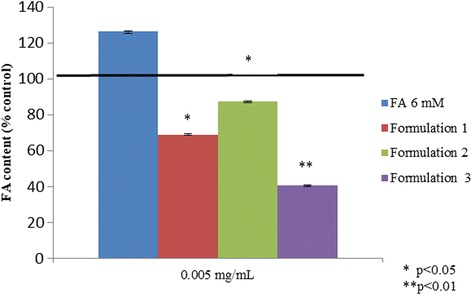
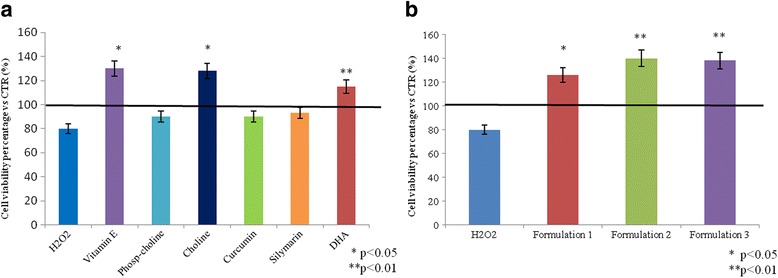
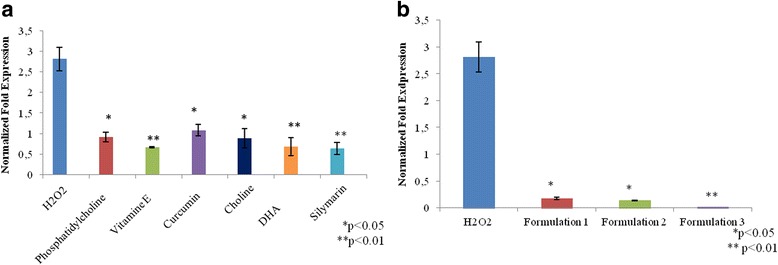
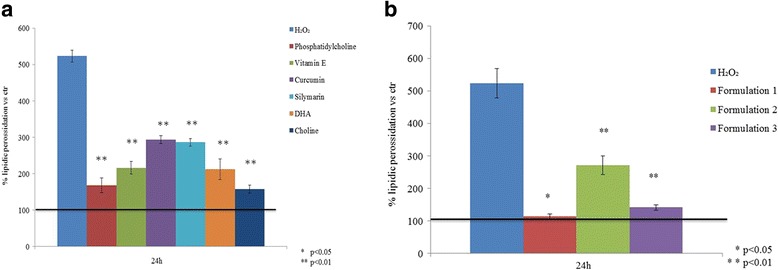
Results: All formulations proved effective on lipid content reduction of about 35%. The oxidative stress damage was reduced by all the substances separately and even more efficiently by the same in formulation (i.e. Formulation 1 and Formulation 3, which reduced the SOD-2 expression and induced the PPARs activation). Lipid peroxidation, was reduced about 2 fold by foormulation2 and up to 5 fold by the others compared to the cells pretreated with H2O2.Formulation 1, was more effective on PPARγ expression (2.5 fold increase) respect to the other compounds on FA treated hepathocytes. Beside, LPL was activated also by Formulation 3 and resulted in a 5 to 9 fold-increase respect to FA treated control.
Conclusions: Our results proved that the formulations tested could be considered suitable support to face steatosis disease beside the mandatory dietetic regimen.
Keywords: HepG2; Normal liver cells; Nutraceutical compounds; Oxidative stress; PPARs expression; Steatosis in vitro model.
Conflict of interest statement
Ethic approval and consent to participate
Not applicable
Consent for publications
All co-authors have given their consent for publication of this article in Lipids in Health and Disease.
Competing interests
The authors declare that they have no competing interests. In particular, Dr. Andrea Maria Giori is employed in IBSA Italia and Bouty as R&D Director.
Publisher’s Note
Springer Nature remains neutral with regard to jurisdictional claims in published maps and institutional affiliations.
Figures
References
-
- Bellanti F, Villani R, Facciorusso A, Vendemiale G, Serviddio G. Lipid oxidation products in the pathogenesis of non-alcoholic steatohepatitis. Free Radic Biol Med. 2017; 10.1016/j.freeradbiomed.2017.01.023. - PubMed
-
- Michalik L, Auwerx J, Berger JP, Chatterjee VK, Glass CK, Gonzalez FJ, Grimaldi PA, Kadowaki T, Lazar MA, O'Rahilly S, Palmer CN, Plutzky J, Reddy JK, Spiegelman BM, Staels B, Wahli W. Peroxisome proliferator-activated receptors. International Union of Pharmacology. LXI. Pharmacol Rev. 2006;58(4):726–741. doi: 10.1124/pr.58.4.5. - DOI - PubMed
-
- Rogue A, Anthérieu S, Vluggens A, Umbdenstock T, Claude N, de la Moureyre-Spire C, Weaver RJ, Guillouzo A. PPAR agonists reduce steatosis in oleic acid-overloaded HepaRG cells. Toxicol Appl Pharmacol. 2014;276(1):73–81. - PubMed
-
- Hashimoto T, Cook WS, Qi C, Yeldandi AV, Reddy JK, Rao MS. Defect in peroxisome proliferator-activated receptor alpha-inducible fatty acid oxidation determines the severity of hepatic steatosis in response to fasting. J Biol Chem. 2000;275(37):28918–28928. doi: 10.1074/jbc.M910350199. - DOI - PubMed
MeSH terms
Substances
LinkOut - more resources
Full Text Sources
Other Literature Sources
Medical
