. 2018 Feb 5;15(1):33.
doi: 10.1186/s12974-017-1044-x.

18F-VC701-PET and MRI in the in vivo neuroinflammation assessment of a mouse model of multiple sclerosis

Affiliations

18F-VC701-PET and MRI in the in vivo neuroinflammation assessment of a mouse model of multiple sclerosis

Sara Belloli et al. J Neuroinflammation. .

Abstract

Background: Positron emission tomography (PET) using translocator protein (TSPO) ligands has been used to detect neuroinflammatory processes in neurological disorders, including multiple sclerosis (MS). The aim of this study was to evaluate neuroinflammation in a mouse MS model (EAE) using TSPO-PET with 18F-VC701, in combination with magnetic resonance imaging (MRI).

Methods: MOG35-55/CFA and pertussis toxin protocol was used to induce EAE in C57BL/6 mice. Disease progression was monitored daily, whereas MRI evaluation was performed at 1, 2, and 4 weeks post-induction. Microglia activation was assessed in vivo by 18F-VC701 PET at the time of maximum disease score and validated by radioligand ex vivo distribution and immunohistochemistry at 2 and 4 weeks post-immunization.

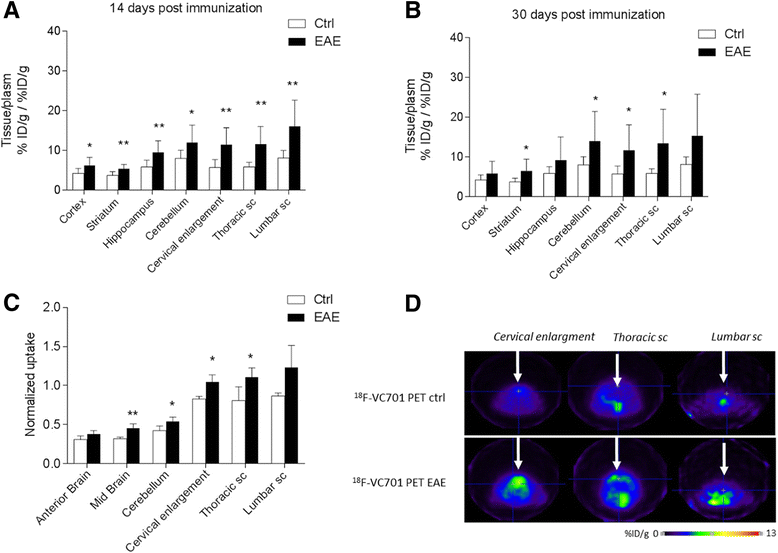
Results: In vivo and ex vivo analyses show that 18F-VC701 significantly accumulates within the central nervous system (CNS), particularly in the cortex, striatum, hippocampus, cerebellum, and cervical spinal cord of EAE compared to control mice, at 2 weeks post-immunization. MRI confirmed the presence of focal brain lesions at 2 weeks post-immunization in both T1-weighted and T2 images. Of note, MRI abnormalities attenuated in later post-immunization phase. Neuropathological analysis confirmed the presence of microglial activation in EAE mice, consistent with the in vivo increase of 18F-VC701 uptake.

Conclusion: Increase of 18F-VC701 uptake in EAE mice is strongly associated with the presence of microglia activation in the acute phase of the disease. The combined use of TSPO-PET and MRI provided complementary evidence on the ongoing disease process, thus representing an attractive new tool to investigate neuronal damage and neuroinflammation at preclinical levels.

Keywords: EAE monophasic model; MRI; Multiple sclerosis; Neuroinflammation; TSPO-PET.


Conflict of interest statement

Ethics approval

Animals were maintained and handled in compliance with the institutional guidelines for the care and use of experimental animals (IACUC), which have been notified to the Italian Ministry of Health and approved by the Ethics Committee of the San Raffaele Scientific Institute for studies involving animals.

Consent for publication

Not applicable.

Competing interests

The authors declare that they have no competing of interests.

Publisher’s Note

Springer Nature remains neutral with regard to jurisdictional claims in published maps and institutional affiliations.

Figures
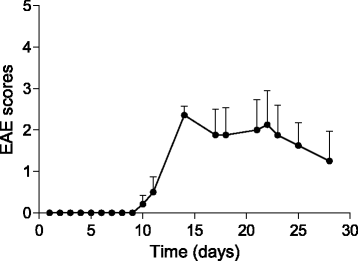
Fig. 1
Fig. 1
Clinical score of MOG35-55/CFA-immunized (EAE) mice. Graphical representation of clinical score of EAE mice evaluated daily after disease induction; mean scores ± SEM
Fig. 2
Fig. 2
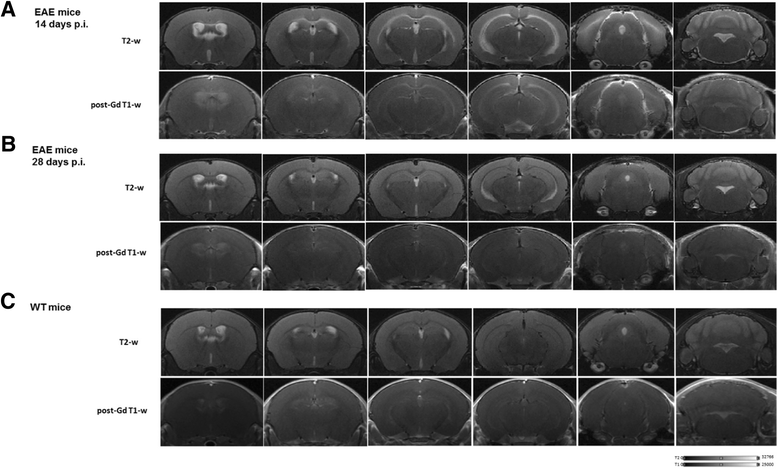
Magnetic resonance imaging (MRI) longitudinal study of a representative EAE mouse and healthy control. a Selected coronal MRI images acquired at 14 days p.i. showing focal lesions in T2-weighted and post-contrast T1-Gd-weighted images in different brain areas including hippocampus, corpus callosum, external capsule, and periventricular white matter. b Coronal T2 and T1-Gd MRI images acquired at 28 days p.i., representing the same brain coordinates of those shown in a. T2-enhanced regions are limited to the periventricular white matter and in the ventral aspect of hippocampus. EAE selected mouse exhibit 2.5 as clinical score at acute time point and 0 at late time point. c Selected coronal T2-weighted and post-contrast T1-Gd-weighted MRI images of a healthy control mouse
Fig. 3
Fig. 3
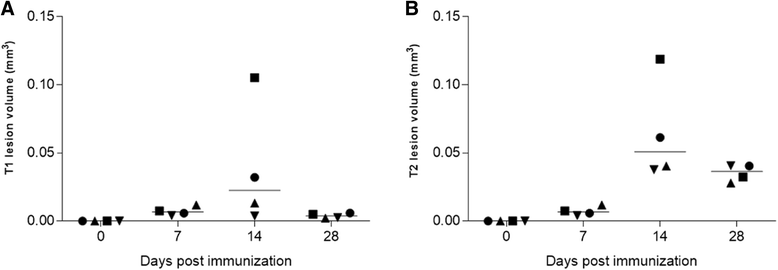
Magnetic resonance lesion volume measured in EAE mice brain. a T1-Gd-enhanced lesion volumes in four EAE mice measured at different time points after immunization. b T2 lesion volumes obtained in the same four EAE mice analyzed with T1-Gd MRI at different time points after immunization. Lesion volumes are expressed in millimeter cube and represented as single point including median; statistical analysis is performed using Mann-Whitney test
Fig. 4
Fig. 4
Ex vivo (a) and in vivo (b) distribution of 18F-VC701 in several regions of the central nervous system, in control and EAE mice. Regional distribution data are expressed as tissue to plasma ratios measured ex vivo at 14 (a) and 30 (b) days post-immunization. Regional distribution measured in vivo with PET at 14 days after immunization are expressed as tissue to muscle ratio (c); data are calculated as mean ± SD value; test T, *p < 0.05 vs controls. Representative PET images from the spinal cord of an EAE mouse with clinical score 2 at 14 days after immunization and healthy control mice injected with 18F-VC701 are shown (d)
Fig. 5
Fig. 5
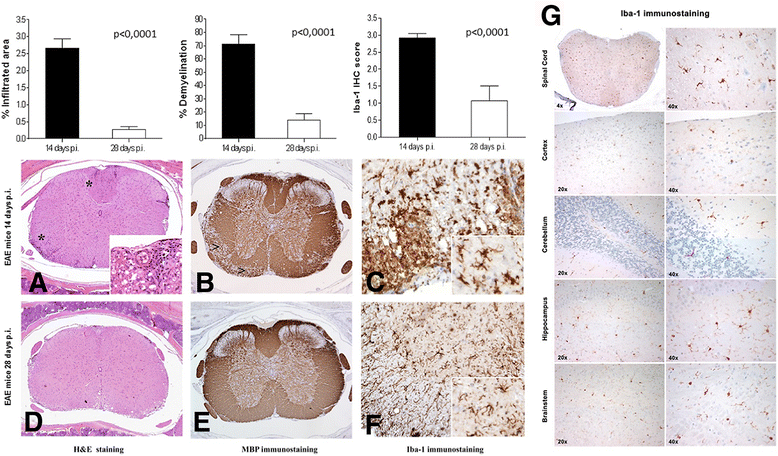
Histology and immunohistochemistry analysis. H&E staining of lumbar spinal cord sections of EAE mice sacrificed at 14 and 28 days p.i. (a, d; left graph). The degree of inflammation was higher during the acute phase of the disease (14 days p.i.), while barely detected in mice at 28 days p.i. Magnification shown in the inset from a revealed foci of inflammation (indicated by asterisks in the panel). Demyelination followed the same trend than inflammation passing from 14 to 28 days p.i. (b, e; middle graph), as indicated by arrows. At 2 weeks p.i. Iba-1 positive microglia and macrophage cells were highly represented, while scarcely detected at 4 weeks p.i. (c, f; right graph). Inset from c and f shows details on different microglia morphology during the two disease phases. Images a, b, d, and e, ×2 original magnification; images c and f, ×20 original magnification; insets, ×60 original magnification. Iba-1 positive staining images at different magnification (×20 and ×40) obtained from the cerebellum, cortex, hippocampus, and brain stem representative of one EAE mice sacrificed at 14 days p.i.. Iba-1 positive staining is visible in all brain regions but is particularly evident in cerebellum, brainstem, and hippocampus (g)
Fig. 6
Fig. 6
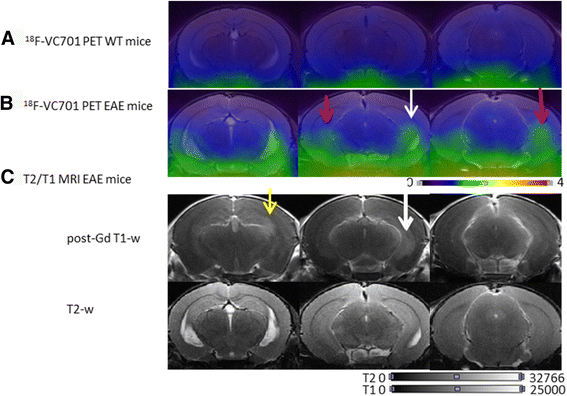
In vivo PET and MRI images representative of a healthy control and one of the EAE mouse (clinical score at 14 d.p.i. corresponding to 2 and 2.5 at 28 d.p.i.) evaluated at 14 days post-immunization. a 18F-VC701 PET and MRI co-registered coronal images of a healthy control; b 18F-VC701 PET and MRI co-registered coronal images from a EAE mice. c Corresponding MRI post-gadolinium T1-weighted (post-Gd T1-w) and T2-weighted (T2-w) images of the animal shown in b. Damaged brain areas are indicated by arrows. Some of these areas are overlapped in both PET and MRI (left hippocampus, white arrow); others are evident only in PET (bilateral hippocampi, red arrows) or in post-contrast MRI (yellow arrow) images. In the ventral part of coronal images of both control and EAE animals is present a marked region of radioactivity uptake deriving from non-specific accumulation of the tracer in extra-cerebral regions

Similar articles

Cited by

References

    1. Browne P, Chandraratna D, Angood C, Tremlett H, Baker C, Taylor BV, Thompson AJ. Atlas of multiple sclerosis 2013: a growing global problem with widespread inequity. Neurology. 2014;83:1022–1024. doi: 10.1212/WNL.0000000000000768. - DOI - PMC - PubMed
    1. Schneider A, Araujo GW, Trajkovic K, Herrmann MM, Merkler D, Mandelkow EM, Weissert R, Simons M. Hyperphosphorylation and aggregation of tau in experimental autoimmune encephalomyelitis. J Biol Chem. 2004;279:55833–55839. doi: 10.1074/jbc.M409954200. - DOI - PubMed
    1. Trivedi A, Olivas AD, Noble-Haeusslein LJ. Inflammation and spinal cord injury: infiltrating leukocytes as determinants of injury and repair processes. Clin Neurosci Res. 2006;6:283–292. doi: 10.1016/j.cnr.2006.09.007. - DOI - PMC - PubMed
    1. Rasmussen S, Parsons AJ, Bassett S, Christensen MJ, Hume DE, Johnson LJ, Johnson RD, Simpson WR, Stacke C, Voisey CR, et al. High nitrogen supply and carbohydrate content reduce fungal endophyte and alkaloid concentration in Lolium perenne. New Phytol. 2007;173:787–797. doi: 10.1111/j.1469-8137.2006.01960.x. - DOI - PubMed
    1. Coombs BD, Best A, Brown MS, Miller DE, Corboy J, Baier M, Simon JH. Multiple sclerosis pathology in the normal and abnormal appearing white matter of the corpus callosum by diffusion tensor imaging. Mult Scler. 2004;10:392–397. doi: 10.1191/1352458504ms1053oa. - DOI - PubMed

MeSH terms